. 2023 May 26;224(2):iyad064.
doi: 10.1093/genetics/iyad064.

Visual processing in the fly, from photoreceptors to behavior

Affiliations

Visual processing in the fly, from photoreceptors to behavior

Timothy A Currier et al. Genetics. .

Abstract

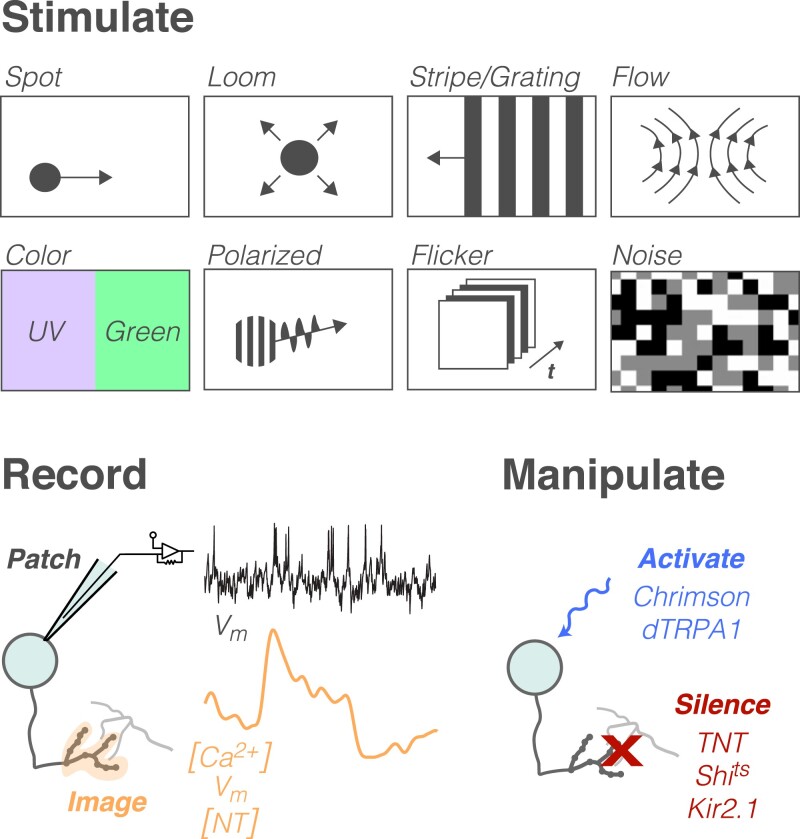
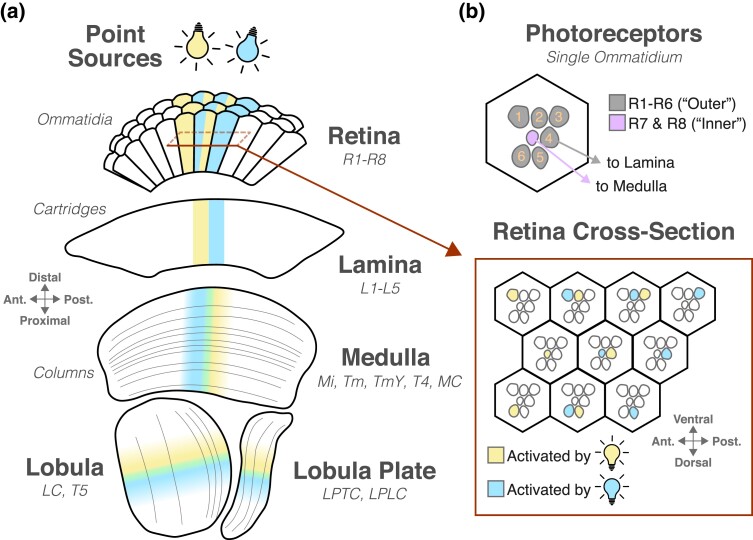
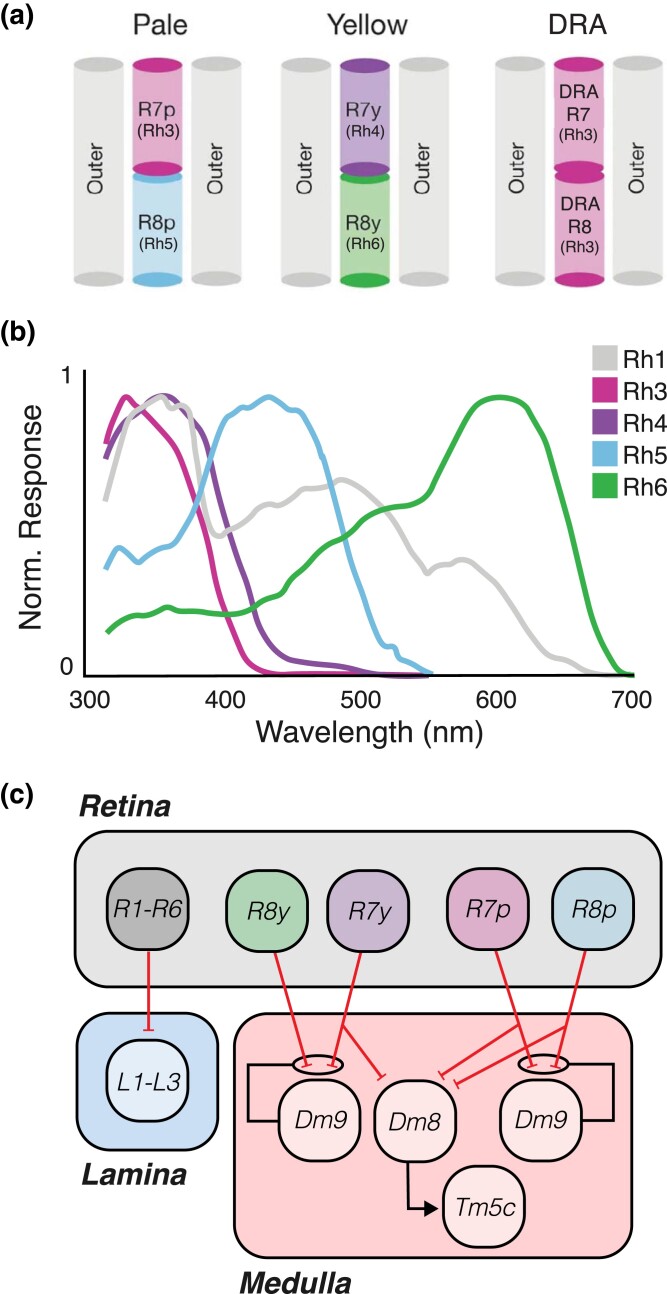
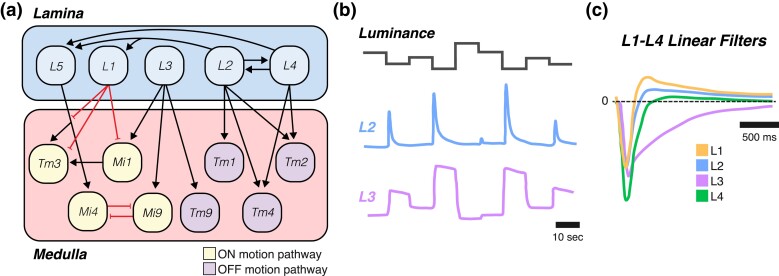
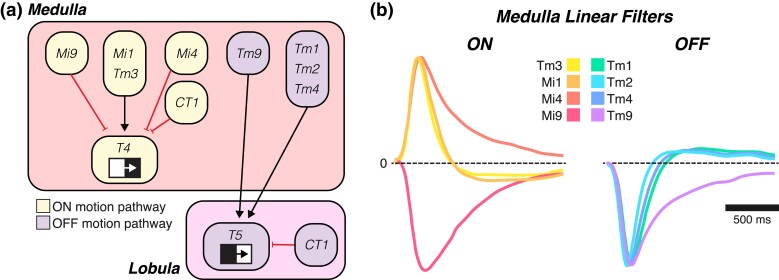
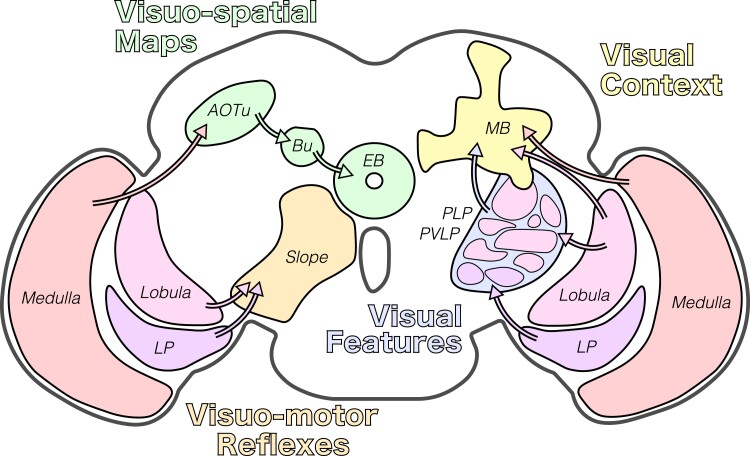
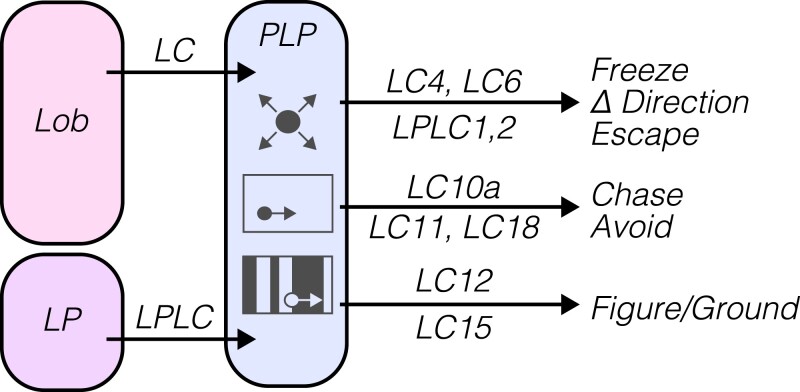
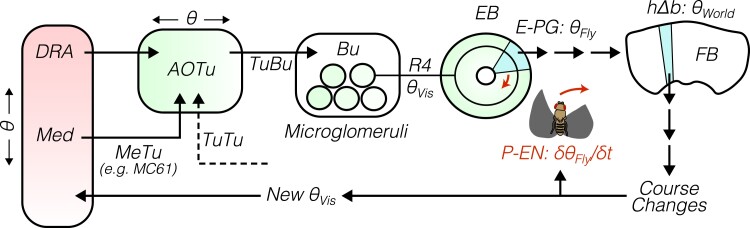
Originally a genetic model organism, the experimental use of Drosophila melanogaster has grown to include quantitative behavioral analyses, sophisticated perturbations of neuronal function, and detailed sensory physiology. A highlight of these developments can be seen in the context of vision, where pioneering studies have uncovered fundamental and generalizable principles of sensory processing. Here we begin with an overview of vision-guided behaviors and common methods for probing visual circuits. We then outline the anatomy and physiology of brain regions involved in visual processing, beginning at the sensory periphery and ending with descending motor control. Areas of focus include contrast and motion detection in the optic lobe, circuits for visual feature selectivity, computations in support of spatial navigation, and contextual associative learning. Finally, we look to the future of fly visual neuroscience and discuss promising topics for further study.

Keywords: FlyBook; anatomy; behavior; computation; learning; navigation; neuroscience; physiology; vision.


Conflict of interest statement

Conflicts of interest The author(s) declare no conflict of interest.

Figures

Fig. 1.
Fig. 1.
Tools and techniques to probe visual circuits. Top: illustrations of select visual stimuli. Bottom-left: recording methods. Membrane potential (Vm) can be recorded via both patch clamp and imaging, while intracellular calcium concentration ([Ca2+]) and extracellular neurotransmitter concentration ([NT]) are most often measured with optical techniques. Bottom-right: common techniques for manipulating neuron function. See text for additional information about each tool.
Fig. 2.
Fig. 2.
a) Overview of the compound eye and visual system anatomy. A simplified horizontal section through the optic lobe shows the organization of the early visual system. The portions of each neuropil that are activated by 2 adjacent point sources of light are highlighted in blue and yellow. Green indicates a mixing of signals from both sources. Red box indicates the location of the retinal cross-section shown in b). For regions with prominent laminar organization, layers are shown as thin gray lines. The primary feedforward cell types are listed for each neuropil. b) Top: a simplified cross-section through a single ommatidium shows the spatial arrangement of individual photoreceptors. Bottom: “Superposition” is illustrated in a cross-section through the retina, as indicated by the red box in a). The pattern of photoreceptors that respond to the blue and yellow point sources is shown.
Fig. 3.
Fig. 3.
Photoreceptors transduce light of specific wavelength. a) Arrangement of photoreceptors in pale, yellow, and dorsal rim area ommatidia. In all cases, R1–R6 outer photoreceptors flank stacked R7 and R8 inner photoreceptors. The rhodopsin variants expressed in R7 and R8 determine ommatidium type. Adapted from Sharkey et al. (2020). b) Normalized photoreceptor responses by wavelength and opsin. Adapted from Sharkey et al. (2020). c) Downstream targets of photoreceptors. All photoreceptor types project from the retina (gray) and make inhibitory connections (red lines) in the lamina (blue) or medulla (pink). R7 and R8 segregate by ommatidium type and synapse onto Dm9 neurons in the medulla, which feedback presynaptically to mediate color opponency. Dm8 and Tm5c are known to mediate spectral preference behavior. Black lines indicate excitatory connections.
Fig. 4.
Fig. 4.
Contrast and luminance representation in the lamina. a) Wiring diagram of the ON motion (yellow) and OFF motion (purple) pathways in the lamina and medulla. ON/OFF here refers only to whether a neuron is upstream of the ON or OFF motion detectors (T4 or T5) and does not necessarily mean that the neuron itself is ON or OFF selective. Colors as in Fig. 3c. b) Schematic plots of L2 (blue) and L3 (purple) responses to changes in luminance. L2 responds only to decreases in luminance (OFF contrast), while L3 shows sustained OFF activity. Adapted from Ketkar et al. (2020). c) Temporal filters for L1–L4. L1 (orange), L2 (blue), and L4 (green) are biphasic and are therefore contrast selective. L3 (purple) is monophasic and is therefore luminance selective. Dashed line indicates the vertical position where filter strength is 0. Adapted from Clark et al. (2011) and Silies et al. (2013).
Fig. 5.
Fig. 5.
Inputs to the T4/T5 motion detector. a) Wiring diagram of the ON motion (yellow) and OFF motion (purple) pathways in the medulla and lobula. ON/OFF here refers only to whether a neuron is upstream of the ON or OFF motion detectors (T4 or T5) and does not necessarily mean that the neuron itself is ON or OFF selective. Each CT1 terminal functions independently, and the cell as a whole contributes to both ON and OFF motion. The spatial arrangement of inputs represents their relative anatomical positioning, with the leading edge on the left. b) Temporal filters for the ON (left) and OFF (right) motion pathways. Mi1 and Tm1–Tm4 are more biphasic, whereas Mi4, Mi9, and Tm9 are slower and more monophasic. Mi9 responds negatively to ON stimuli, unlike the rest of the ON motion pathway inputs. Plotting conventions as in Fig. 4c. Adapted from Arenz et al. (2017).
Fig. 6.
Fig. 6.
Optic lobe signals are widely distributed across the brain. A simplified coronal section through the fly brain is shown, with major vision-responsive neuropil drawn in different colors. Outputs from the optic lobe (medulla, lobula, and lobula plate) to 4 central brain structures are highlighted: the anterior visual pathway (green), the mushroom body (yellow), the optic glomeruli (blue), and the posterior slope (orange). The categories of visual information represented in each of these regions are indicated by colored text.
Fig. 7.
Fig. 7.
LCs and LPLCs are selective for diverse and behaviorally relevant visual features. A simplified illustration of lobula (Lob, pink) and lobula plate (LP, purple) inputs to the posterior (ventro-)lateral protocerebrum (PLP, blue) is shown. Select PLP visual representations are also schematized: loom (top), small moving objects (middle), and figure/ground discrimination (bottom). LC and LPLC types associated with each representation are indicated.
Fig. 8.
Fig. 8.
The anterior visual pathway (AVP) and coordinate transformations in the central complex. A simplified illustration of the anterior visual pathway is shown, with color gradients indicating different portions of visual space. Arrows indicate connections between neuropil, and the cell types that make some of these connections are noted. The anterior visual pathway relays a visual object's position in retinal coordinates (θVis), which are used to represent the fly's heading direction (θFly) as a bump of activity in E-PG neurons of the ellipsoid body (EB). When the fly turns, changes to θFly (δθFly/δt) are represented in P-EN neurons, which rotate the E-PG activity bump. In the fan-shaped body (FB), θFly is transformed into allocentric coordinates (θWorld) in hΔb neurons. See text for additional details. Med, medulla; DRA, dorsal rim area; AOTu, anterior optic tubercle; Bu, bulb.
Fig. 9.
Fig. 9.
Color and luminance are contextual cues for visual learning in the mushroom body (MB, yellow). Lobula (pink) and medulla (red) inputs to the mushroom body are schematized, with arrows indicating connections between brain regions. Known cell types that form these connections are indicated. Medulla outputs carry information about the spectral content and brightness of ambient light to the ventral accessory calyx (vACA), while lobula outputs directly and indirectly connect to the dorsal accessory calyx (dACA). Visual inputs do not innervate the main calyx, where olfactory information enters the mushroom body. Distinct Kenyon cell (KC) populations carry information from the accessory calyces to mushroom body output neurons (MBONs), and dopaminergic neurons (DANs) modify the strength of this connection based on reward or punishment, facilitating associative learning.
Fig. 10.
Fig. 10.
Descending neuron control of vision-guided locomotion. A simplified illustration of visual input to select DN populations is shown, with arrows indicating connections between brain regions. Known cell types that form these connections are indicated. Lobula plate (purple) outputs from the horizontal and vertical systems (HS and VS) carry information about wide-field optic flow to course-controlling DNs in the posterior slope (orange). Some lobula (pink) outputs also connect to DNs in this region.

References

    1. Ache JM, Namiki S, Lee A, Branson K, Card GM. State-dependent decoupling of sensory and motor circuits underlies behavioral flexibility in Drosophila. Nat Neurosci. 2019a;22(7):1132–1139. doi:10.1038/s41593-019-0413-4. - DOI - PMC - PubMed
    1. Ache JM, Polsky J, Alghailani S, Parekh R, Breads P, Peek MY, Bock DD, von Reyn CR, Card GM. Neural basis for looming size and velocity encoding in the Drosophila giant fiber escape pathway. Curr Biol. 2019b;29(6):1073–1081.e4. doi:10.1016/j.cub.2019.01.079. - DOI - PubMed
    1. Adelson EH, Bergen JR. Spatiotemporal energy models for the perception of motion. J Opt Soc Am A. 1985;2(2):284–299. doi:10.1364/JOSAA.2.000284. - DOI - PubMed
    1. Agrawal S, Safarik S, Dickinson M. The relative roles of vision and chemosensation in mate recognition of Drosophila melanogaster. J Exp Biol. 2014;217(Pt 15):2796–2805. doi:10.1242/jeb.105817. - DOI - PubMed
    1. Agrochao M, Tanaka R, Salazar-Gatzimas E, Clark DA. Mechanism for analogous illusory motion perception in flies and humans. Proc Natl Acad Sci U S A. 2020;117(37):23044–23053. doi:10.1073/pnas.2002937117. - DOI - PMC - PubMed

Publication types

LinkOut - more resources