. 2023 May;16(5):e011677.
doi: 10.1161/CIRCEP.122.011677. Epub 2023 May 2.

Heterogeneity of Repolarization and Cell-Cell Variability of Cardiomyocyte Remodeling Within the Myocardial Infarction Border Zone Contribute to Arrhythmia Susceptibility

Affiliations

Heterogeneity of Repolarization and Cell-Cell Variability of Cardiomyocyte Remodeling Within the Myocardial Infarction Border Zone Contribute to Arrhythmia Susceptibility

Matthew Amoni et al. Circ Arrhythm Electrophysiol. 2023 May.

Abstract

Background: After myocardial infarction, the infarct border zone (BZ) is the dominant source of life-threatening arrhythmias, where fibrosis and abnormal repolarization create a substrate for reentry. We examined whether repolarization abnormalities are heterogeneous within the BZ in vivo and could be related to heterogeneous cardiomyocyte remodeling.

Methods: Myocardial infarction was induced in domestic pigs by 120-minute ischemia followed by reperfusion. After 1 month, remodeling was assessed by magnetic resonance imaging, and electroanatomical mapping was performed to determine the spatial distribution of activation-recovery intervals. Cardiomyocytes were isolated and tissue samples collected from the BZ and remote regions. Optical recording allowed assessment of action potential duration (di-8-ANEPPS, stimulation at 1 Hz, 37 °C) of large cardiomyocyte populations while gene expression in cardiomyocytes was determined by single nuclear RNA sequencing.

Results: In vivo, activation-recovery intervals in the BZ tended to be longer than in remote with increased spatial heterogeneity evidenced by a greater local SD (3.5±1.3 ms versus remote: 2.0±0.5 ms, P=0.036, npigs=5). Increased activation-recovery interval heterogeneity correlated with enhanced arrhythmia susceptibility. Cellular population studies (ncells=635-862 cells per region) demonstrated greater heterogeneity of action potential duration in the BZ (SD, 105.9±17.0 ms versus remote: 73.9±8.6 ms; P=0.001; npigs=6), which correlated with heterogeneity of activation-recovery interval in vivo. Cell-cell gene expression heterogeneity in the BZ was evidenced by increased Euclidean distances between nuclei of the BZ (12.1 [9.2-15.0] versus 10.6 [7.5-11.6] in remote; P<0.0001). Differentially expressed genes characterizing BZ cardiomyocyte remodeling included hypertrophy-related and ion channel-related genes with high cell-cell variability of expression. These gene expression changes were driven by stress-responsive TFs (transcription factors). In addition, heterogeneity of left ventricular wall thickness was greater in the BZ than in remote.

Conclusions: Heterogeneous cardiomyocyte remodeling in the BZ is driven by uniquely altered gene expression, related to heterogeneity in the local microenvironment, and translates to heterogeneous repolarization and arrhythmia vulnerability in vivo.

Keywords: arrhythmias; cardiac remodeling; hypertrophy; magnetic resonance imaging; myocardial infarction; single-cell gene expression analysis; voltage-sensitive dye imaging.


Conflict of interest statement

Disclosures Dr Willems reports research funding and speakers and consultancy fees from Abbott. The other authors report no conflicts.

Figures

Figure 1.
Figure 1.
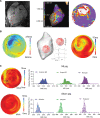
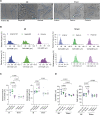
Regional activation-recovery intervals (ARIs) in vivo after myocardial infarction (MI). A, Example of cardiac magnetic resonance imaging (left) with corresponding electroanatomical map (middle) and contact voltage polar map (right) illustrating the extent of infarct (infarct size, 18.2%; ejection fraction, 46.8%), and the electroanatomical border zone (BZ) defined as bipolar voltage between 0.5 and 1.5 mV, with the white area the infarct zone. B, Left, Noncontact electrogram ARI map calculated with the E-field method. Middle, Local ARI heterogeneity, the spatial repolarization heterogeneity (around the yellow center point) is defined as SD of ARIs within the 1-cm radius. Right, Polar map of ARI heterogeneity. The outer edge of the infarct and border zone are annotated on the polar maps using dotted and full lines, respectively. C, Examples of polar maps of the local ARI heterogeneity of the left ventricle (LV; left) and corresponding regional distribution of ARIs (right) in MI (top) and Sham (bottom). MVA indicates mitral valve annulus.
Figure 2.
Figure 2.
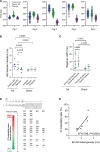
Quantification of in vivo heterogeneity of repolarization. A, Regional in vivo activation-recovery intervals (ARIs) from myocardial infarction (MI). Pooled data on ARIs of the different regions in vivo for each MI (npigs=5, nARIs=112–468 per region). B, Regional ARI heterogeneity. Summary data of ARI heterogeneity quantified by regional SD per pig from A. Mixed-effects model ANOVA with Bonferroni post test. C, Regional heterogeneity difference. Regional differences in ARI dispersion quantified by pig as mean ARI differences. Mixed-effects model ANOVA with Bonferroni post test. D, Illustration of ventricular tachycardia induction protocol and the scale to quantify ease of induction. E, Arrhythmogenicity correlation. Correlation of in vivo border zone (BZ) heterogeneity and arrhythmia inducibility in MI. n=8. Linear regression analysis.
Figure 3.
Figure 3.
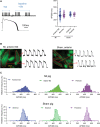
Action potential duration at 90% repolarization (APD90) of isolated myocytes from different regions. A, Left, Protocol and representative example of 30 steady-state action potentials recorded under patch-clamp and averaged for analysis. Right, Summary of regional cellular APD90 profiles from myocardial infarction (MI; npigs=7, ncells=4–9 per region) and Sham (npigs=6, ncells=4–8 per region). Multilevel mixed-model ANOVA with Bonferroni correction. B, Examples of border zone (BZ; left) and Sham (right) cells loaded with the voltage dye di-8ANEPPS and corresponding action potentials recorded. Scale bar, 25 µm. C, Examples of the distribution of cellular APD90 of populations of isolated cells from each region of an MI (ncells=212–312 per region) and Sham pig (ncells=133–254 per region) illustrating increased heterogeneity in the MI BZ.
Figure 4.
Figure 4.
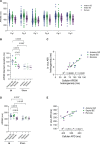
Quantification of regional cellular action potential duration heterogeneity. A, Regional cellular action potential duration at 90% repolarization (APD90) in each myocardial infarction (MI) animal, npigs=6 (ncells=86–216 per region). B, Regional APD90 heterogeneity. Summary of cellular APD90 heterogeneity as SD per pig, mixed-model ANOVA with Bonferroni post test. C, Correlation of regional cellular and in vivo heterogeneity in MI (npigs=5), linear regression analysis. D, Regional repolarization duration. Mean data of cellular APD90 pooled by pig from A, mixed-model ANOVA with Bonferroni post test. E, Correlation of regional cellular and in vivo repolarization duration in MI (npigs=5), linear regression analysis.
Figure 5.
Figure 5.
Heterogeneity of cellular hypertrophic remodeling after myocardial infarction (MI). A, Examples of isolated cells illustrating regional cell size profiles from an MI pig (left) and sham pig (right). Scale, 50 µm. B, Cell width (top) and cell length (bottom) distribution by region. Examples of the distribution profile of populations of isolated cells from an MI (left) and Sham pig (right). C, Regional variability of cellular dimensions. Left, Variability of cell width and right, of cell length, as quantified by the SD per pig from MI (npigs=6, ncells=86–216) and Sham (npigs=7, ncells=90–330). Mixed-model ANOVA with Bonferroni post test. D, Regional differences of cellular dimensions. Mean data of cell width (right) and cell length (left) per pig from data set in C.
Figure 6.
Figure 6.
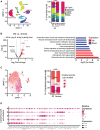
Border zone (BZ) cardiomyocytes have a unique transcriptomic signature. A, Major cardiac cell types. Left, Uniform manifold approximation and projection (UMAP). Right, Fraction of cardiac cell types per region/condition (npigs=3 myocardial infarction [MI], 2 Sham; nnuclei=46 028). χ2 test with Bonferroni adjustment; error bars represent 95% CI. B. Differential gene expression in cardiomyocytes from BZ compared with remote presented as a log to the base 2 fold change (Log2 FC). Left, differentially expressed genes (Padj<0.05; log2FC, >0.25 and <−0.25, indicated by dashed lines on the volcano plot) detected with DESeq2. Right, Gene ontology and the Kyoto Encyclopedia of Genes and Genomes pathway analysis of the differentially expressed genes. C, Cardiomyocyte subclusters and distribution. Left, Clustering of cardiomyocyte nuclei from BZ and remote reveals 5 cardiomyocyte subclusters. Right, Proportion of cardiomyocyte subclusters in MI BZ and remote (npigs=3, nnuclei=10 675). χ2 test with Bonferroni adjustment, error bars represent 95% CI. D. Gene expression profiles defining the 5 cardiomyocyte subclusters.
Figure 7.
Figure 7.
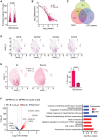
Cell-cell variability of cardiomyocyte gene expression within the border zone (BZ). A, Cell-cell variability in BZ cardiomyocytes. Euclidean distances of cardiomyocyte nuclei. nnuclei=10 675; npigs=3. Each dot represents a nucleus. Box plots are visualizing the median and interquartile range, and the whiskers are upper/lower quartiles±1.5×interquartile ranges (P value refers to a nested t test). B, Gene expression variability in BZ cardiomyocytes. Dispersion of gene expression in BZ compared with remote cardiomyocyte nuclei. The highly variable genes (HVGs) in BZ compared with remote nuclei are marked with bold dots (expected false discovery rate <0.10, the genes with at least 50% increase in biological overdispersion are defined as HVGs based on a Bayesian inference model). The solid line represents the best fit model of the gene expression variability against expression. (Continued )Figure 7 Continued. The gray bars represent the 95% CI of this model. C, Significantly variable genes in the BZ cardiomyocytes. Overlap between the HVGs, differentially expressed genes (DEGs) in the BZ compared with remote presented as a log to the base 2 fold change (Log2 FC) in gene expression on the volcano plot, and excitation-contraction coupling (ECC)–related genes. D, Distribution of overexpressed and highly variable genes in BZ. Illustrated are the 4 HVGs, which are also detected as DEGs, across cardiomyocyte subclusters in the BZ. E, Regional distribution of Natriuretic Peptide B mRNA expressing nuclei (NPPB+). Left, Presence of NPPB+ nuclei shown in uniform manifold approximation and projection (UMAP) of myocardial infarction (MI) BZ and remote cardiomyocytes. Right, Fraction of NPBB+ nuclei in BZ compared with remote (nnuclei=10 675, npigs=3 MI). χ2 test, error bars represent 95% CI. F, Differential gene expression in NPPB+ vs NPPB− BZ cardiomyocytes. Left, DEGs in NPPB+ vs NPPB− nuclei in the BZ (Padj<0.05; log2FC, >0.25 and <−0.25). Right, Gene ontology analysis of the DEGs between NPPB+ vs NPPB− nuclei in the BZ.
Figure 8.
Figure 8.
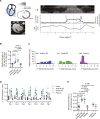
Heterogeneous regional left ventricular (LV) wall properties after myocardial infarction (MI) in vivo. A, Measuring local wall stress. Left, Illustration of short-axis magnetic resonance imaging (MRI) slice analysis of regional wall properties of thickness and curvature. Right, Example of a cardiac MRI (cMRI) midventricular slice demonstrating LV segmentation and corresponding regional wall property analysis based on signal intensity of the late gadolinium enhancement (LGE) signal. B, Heterogeneity of scar tissue within the border zone (BZ). Summary data of variability of mean intensity of LGE signal in the cMRI slices from MI (npigs=6, nslices=10–14). One-way ANOVA with Bonferroni post test. C, Example of distribution of the variability of wall thickness by region in an MI pig. Plot of regional variance (σ2) of wall thickness (nslices=10–14) illustrating increased heterogeneity in the MI BZ. D, Regional variance (σ2) of wall thickness in vivo. Data from each slice per MI pig (npigs=6, nslices=10–14). E, Regional heterogeneity of wall thickness. Summary data of the heterogeneity, quantified by SD from D. Mixed-model ANOVA with Bonferroni post test.

References

    1. Solomon SD, Zelenkofske S, McMurray JJV, Finn PV, Velazquez E, Ertl G, Harsanyi A, Rouleau JL, Maggioni A, Kober L, et al. ; Valsartan in Acute Myocardial Infarction Trial (VALIANT) Investigators. Sudden death in patients with myocardial infarction and left ventricular dysfunction, heart failure, or both. N Engl J Med. 2005;352:2581–2588. doi: 10.1056/NEJMoa043938 - PubMed
    1. Pashakhanloo F, Herzka DA, Halperin H, McVeigh ER, Trayanova NA. Role of 3-dimensional architecture of scar and surviving tissue in ventricular tachycardia. Circ Arrhythm Electrophysiol. 2018;11:e006131. doi: 10.1161/CIRCEP.117.006131 - PMC - PubMed
    1. Martin R, Maury P, Bisceglia C, Wong T, Estner H, Meyer C, Dallet C, Martin CA, Shi R, Takigawa M, et al. . Characteristics of scar-related ventricular tachycardia circuits using ultra-high-density mapping. Circ Arrhythm Electrophysiol. 2018;11:e006569. doi: 10.1161/CIRCEP.118.006569 - PubMed
    1. Nieves-Cintrón M, Hirenallur-Shanthappa D, Nygren PJ, Hinke SA, Dell’Acqua ML, Langeberg LK, Navedo M, Santana LF, Scott JD. AKAP150 participates in calcineurin/NFAT activation during the down-regulation of voltage-gated K+ currents in ventricular myocytes following myocardial infarction. Cell Signal. 2016;28:733–740. doi: 10.1016/j.cellsig.2015.12.015 - PMC - PubMed
    1. Rossow CF, Minami E, Chase EG, Murry CE, Santana LF. NFATc3-induced reductions in voltage-gated K+ currents after myocardial infarction. Circ Res. 2004;94:1340–1350. doi: 10.1161/01.RES.0000128406.08418.34 - PubMed

Publication types