. 2023 May 2:12:e84330.
doi: 10.7554/eLife.84330.

Mitochondrial protein import clogging as a mechanism of disease

Affiliations

Mitochondrial protein import clogging as a mechanism of disease

Liam P Coyne et al. Elife. .

Abstract

Mitochondrial biogenesis requires the import of >1,000 mitochondrial preproteins from the cytosol. Most studies on mitochondrial protein import are focused on the core import machinery. Whether and how the biophysical properties of substrate preproteins affect overall import efficiency is underexplored. Here, we show that protein traffic into mitochondria can be disrupted by amino acid substitutions in a single substrate preprotein. Pathogenic missense mutations in ADP/ATP translocase 1 (ANT1), and its yeast homolog ADP/ATP carrier 2 (Aac2), cause the protein to accumulate along the protein import pathway, thereby obstructing general protein translocation into mitochondria. This impairs mitochondrial respiration, cytosolic proteostasis, and cell viability independent of ANT1's nucleotide transport activity. The mutations act synergistically, as double mutant Aac2/ANT1 causes severe clogging primarily at the translocase of the outer membrane (TOM) complex. This confers extreme toxicity in yeast. In mice, expression of a super-clogger ANT1 variant led to neurodegeneration and an age-dependent dominant myopathy that phenocopy ANT1-induced human disease, suggesting clogging as a mechanism of disease. More broadly, this work implies the existence of uncharacterized amino acid requirements for mitochondrial carrier proteins to avoid clogging and subsequent disease.

Keywords: Ant1; S. cerevisiae; biochemistry; chemical biology; clogging; disease; mPOS; mitochondria; mouse; protein import.

Plain language summary

Inside our cells, compartments known as mitochondria generate the chemical energy required for life processes to unfold. Most of the proteins found within mitochondria are manufactured in another part of the cell (known as the cytosol) and then imported with the help of specialist machinery. For example, the TOM and TIM22 channels provide a route for the proteins to cross the two membrane barriers that separate the cytosol from the inside of a mitochondrion. ANT1 is a protein that is found inside mitochondria in humans, where it acts as a transport system for the cell’s energy currency. Specific mutations in the gene encoding ANT1 have been linked to degenerative conditions that affect the muscles and the brain. However, it remains unclear how these mutations cause disease. To address this question, Coyne et al. recreated some of the mutations in the gene encoding the yeast equivalent of ANT1 (known as Aac2). Experiments in yeast cells carrying these mutations showed that the Aac2 protein accumulated in the TOM and TIM22 channels, creating a ‘clog’ that prevented other essential proteins from reaching the mitochondria. As a result, the yeast cells died. Mutant forms of the human ANT1 protein also clogged up the TOM and TIM22 channels of human cells in a similar way. Further experiments focused on mice genetically engineered to produce a “super-clogger” version of the mouse equivalent of ANT1. The animals soon developed muscle and neurological conditions similar to those observed in human diseases associated with ANT1. The findings of Coyne et al. suggest that certain genetic mutations in the gene encoding the ANT1 protein cause disease by blocking the transport of other proteins to the mitochondria, rather than by directly affecting ANT1’s nucleotide trnsport role in the cell. This redefines our understanding of diseases associated with mitochondrial proteins, potentially altering how treatments for these conditions are designed.


Conflict of interest statement

LC, XW, JS, Ed, KS, PM, FM, TB, XC No competing interests declared

Figures
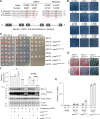
Figure 1.
Figure 1.. Super-toxic Aac2p mutants dominantly kill cells.
(A) Schematic showing the location of pathogenic mutations in transmembrane α-helices 2 and 3 of the ADP/ATP translocator in human (ANT1) compared with mouse (Ant1) and yeast (Aac2p). adPEO, autosomal dominant progressive external ophthalmoplegia. (B) Expression of double mutant aac2 alleles is highly toxic. The yeast M2915-6A strain was transformed with the centromeric vector pRS416 (URA3) expressing wild-type or mutant aac2 alleles and transformants were grown on selective glucose medium lacking uracil at 25°C for 3 days. (C) Growth of yeast cells after serial dilution, showing dominant toxicity of aac2A128P,A137D that is integrated into the genome in the W303-1B strain background. YPD, yeast peptone dextrose medium; YPGE, yeast peptone glycerol ethanol medium. (D) The aac2A128P,A137D allele dominantly increases the frequency of ‘petite’ colonies, which are white. This indicates mitochondrial DNA (mtDNA) destabilization. (E) ‘Petite’ frequencies of yeast strains expressing the mutant alleles of aac2. The strains were first grown in YPD medium for 24 hr before being plated on YPD medium for scoring ‘petite’ colonies. (F) Immunoblot analysis showing extremely low levels of Aac2pA128P,A137D (lower panels) Ilv5p was used as a loading control for mitochondrial protein. Total protein determined with total protein stain (LI-COR). Short, short exposure; Long, long exposure. Upper panel, quantitation from three independent experiments. Aac2p values were normalized by Ilv5p to control for mitochondrial content, and data were represented as relative to wild-type; * indicates p<0.05, ***p<0.001, ****p<0.0001 from one-way ANOVA with Tukey’s multiple comparisons test. Data represented as mean ± SEM.
Figure 1—figure supplement 1.
Figure 1—figure supplement 1.. Toxicity and low-level accumulation of double mutant Aac2 proteins.
(A) Yeast transformants expressing double mutant alleles of aac2 form small colonies on selective medium, which indicates the toxicity of input plasmid DNA. The yeast M2915-6A strain was transformed with the centromeric vector pRS416 (URA3) expressing wild-type or mutant aac2 alleles and transformants were grown on minimal glucose medium lacking uracil at 30°C for 3 days. This serves as a control for Figure 1B. (B) Immunoblot analysis of Aac2p after protein extraction from spheroplasts using the detergents indicated. (C) Immunoblot analysis of Aac2p in protein extracted from the detergent-insoluble pellet with additional solubilization conditions after a first round of extraction using 8 M urea plus 5% SDS.
Figure 2.
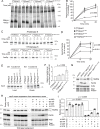
Figure 2.. Super-toxic ADP/ATP carrier 2 (Aac2) proteins clog the translocase of the outer membrane (TOM) complex.
(A) In vitro protein import assay. 35S-labeled Aac2p and mutant variants were imported into wild-type mitochondria for 10 or 20 min and analyzed by blue native electrophoresis and autoradiography. (B) Quantitation from three independent experiments depicted in (A). p-Value from two-way repeated measures ANOVA with Sidak’s multiple comparisons test. (C) 35S-labeled Aac2p and mutant variants were imported into wild-type mitochondria without (upper) or with (lower panel) subsequent proteinase K treatment to degrade non-imported preproteins. Reaction analyzed by SDS-PAGE and autoradiography. (D) Quantitation from three independent experiments depicted in (C). p-Values were calculated as in (B). (E) Preferential association of mutant Aac2p with Tom40-HA. 35S-labeled Aac2p and mutant variants were imported into Tom40-HA mitochondria, followed by anti-HA immunoprecipitation and analysis by SDS-PAGE and autoradiography. (F) Quantitation from three independent experiments depicted in (E). p-Value was calculated with a one-way ANOVA and Dunnett’s multiple comparisons test. (G) Immunoblot analysis showing accumulation of the un-cleaved precursor of Hsp60p (p) in cells expressing chromosomally integrated aac2A128P,A137D. Cells were grown in YPD at 30°C. m, mature (i.e. cleaved). (H) Immunoblot analysis showing accumulation of un-cleaved Hsp60p precursor (p) in cells expressing aac2 alleles from a centromeric vector. Cells were grown in yeast nitrogen-based dextrose media with supplemented casamino acids, lacking uracil at 25°C. (I) Quantitation from three replicates of (H). Aac2p values normalized by the mitochondrial protein Ilv5p, and then normalized to vector-transformed samples. p-Values were calculated as in (F). Data represented as mean ± SEM.
Figure 2—figure supplement 1.
Figure 2—figure supplement 1.. Acute expression of mutant Aac2p is toxic and impairs protein import.
(A) Expression of chromosomally integrated aac2A128P, aac2A137D, and aac2A128P, A137D from the GAL10 promoter on complete galactose plus raffinose medium inhibits cell growth in the W303 background. (B) Time course study showing that acute expression of the chromosomally integrated aac2A128P, aac2A137D, and aac2A128P, A137D from the GAL10 promoter leads to the accumulation of Hsp60p precursor in the presence of a wild-type copy of AAC2. (C) Western blot showing expression of chromosomally integrated aac2A128P, aac2A137D, and aac2A128P, A137D from the GAL10 promoter in an aac2Δ strain background.
Figure 3.
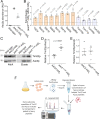
Figure 3.. Degradation of Aac2pA128P, A137D by Yme1p.
(A) Effect of MG132 on the steady-state level of Aac2A128P, A137D in a strain disrupted of PDR5 and AAC2. Cells were first grown in YPD medium at 30°C for 4 hr before MG132 was added at the indicated concentrations. Cells were cultured for another 2 or 4 hr before being harvested for western blot analysis. Sml1 was used as a control for proteasome inhibition. (B) Temperature-sensitive phenotype of ump1Δ and pre9Δ cells. Cells were grown at the indicated temperatures for 2 days before being photographed. (C) Western blot analysis showing that ump1Δ and pre9Δ do not affect the steady-state level of Aac2pA128P, A137D. Cells were grown in YPD medium for 2 and 4 hr at the restrictive temperature (37°C) before being analyzed for Aac2pA128P, A137D levels. TPS, total protein staining. (D) Western blot showing the stability of Aac2pA128P, A137D after cycloheximide (Cyh) chase in cells disrupted of YME1 or treated with MG132, following GAL10-induced synthesis of Aac2pA128P, A137D in galactose medium at 30°C for 4 hr. (E) Quantification of data for the turnover rate of Aac2pA128P, A137D (Mut) and its wild-type control (WT) depicted in (D). Aac2 levels were first normalized by total protein stain and then plotted as values relative to time zero. Depicted are mean values ± SEM from three independent experiments. p-Value was calculated with a two-way repeated measures ANOVA with Tukey’s multiple comparisons test to compare genotypes at time = 120 min.
Figure 4.
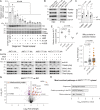
Figure 4.. Aac2pA128P accumulates along the carrier import pathway and induces protein import stress.
(A) Growth of cells after serial dilution showing that aac2A128P-HIS6 is toxic at 25°C on glucose medium in an M2915-6A-derived strain. (B) Schematic of our approach to identify aberrant protein-protein interactions of Aac2pA128P-HIS6. (C) Co-purified proteins significantly enriched in Aac2pA128P-HIS6 eluate compared with Aac2p-HIS6. See Materials and methods for details on abundance value calculation. FDR-corrected p-values depicted are from multiple t test analysis. Lower panel is a schematic of the mitochondrial carrier protein import pathway. (D) Absolute quantities of Aac2p and Tim22p in Aac2p-HIS6 and Aac2pA128P-HIS6 eluates, as determined by parallel reaction monitoring (PRM) mass spectrometry. p-Value was calculated with Student’s t test. (E–F) Tetrad analysis demonstrating lethality of aac2A128P expression with genetic defects in carrier protein import in the M2915-6A strain background. Cell were grown on YPD at 30°C. Data depicted as mean ± SEM.
Figure 4—figure supplement 1.
Figure 4—figure supplement 1.. Affinity purification in low-salt conditions suggested that Aac2pA128P accumulates along the carrier protein import pathway.
(A) Immunoblot analysis validating the HIS6-tagged Aac2p proteins. (B) Flow chart of label-free quantitative mass spectrometry data processing strategy. See Materials and methods for further details. (C) Label-free quantitative mass spectrometry demonstrated that Aac2pA128P-HIS6 was about half as abundant as Aac2p-HIS6 after total peptide normalization. This is consistent with immunoblot in (A) and underscores the need to normalize prey protein levels by bait (i.e. Aac2) protein levels. These data are from the low-salt experiment. (D) Three most significant Gene Ontology (GO) Molecular Function terms overrepresented among proteins that are significantly enriched in Aac2pA128P-HIS6 eluate in the low-salt experiment. (E) Seven most significant GO Biological Process terms overrepresented among proteins that are significantly enriched in Aac2pA128P-HIS6 eluate in the low-salt experiment. (F) Three most significant protein families overrepresented among proteins that are significantly enriched in Aac2pA128P-HIS6 eluate in the low-salt experiment, as determined from the Pfam database. (G) Immunoblot analysis validating preferential co-purification of Tim22p with Aac2pA128P-HIS6 compared with Aac2p-HIS6. (H) Quantitation from four independent affinity purifications followed by immunoblotting, as shown in (D). p-Value was calculated with Student’s t test. (I) The association of Aac2pA128P with Tim23p was not increased compared with wild-type in the low-salt experiment. These data are from label-free quantitative mass spectrometry of pull-down products. Data depicted as mean ± SEM.
Figure 4—figure supplement 2.
Figure 4—figure supplement 2.. Affinity purification in high-salt conditions confirmed that Aac2pA128P accumulates along the carrier protein import pathway.
(A) Label-free quantitative mass spectrometry demonstrated that Aac2pA128P-HIS6 was about half as abundant as Aac2p-HIS6 after total peptide normalization. This is consistent with the low-salt experiment and underscores the need to normalize prey protein levels by bait (i.e. Aac2) protein levels. (B) Co-purified proteins significantly enriched in Aac2pA128P-HIS6 eluate compared with Aac2p-HIS6 under high-salt purification conditions. FDR-corrected p-values calculated by multiple t test analysis. See Materials and methods for details on abundance values. (C) Immunoblot analysis indicating preferential co-purification of Tim22p with Aac2pA128P-HIS6 compared with Aac2p-HIS6 in high-salt conditions. (D) Quantitation from four independent affinity purifications followed by immunoblotting, as in (C). p-Value was calculated with Student’s t test. (E) The association of Aac2pA128P with Tim23p was not increased compared with wild-type in the high-salt experiment. (F) Schematic of the parallel reaction monitoring approach for targeted proteomic quantification of Aac2p and Tim22p in pull-down products. Data depicted as mean ± SEM.
Figure 4—figure supplement 3.
Figure 4—figure supplement 3.. Cellular responses to aac2A128P expression support mitochondrial protein import clogging.
(A) aac2A128P expression is not compatible with elimination of mitochondrial DNA via growth on ethidium bromide (EB) medium in strains with the BY4741/4742 background. Cells were grown at 30°C for 3–4 days. (B–F) qRT-PCR analysis monitoring the expression of CIS1, RPN4, HSP82, SSA3, and SSA4 after galactose-induced expression of AAC2 or aac2A128P from a chromosomal locus. Three biological and two technical replicates were performed for each sample. TFC1 levels used as reference. p-Values calculated with a two-way repeated measures ANOVA followed by Sidak’s multiple comparisons test. Data depicted as mean ± SEM. (G–H) Tetrad analysis demonstrating synthetic lethality between aac2A128P, A137D expression and genetic defects in phospholipid homeostasis in the W303 strain background. Cell were grown on YPD at 30°C for 3–5 days. The aac2A128P, A137D psd1Δ and aac2A128P, A137D pel1Δ cells can germinate but form barely visible microcolonies that can be only detectable under microscope.
Figure 5.
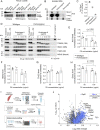
Figure 5.. ANT1A114P and ANT1A114P,A123D clog mitochondrial protein import in human cells.
(A) Combining pathogenic mutations in ADP/ATP translocase 1 (ANT1) strongly reduces protein levels, as indicated by immunoblot analysis of ANT1-hemagglutinin (HA) levels 24 hr after transfecting HeLa cells. ANT1 variant levels were normalized by TFAM, then plotted as relative to wild-type level. * indicates p<0.05, ****p<0.0001 from one-way ANOVA with Dunnett’s multiple comparisons test. (B) Immunoprecipitation (IP) of ANT1-HA and ANT1A114P-HA from transiently transfected HeLa cells followed by immunoblot analysis, showing that ANT1A114P has increased interaction with the protein import machinery like its yeast ortholog Aac2pA128P. (C) Quantitation from four independent IP, one of which is depicted in (B). p-Values were calculated with a Student’s t test. (D) Immunoblot analysis following protease protection assay showing that ANT1A114P and ANT1A114P,A123D are sensitive to proteinase K (PK) in isolated mitochondria. Swelling in hypotonic buffer was used to burst the outer membrane, and Triton X-100 was used to disrupt all membranes. OM, outer membrane; IMS, intermembrane space; IM, inner membrane. (E) Quantitation of the wild-type and mutant ANT1 pools that are protected from PK degradation in intact mitochondria. All HA levels were normalized by TFAM, then plotted as relative to its untreated sample. Replicates from three independent transfections. p-Values were calculated with a one-way ANOVA and Holm-Sidak’s multiple comparisons test. (F) ANT1A114P and ANT1A114P,A123D obstruct general mitochondrial protein import. Proteomics of the cytosolic fraction of transfected HeLa cells reveals increase in mitochondrial proteins caused by ANT1A114P-HA and ANT1A114P,A123D-HA expression relative to ANT1-HA. p-Values were calculated with a Student’s t test of the average abundance levels of each mitochondrial protein. (G) Volcano plot comparing the cytosolic proteome of SLC25A4 p.A114P,A123D vs SLC25A4-transfected HeLa cells. Data represented as mean ± SEM. (H) Enrichment analysis of proteins significantly increased in the cytosol of SLC25A4 p.A114P,A123D-transfected HeLa cells. Depicted are the most significant enriched protein groups generated from three different databases: GO: Biological Process (top), KEGG pathway (middle), and GO: Molecular Function (bottom).
Figure 5—figure supplement 1.
Figure 5—figure supplement 1.. Mutant ADP/ATP translocase 1 (ANT1) does not reduce Δψ or increase apoptosis in HeLa cells.
(A) Mutant ANT1 expression does not increase the fraction of cells with depleted Δψ compared with wild-type ANT1, as indicated by flow cytometry analysis after JC-1 dye staining. Cells treated with the ionophore carbonyl cyanide m-chlorophenyl hydrazone (CCCP) served as control for Δψ depletion. (B) Among cells that maintained Δψ, neither wild-type nor mutant SLC25A4 transfection reduced the average red fluorescence after JC-1 staining and flow cytometry analysis. The JC-1 dye fluoresces red when it aggregates at high concentration, that is after its Δψ-dependent uptake by mitochondria. In the monomer form in the cytosol, it fluoresces green. (C) Among cells with depleted Δψ, neither wild-type nor mutant Ant1 reduced the average red fluorescence after JC-1 staining and flow cytometry analysis. (D) Transient expression of wild-type and mutant ANT1 cause similar levels of cell death, as determined by flow cytometry after Annexin V-FITC and propoidium-iodide (PI) staining. Double negative cells are ‘non-apoptotic’, Annexin V-positive PI-negative cells are ‘early apoptotic’ and double positive cells are ‘dead’. Twenty-four hr treatment with 1 μM staurosporine (STS) was used as a positive control. Data represented as mean ± SEM.
Figure 6.
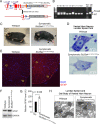
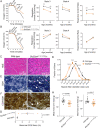
Figure 6.. Slc25a4 p.A114P,A123D/+ mouse generation and neurodegeneration.
(A) Schematic of the strategy by which the knock-in Slc25a4 p.A114P,A123D/+ knock-in mice were generated. E1–E4, exons 1–4 of Slc25a4. In gray is the inserted cDNA containing two missense mutations in exon 2, followed by the endogenous 3’ UTR. Lox gtF and gtR indicate genotyping primers. (B) Agarose gel electrophoresis of PCR genotyping using genotyping primers indicated in (A). Fl, floxed. (C) Ascending paralytic phenotype of an Slc25a4 p.A114P,A123D/+ mouse at 11 months of age, and its wild-type littermate. Arrows point to paralyzed hindlimbs. (D) Nissl-stained lumbar spinal cord neuron of a symptomatic Slc25a4 p.A114P,A123D/+ mouse and wild-type littermate. This neuron shows loss of Nissl substance and blurring of nuclear boundaries, process known as ‘chromatolysis’, which indicates neuron degeneration. (E) Indirect immunofluorescence for the astrocyte marker glial fibrillary acidic protein (GFAP) indicating spinal cord gliosis in a symptomatic Slc25a4 p.A114P,A123D/+ mouse. G, gray matter; W, white matter. (F) Immunoblot analysis of lumbar spinal cord lysate confirmed increase in GFAP in symptomatic Slc25a4 p.A114P,A123D/+ mice. (G) Quantitation from (F) showing significant increase in GFAP in the spinal cord of a symptomatic Slc25a4 p.A114P,A123D/+ mouse indicating neuroinflammation. p-Value was calculated from Student’s t test. (H) Transmission electron microscopy of a ventral horn neuron of a symptomatic Slc25a4 p.A114P,A123D/+ mouse and wild-type littermate control.
Figure 7.
Figure 7.. Ant1A114P,A123D (encoded by Slc25a4 p.A114P,A123D) causes a dominant mitochondrial myopathy in mice.
(A) Respirometry of isolated skeletal muscle mitochondria with complex I stimulated by glutamate (glu) and malate (mal). State 3, maximal respiratory rate after addition of ADP; state 4, oligomycin (oligo)-inhibited respiratory rate; respiratory control ratio = state 3/state 4. N=6 mice/genotype at 9 months of age; n=4 mice per genotype at 24 months of age. Three measurements were taken per mouse. p-Values were derived from repeated measures ANOVA with measurement order as the within-subjects variable. Data from two age groups were analyzed independently. FCCP, trifluoromethoxy carbonylcyanide phenylhydrazone. (B) Respirometry of isolated skeletal muscle mitochondria with complex II stimulated by succinate and complex I inhibited by rotenone. N=2 mice/genotype at 9 months of age, 4 measurements/mouse; n=4 mice/genotype at 24 months of age, 3 measurements/mouse. Data analyzed as in (A). (C) Soleus muscles stained with hematoxylin and eosin (H&E) showing smaller myofibers in 30-month-old Slc25a4 p.A114P,A123D/+ mice. (D) Feret’s diameter analysis of H&E stained soleus in (C) reveals atrophy in Slc25a4 p.A114P,A123D/+ mice. At least 340 myofibers were measured per soleus. Myofiber diameters were binned into 5 μm ranges and plotted as % of total. N=3 mice/genotype. Data analyzed by two-way ANOVA with Sidak’s multiple comparisons test. (E) Succinate dehydrogenase (SDH) histochemical activity staining of the soleus showing abnormal fibers that stain for SDH peripherally but are pale internally (arrows). (F) Histochemical cytochrome c oxidase (COX) and SDH sequential staining of the soleus shows abnormal fibers that stain for COX peripherally, but do not stain for COX or SDH internally. (G) Quantitation of abnormal COX fibers shown in (F). p-Value was calculated from Student’s t test. (H) Forelimb grip strength is reduced in 30-month-old Slc25a4 p.A114P,A123D/+ mice. p-Value from Student’s t test. (I) Maximal forelimb grip strength is reduced in 30-month-old Slc25a4 p.A114P,A123D/+ mice. p-Value from Student’s t test. Data represented as mean ± SEM.
Figure 8.
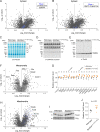
Figure 8.. Ant1A114P,A123D clogs protein import in vivo.
(A) Immunoblot analysis of tissue lysate showing low Ant1A114P,A123D protein levels in heterozygous and homozygous mice. (B) Immunoblot analysis of isolated muscle mitochondria demonstrating low Ant1A114P,A123D protein levels. (C) Quantitation of Ant1 levels in isolated muscle mitochondria from three mice per genotype, as determined by immunoblotting. Values were normalized to total protein stain and shown as relative to wild-type. (D) Ant1A114P,A123D is more sensitive to proteinase K (PK) than wild-type Ant1 in intact mitochondria. Immunoblot analysis after PK protection assay of isolated muscle mitochondria in isotonic buffer. Ant1A114P,A123D was detected using SuperSignal West Femto Maximum Sensitivity Substrate (top right panel). (E–H) Quantitation from protease protection assay, as shown in (D). n=3 mice per genotype. p-Values were calculated with a two-way ANOVA, showing significant main effect of genotype. Data represented as mean ± SEM. (I) Schematic of tandem mass tagged (TMT) quantitative proteomic analysis. (J) Volcano plot comparing the cytosolic proteome of Slc25a4 p.A114P,A123D/+ vs wild-type skeletal muscle, with mitochondrial proteins highlighted in blue.
Figure 8—figure supplement 1.
Figure 8—figure supplement 1.. Impact of Ant1A114P,A123D expression on mitochondrial and cytosolic proteostasis.
(A) Volcano plot depicting quantitative proteomics of the cytosolic fraction of skeletal muscle from aged Slc25a4 p.A114P,A123D/+ vs wild-type mice, as in Figure 8J. Blue dots indicate the protein in pfam00227: ‘Proteasome subunit’. (B) Volcano plot as in (A), but blue dots indicate the protein is in pfam00012: ‘HSP70 protein’. (C) Blue native polyacrylamide gel electrophoresis (BN-PAGE) analysis of isolated skeletal muscle mitochondria (n=4 biological replicates per genotype). SC, supercomplex; I-V, respiratory complexes I-V. (D–E) Western blot coupled to BN-PAGE (as in C) using a cocktail of α-OXPHOS antibodies and α-Tim23. (F) Volcano plot depicting tandem mass tagged (TMT)-labeling quantitative proteomics of the mitochondrial fraction of skeletal muscle from aged Slc25a4 p. A114P,A123D/+ vs wild-type mice, showing minimal changes in the steady-state levels of most mitochondrial proteins. (G) Manually curated targeted analysis of mitochondrial proteases and chaperones from proteomic data shown in (F). (H) Volcano plot as in (F), but blue dots indicate the protein is in GO0045039: ‘Protein import into mitochondrial inner membrane’. (I) Immunoblot analysis of skeletal muscle mitochondria (n=6 biological replicates per genotype) probing for Tim22. Notably, these are independent biological replicates from the proteomics dataset. (J) Quantitation from (I). Tim22 levels were normalized to total protein stain and then to the average wild-type level. Data represented as mean ± SEM.
Figure 8—figure supplement 2.
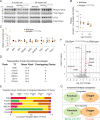
Figure 8—figure supplement 2.. A unique transcriptional response induced by Ant1A114P,A123D in mouse muscle.
(A) Western blot analysis of skeletal muscle lysate probing for eIF2α and phosphorylated form of eIF2αat serine 51. Each lane is an independent biological replicate. (B) Quantitation from (A). Phospho and non-phospho eIF2α levels were first normalized to total protein for loading control, then phospho/non-phospho ratio taken, then all samples normalized to average ratio for 9-month-old wild-type. (C) Targeted analysis mouse skeletal muscle RNAseq (9 months of age) showing minimal changes in genes typically upregulated by the integrated stress response (ISR). Data represented as mean ± SEM. (D) Transcription factor enrichment analysis (TFEA) of significantly upregulated genes (q<0.05) in Slc25a4 p.A114P,A123D/+mice. TF, transcription factor; mean rank, the average rank of the TF among the various libraries seen in (E); overlapping genes are those that are assigned to that TF in each of the libraries. (E) Weighted contribution to Integrated MeanRank TF Ranks shown in (D). (F) Volcano plot showing significantly changed genes (q<0.05) from skeletal muscle RNAseq at 9 months of age. (G) Enrichment analysis comparison between Slc25a4 p.A114P,A123D/+ (‘clogger’) and Slc25a4 -/- (knockout) mice. See Materials and methods for details.
Author response image 1.
Author response image 1.. Mutant ANT1 does not drastically affect the assembly state of TIM22 complex, the TOM complex, or respiratory Complex I in HeLa cells.
(A-C) BN-PAGE followed by immunoblot analysis of isolated mitochondria from transfected HeLa cells. Protein ladders deduced from Coommassie-stained gel shown on the left. B and C are depicting the same membrane with sequential blotting. Regarding methods, mitochondrial isolation, BN-PAGE, and subsequent western blotting were performed 24 hours after transfection as previously described (Timon-Gomez et al., 2020) solubilizing the complexes with a 1:2 protein:digitonin ratio.

Update of

  • doi: 10.1101/2022.09.20.508789

References

    1. Andreson BL, Gupta A, Georgieva BP, Rothstein R. The ribonucleotide reductase inhibitor, Sml1, is sequentially phosphorylated, ubiquitylated and degraded in response to DNA damage. Nucleic Acids Research. 2010;38:6490–6501. doi: 10.1093/nar/gkq552. - DOI - PMC - PubMed
    1. Araiso Y, Tsutsumi A, Qiu J, Imai K, Shiota T, Song J, Lindau C, Wenz L-S, Sakaue H, Yunoki K, Kawano S, Suzuki J, Wischnewski M, Schütze C, Ariyama H, Ando T, Becker T, Lithgow T, Wiedemann N, Pfanner N, Kikkawa M, Endo T. Structure of the mitochondrial import gate reveals distinct preprotein paths. Nature. 2019;575:395–401. doi: 10.1038/s41586-019-1680-7. - DOI - PubMed
    1. Backes S, Bykov YS, Flohr T, Räschle M, Zhou J, Lenhard S, Krämer L, Mühlhaus T, Bibi C, Jann C, Smith JD, Steinmetz LM, Rapaport D, Storchová Z, Schuldiner M, Boos F, Herrmann JM. The chaperone-binding activity of the mitochondrial surface receptor Tom70 protects the cytosol against mitoprotein-induced stress. Cell Reports. 2021;35:108936. doi: 10.1016/j.celrep.2021.108936. - DOI - PMC - PubMed
    1. Becker T, Horvath SE, Böttinger L, Gebert N, Daum G, Pfanner N. Role of phosphatidylethanolamine in the biogenesis of mitochondrial outer membrane proteins. The Journal of Biological Chemistry. 2013;288:16451–16459. doi: 10.1074/jbc.M112.442392. - DOI - PMC - PubMed
    1. Bhangoo MK, Tzankov S, Fan ACY, Dejgaard K, Thomas DY, Young JC. Multiple 40-kDa heat-shock protein chaperones function in tom70-dependent mitochondrial import. Molecular Biology of the Cell. 2007;18:3414–3428. doi: 10.1091/mbc.e07-01-0088. - DOI - PMC - PubMed

Publication types

MeSH terms

Substances

Associated data