. 2023 Jul 20;32(15):2422-2440.
doi: 10.1093/hmg/ddad062.

Activation of the cGAS-STING innate immune response in cells with deficient mitochondrial topoisomerase TOP1MT

Affiliations

Activation of the cGAS-STING innate immune response in cells with deficient mitochondrial topoisomerase TOP1MT

Iman Al Khatib et al. Hum Mol Genet. .

Abstract

The recognition that cytosolic mitochondrial DNA (mtDNA) activates cyclic GMP-AMP synthase-stimulator of interferon genes (cGAS-STING) innate immune signaling has unlocked novel disease mechanisms. Here, an uncharacterized variant predicted to affect TOP1MT function, P193L, was discovered in a family with multiple early onset autoimmune diseases, including Systemic Lupus Erythematosus (SLE). Although there was no previous genetic association between TOP1MT and autoimmune disease, the role of TOP1MT as a regulator of mtDNA led us to investigate whether TOP1MT could mediate the release of mtDNA to the cytosol, where it could then activate the cGAS-STING innate immune pathway known to be activated in SLE and other autoimmune diseases. Through analysis of cells with reduced TOP1MT expression, we show that loss of TOP1MT results in release of mtDNA to the cytosol, which activates the cGAS-STING pathway. We also characterized the P193L variant for its ability to rescue several TOP1MT functions when expressed in TOP1MT knockout cells. We show that the P193L variant is not fully functional, as its re-expression at high levels was unable to rescue mitochondrial respiration deficits, and only showed partial rescue for other functions, including repletion of mtDNA replication following depletion, nucleoid size, steady state mtDNA transcripts levels and mitochondrial morphology. Additionally, expression of P193L at endogenous levels was unable to rescue mtDNA release-mediated cGAS-STING signaling. Overall, we report a link between TOP1MT and mtDNA release leading to cGAS-STING activation. Moreover, we show that the P193L variant has partial loss of function that may contribute to autoimmune disease susceptibility via cGAS-STING mediated activation of the innate immune system.


Figures

Figure 1
Figure 1
Family with the P193L TOP1MT variant and protein structure. (A) Pedigree of the proband’s nuclear family indicating the P193L genotype; the sequences show the nucleotide identity at position C578T where a missense Pro193Leu TOP1MT alteration was found. An extended family pedigree can be found in Supplementary Material, Figure S1. (B) Amino acid alignments of TOP1MT proteins from a variety of vertebrate species generated using COBALT shows the conservation of the amino-acid variant identified in the affected family. (C) Structural modeling of the TOP1MT protein bound to double-stranded DNA. Residues in the nucleic acid binding barrel are shown in lime, with the modeled P193L variant shown in red.
Figure 2
Figure 2
Elevated cytosolic mtDNA release and cGAS-STING pathway activation in TOP1MT KO cells. (A) Cytosolic mtDNA was quantitated via qPCR using the indicated primer sets and was found to be elevated in TOP1MT KO cells compared with WT cells. Normalization was done relative to the corresponding amplicons in total DNA. (B) Confocal images of mtDNA FISH (D-loop probe, green), followed by immunofluorescence against cGAS (blue) and HSP60 (magenta). Scale bar = 10 um. (C) Quantification of the number of cells with non-mitochondrial nucleoids (N = 105 for HCT116 WT, N = 102 for HCT116 KO; pooled from three replicate experiments). (D) Quantification of number of cells exhibiting co-localization of non-mitochondrial nucleoids with cGAS, as in (b). (E) Real-Time Quantitative Reverse Transcription PCR (qRT-PCR) analysis of STING, type I and type II interferons expression in TOP1MT KO cells compared with WT cells. Inhibition of cGAS by 5 μg/ml RU.521 for 24 h lowers type I interferon expressions in TOP1MT-KO cells for both IFN- ⍺ (F) and IFN-β (G), as measured by qRT-PCR. (H) Quantification of type I interferon levels by qRT-PCR in TOP1MT KO cells at the indicated times following 24 h treatment with 5 μg/ml RU.521 and recovery in fresh media. All statistical analysis were done using unpaired student t-test and P-values * < 0.05, ** < 0.01, *** < 0.001 and **** < 0.0001. ‘ns’ signifies no significant differences between indicated groups. Error bars represent standard error of mean.
Figure 3
Figure 3
cGAS-STING pathway induction upon TOP1MT ablation in human and mouse fibroblasts. (A, B) siRNA knockdown of TOP1MT causes strong induction of ISGs, as measured by qRT-PCR, in telomerase immortalized human fibroblasts at both 20% (a) and 3% oxygen (b). (C) ISG expression measured by qRT-PCR is elevated in WT MEFs upon Top1mt knockdown, but this elevation is abrogated in cGAS knockout MEFs. All statistical analysis were done using unpaired student t-test and P-values * < 0.05, ** < 0.01, *** < 0.001 and **** < 0.0001. ‘ns’ signifies no significant differences between indicated groups. Error bars represent standard error of mean.
Figure 4
Figure 4
Generation of stable line expressing the variant form of TOP1MT. (A) PCR amplification targeting the coding region of the viral-encoded TOP1MT open reading frame, spanning patient variant, confirms amplicons are present only in HCT116 KO cell lines stably re-expressing TOP1MT, namely the Rescue and P193L lines. (B) Chromatograms from Sanger sequencing of the amplicons produced from (a). The 578C residues (shaded), confirm the identity of the cell lines. (C) Western blots probed for TOP1MT antibody confirm the TOP1MT expression in stably transduced cell lines. VDAC was probed as a load control. (D) Quantification of western blots from four replicates shows the fold change in protein abundance compared with VDAC control from four different replicates. All statistical analysis were done using unpaired student t-test; where error bars represent standard error of mean and P-values ** < 0.01, **** < 0.0001 and ‘ns’ signifies no significant differences between indicated groups. Error bars represent standard error of mean. (E) Representative confocal images of TOP1MT localization in stable lines where fixed cells were stained for immunofluorescence with anti-TOMM20 (mitochondria, magenta) and anti-TOP1MT (green) primary antibodies. Viral transduction was confirmed by the expression of mCherry (blue). The final column shows the zoom-in of the region indicated by the white dashed box in the merged column. Images confirm the mitochondrial localization of TOP1MT-P193L patient variant. Scale bar represents 10 μm. Uncropped images of the western blot are available in Supplementary Material, Figure S8b.
Figure 5
Figure 5
TOP1MT-KO cells stably expressing P193L alter mitochondrial genome supercoiling. (A) Representative southwestern blot showing increased supercoiled mtDNA in KO ctrl cells and P193L cells. (B) Quantification of the ratio of supercoiled to relaxed mtDNA from southwestern blots as in (a) from four independent experiments, normalized relative to control cells. (C) Representative confocal images of live cells stained with MitoTracker Far Red (mitochondria) and PicoGreen (dsDNA: nuclear and mtDNA), where the final column shows a zoom-in of the region indicated in the white dashed box for the PicoGreen signal. Scalebars represent 10 μm. (D) Violin plots showing quantification of the average mtDNA nucleoid sizes from 25 cells stained as in (c). All statistical analysis were done using unpaired student t-test and P-values **quantification of the average mtDNA nucleoid < 0.01, **** < 0.0001 and ‘ns’ signifies no significant quantification of the average mtDNA nucleoid differences between indicated groups. Error bars quantification of the average mtDNA nucleoid represent standard error of mean.
Figure 6
Figure 6
TOP1MT-KO cells stably expressing P193L affect mitochondrial DNA maintenance. (A) Quantification of mtDNA transcripts from three independent biological replicates in the indicated stable cell lines via qRT-PCR for the indicated genes from the three mtDNA promoters [HSP1 (12S), HSP2 (COX I) and LSP (ND6)]. (B) Relative mtDNA copy number from three independent biological replicates, determined by qPCR relative to 18S, is rescued in P193L cells. (C) Time course of mtDNA copy number changes (via qPCR) of EtBr depletion (3 days, 1 μg/ml) followed by repletion (5 days, no EtBr), shows slower recovery in P193L cells compared with Rescue cells. Experiment was performed with three biological replicates. (D) Representative western blots show reduced levels of the indicated OXPHOS complex proteins in P193L cells. Blots are cropped at the indicated sizes, with full uncropped blots available in Supplementary Material, Figure S8c. (E) Quantification of western blots for OXPHOS proteins as in (d), from three independent experiments, corrected to Actin as a load control. Reduction in OXPHOS proteins encoded by both nuclear (i.e. NDUFB8, SDHB, UQCRC2, ATP5) and mtDNA (i.e. COXII) genomes was observed in P193L cells lines. (F) Oxygen consumption rates (OCR) analyzed in the indicated cell lines using the Seahorse XF24 extracellular flux analyzer. The OCR data were used to calculate basal respiration (G), maximal respiration (H) and ATP production (I). Data presented is from a representative experiment with five technical replicates. All statistical analysis were done using unpaired student t-test and P-values * < 0.05, ** < 0.01, *** < 0.001 and **** < 0.0001. ‘ns’ signifies no significant differences between indicated groups. Error bars represent standard error of mean.
Figure 7
Figure 7
TOP1MT-KO cells stably expressing low levels of P193L do not rescue cytosolic mtDNA levels, quantification of the average mtDNA nucleoid reduced nucleoid sizes, or elevated interferon transcripts. (A) Representative western blots show near endogenous expression of the TOP1MT protein in cells sorted for lower expression of both WT and P193Lquantification of the average mtDNA nucleoid variants. (B) Quantification of western blots of TOP1MT protein as in (C), from three independent quantification of the average mtDNA nucleoid experiments, corrected to Actin as a load control. (c) Representative confocal images of live cells stained with MitoTracker Far Red (mitochondria) and PicoGreen (dsDNA: nuclear and mtDNA) where the final column quantification of the average mtDNA nucleoid shows the zoom-in of the region indicated in the white dashed box for the PicoGreen signal. Scale bars represent 10 μm. (D) Violin plots showing quantification of the average mtDNA nucleoid size from 25 cells stained as in (c). (E) Quantification of cytosolic mtDNA levels from cells as in (a) via qPCR using the indicated primer set. Normalization was done relative to the corresponding amplicons in total DNA from the same cells. (F) qRT-PCR analysis of type I interferon expression from cells as in (a) show elevated type I interferon levels in cells expressing endogenous levels of the P193L variant. All statistical analysis were done using unpaired student t-test and P-values * < 0.05, ** < 0.01, *** < 0.001 and **** < 0.0001. ‘ns’ signifies no significant differences between indicated groups. Error bars represent standard error of mean. Uncropped images of western blots are available in Supplementary Material, Figure S8d.
Figure 8
Figure 8
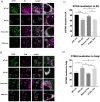
STING relocates from the ER to the Golgi in TOP1MT KO and P193L low cells. Representative confocal images of fixed cells to visualize the co-localization (white) of STING (green) with either the ER or Golgi (magenta). (A) Cells stained with primary antibodies for immunofluorescence with anti-STING (green) and anti-Calnexin (ER, magenta. (B) Cells stained with primary antibodies for immunofluorescence with anti-STING (green) or anti-TGN46 (Golgi, magenta). The final column shows the zoom-in of the region indicated by the white dashed box in the merged column. Scale bar represents 10 μm. Localization of STING to the Golgi, and the absence of STING in the ER, which are indicative of STING activation, were observed in the TOP1MT KO and P193L low lines and confirmed by quantification of the percentage of STING signal co-localizing to the ER (C) or Golgi (D) from at least 10 images as in (a) and (b), respectively. All statistical analysis were done using unpaired student t-test and P-values* < 0.05, ** < 0.01 and **** < 0.0001. ‘ns’ signifies no significant differences between indicated groups. Error bars represent standard error of mean.

References

    1. Wincup, C. and Radziszewska, A. (2021) Abnormal mitochondrial physiology in the pathogenesis of systemic lupus erythematosus. Rheum. Dis. Clin. N. Am., 47, 427–439. - PubMed
    1. Yang, S.K., Zhang, H.R., Shi, S.P., Zhu, Y.Q., Song, N., Dai, Q., Zhang, W., Gui, M. and Zhang, H. (2020) The role of mitochondria in systemic lupus erythematosus: a glimpse of various Pathogenetic mechanisms. Curr. Med. Chem., 27, 3346–3361. - PubMed
    1. Alperin, J.M., Ortiz-Fernández, L. and Sawalha, A.H. (2018) Monogenic lupus: a developing paradigm of disease. Front. Immunol., 9, 2496. - PMC - PubMed
    1. Bursztejn, A.C., Briggs, T.A., del Toro Duany, Y., Anderson, B.H., O'Sullivan, J., Williams, S.G., Bodemer, C., Fraitag, S., Gebhard, F., Leheup, B. et al. (2015) Unusual cutaneous features associated with a heterozygous gain-of-function mutation in IFIH1: overlap between Aicardi-Goutières and singleton-Merten syndromes. Br. J. Dermatol., 173, 1505–1513. - PMC - PubMed
    1. An, J., Briggs, T.A., Dumax-Vorzet, A., Alarcón-Riquelme, M.E., Belot, A., Beresford, M., Bruce, I.N., Carvalho, C., Chaperot, L., Frostegård, J. et al. (2017) Tartrate-resistant acid phosphatase deficiency in the predisposition to systemic lupus erythematosus. Arthritis Rheumatol, 69, 131–142. - PubMed

Publication types