. 2023 Jul 5;83(13):2123-2141.
doi: 10.1158/0008-5472.CAN-22-2712.

β-Catenin-Driven Differentiation Is a Tissue-Specific Epigenetic Vulnerability in Adrenal Cancer

Affiliations

β-Catenin-Driven Differentiation Is a Tissue-Specific Epigenetic Vulnerability in Adrenal Cancer

Dipika R Mohan et al. Cancer Res. .

Abstract

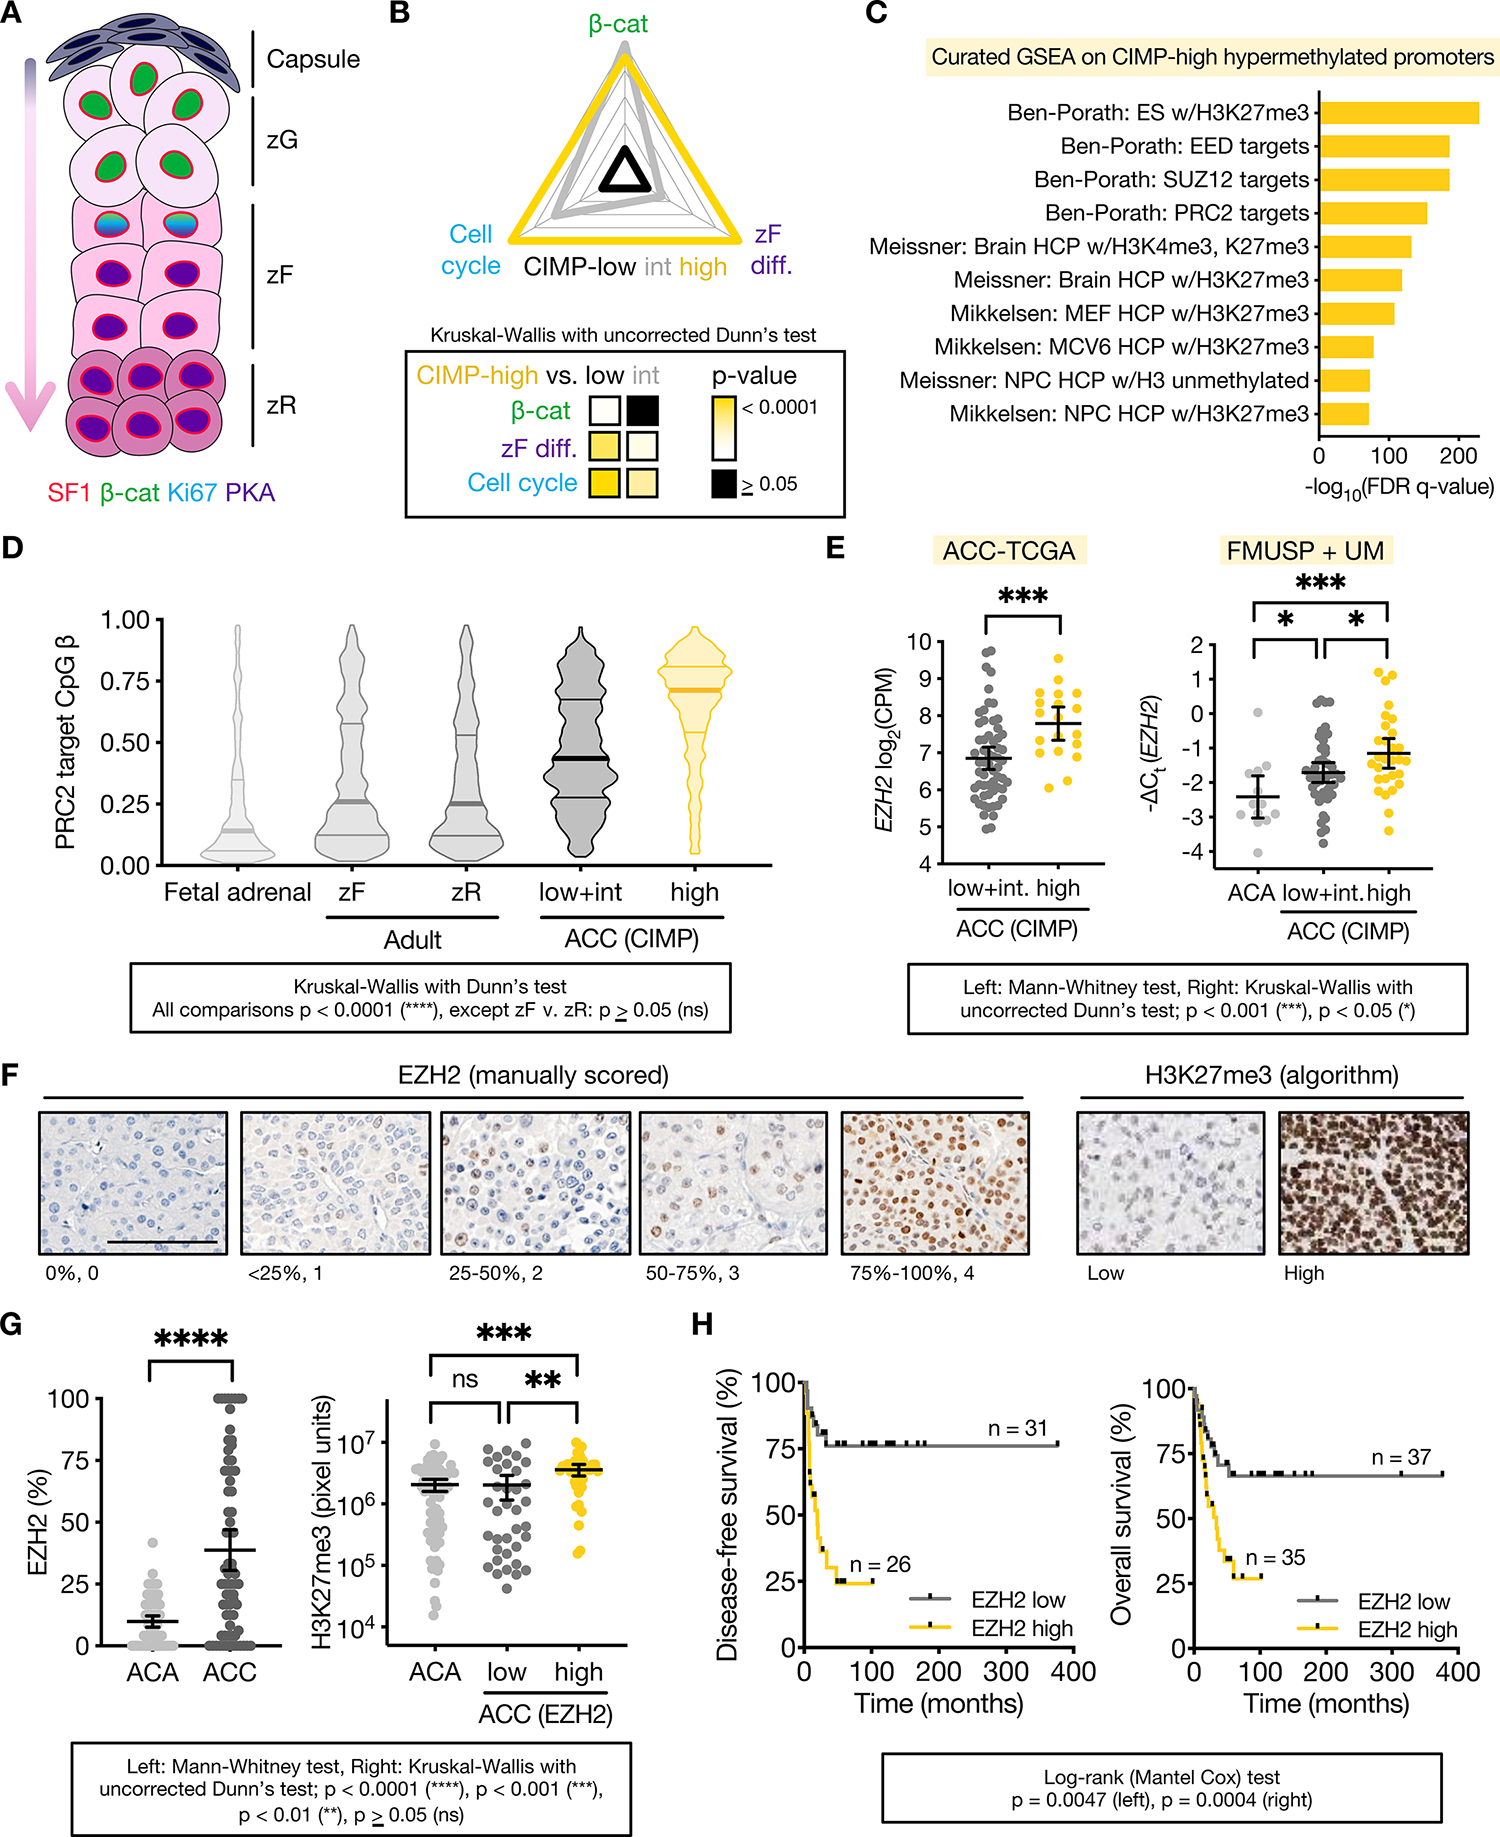
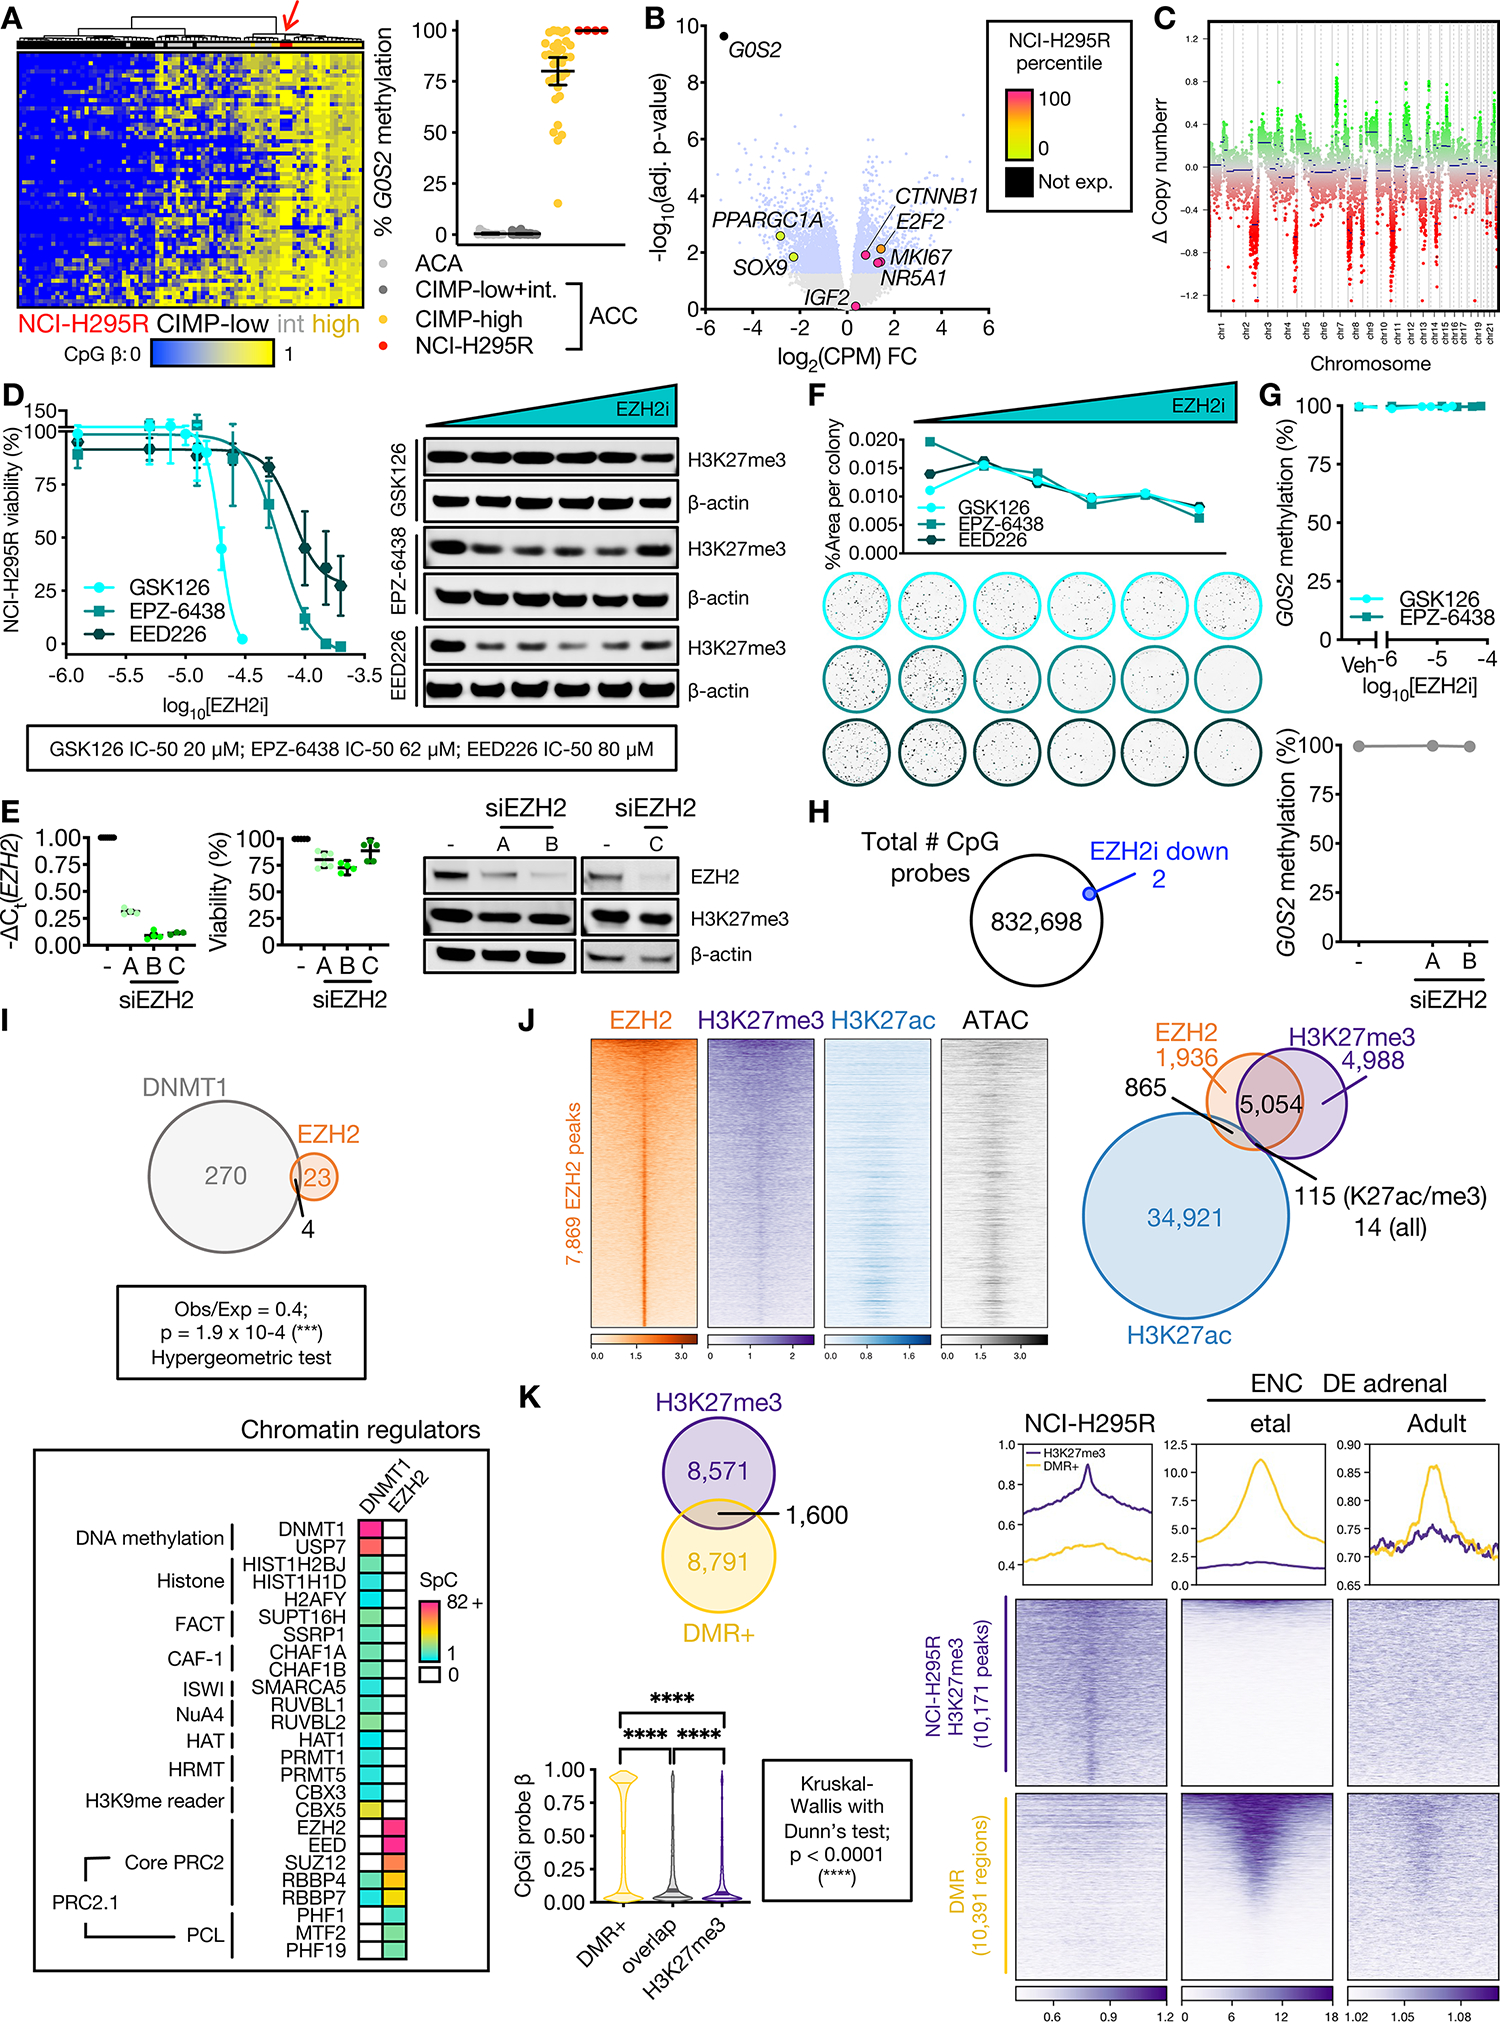
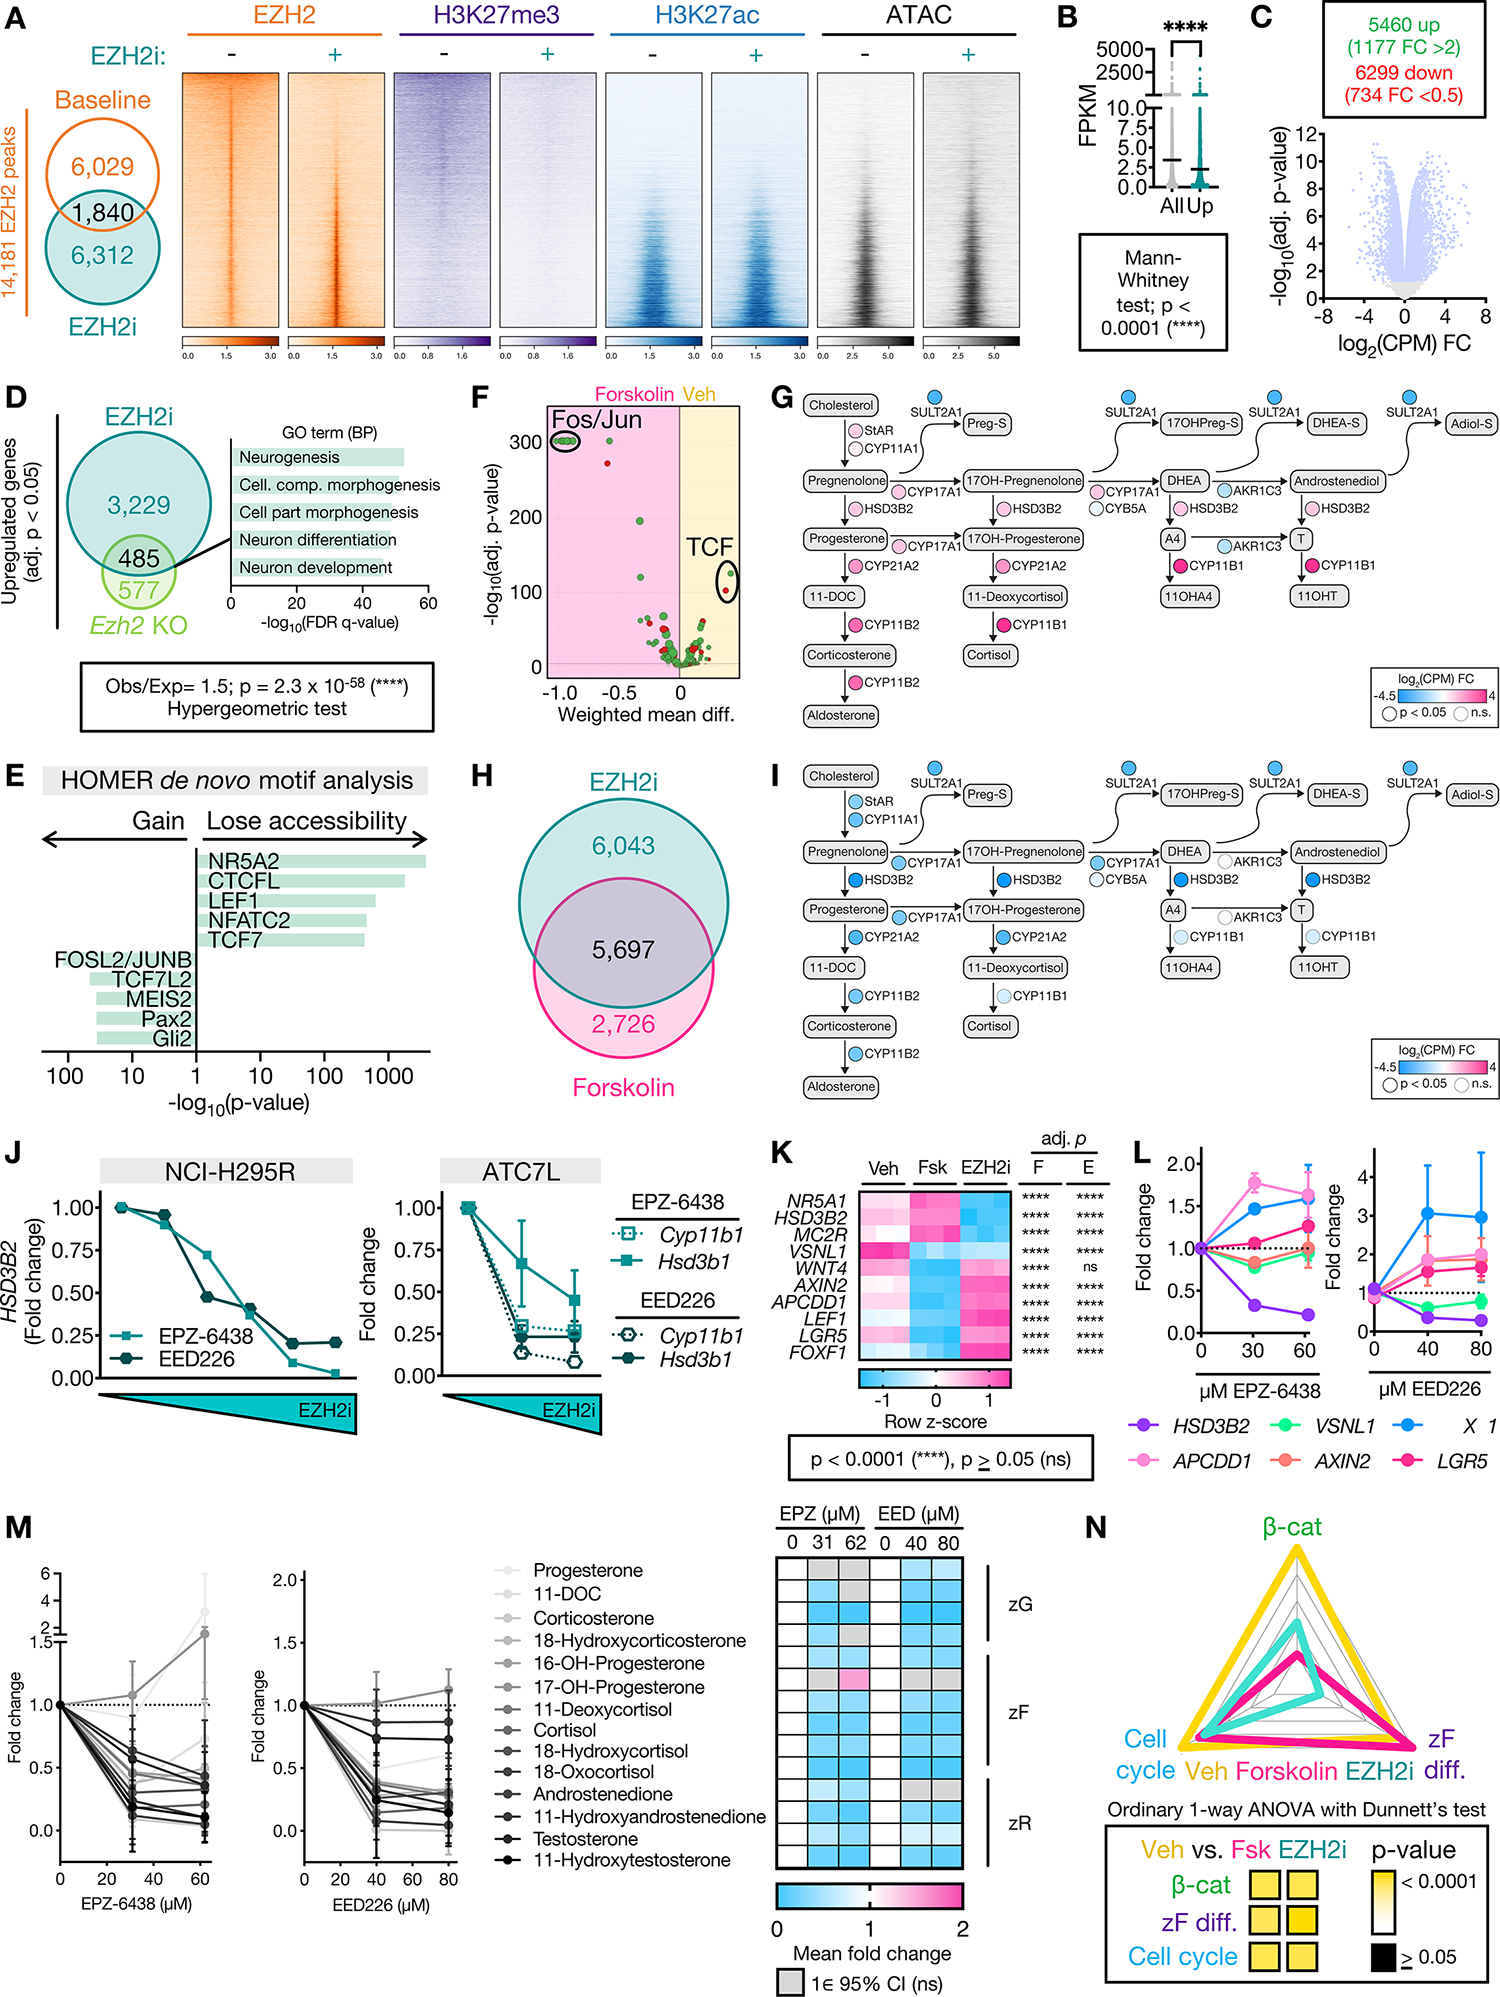
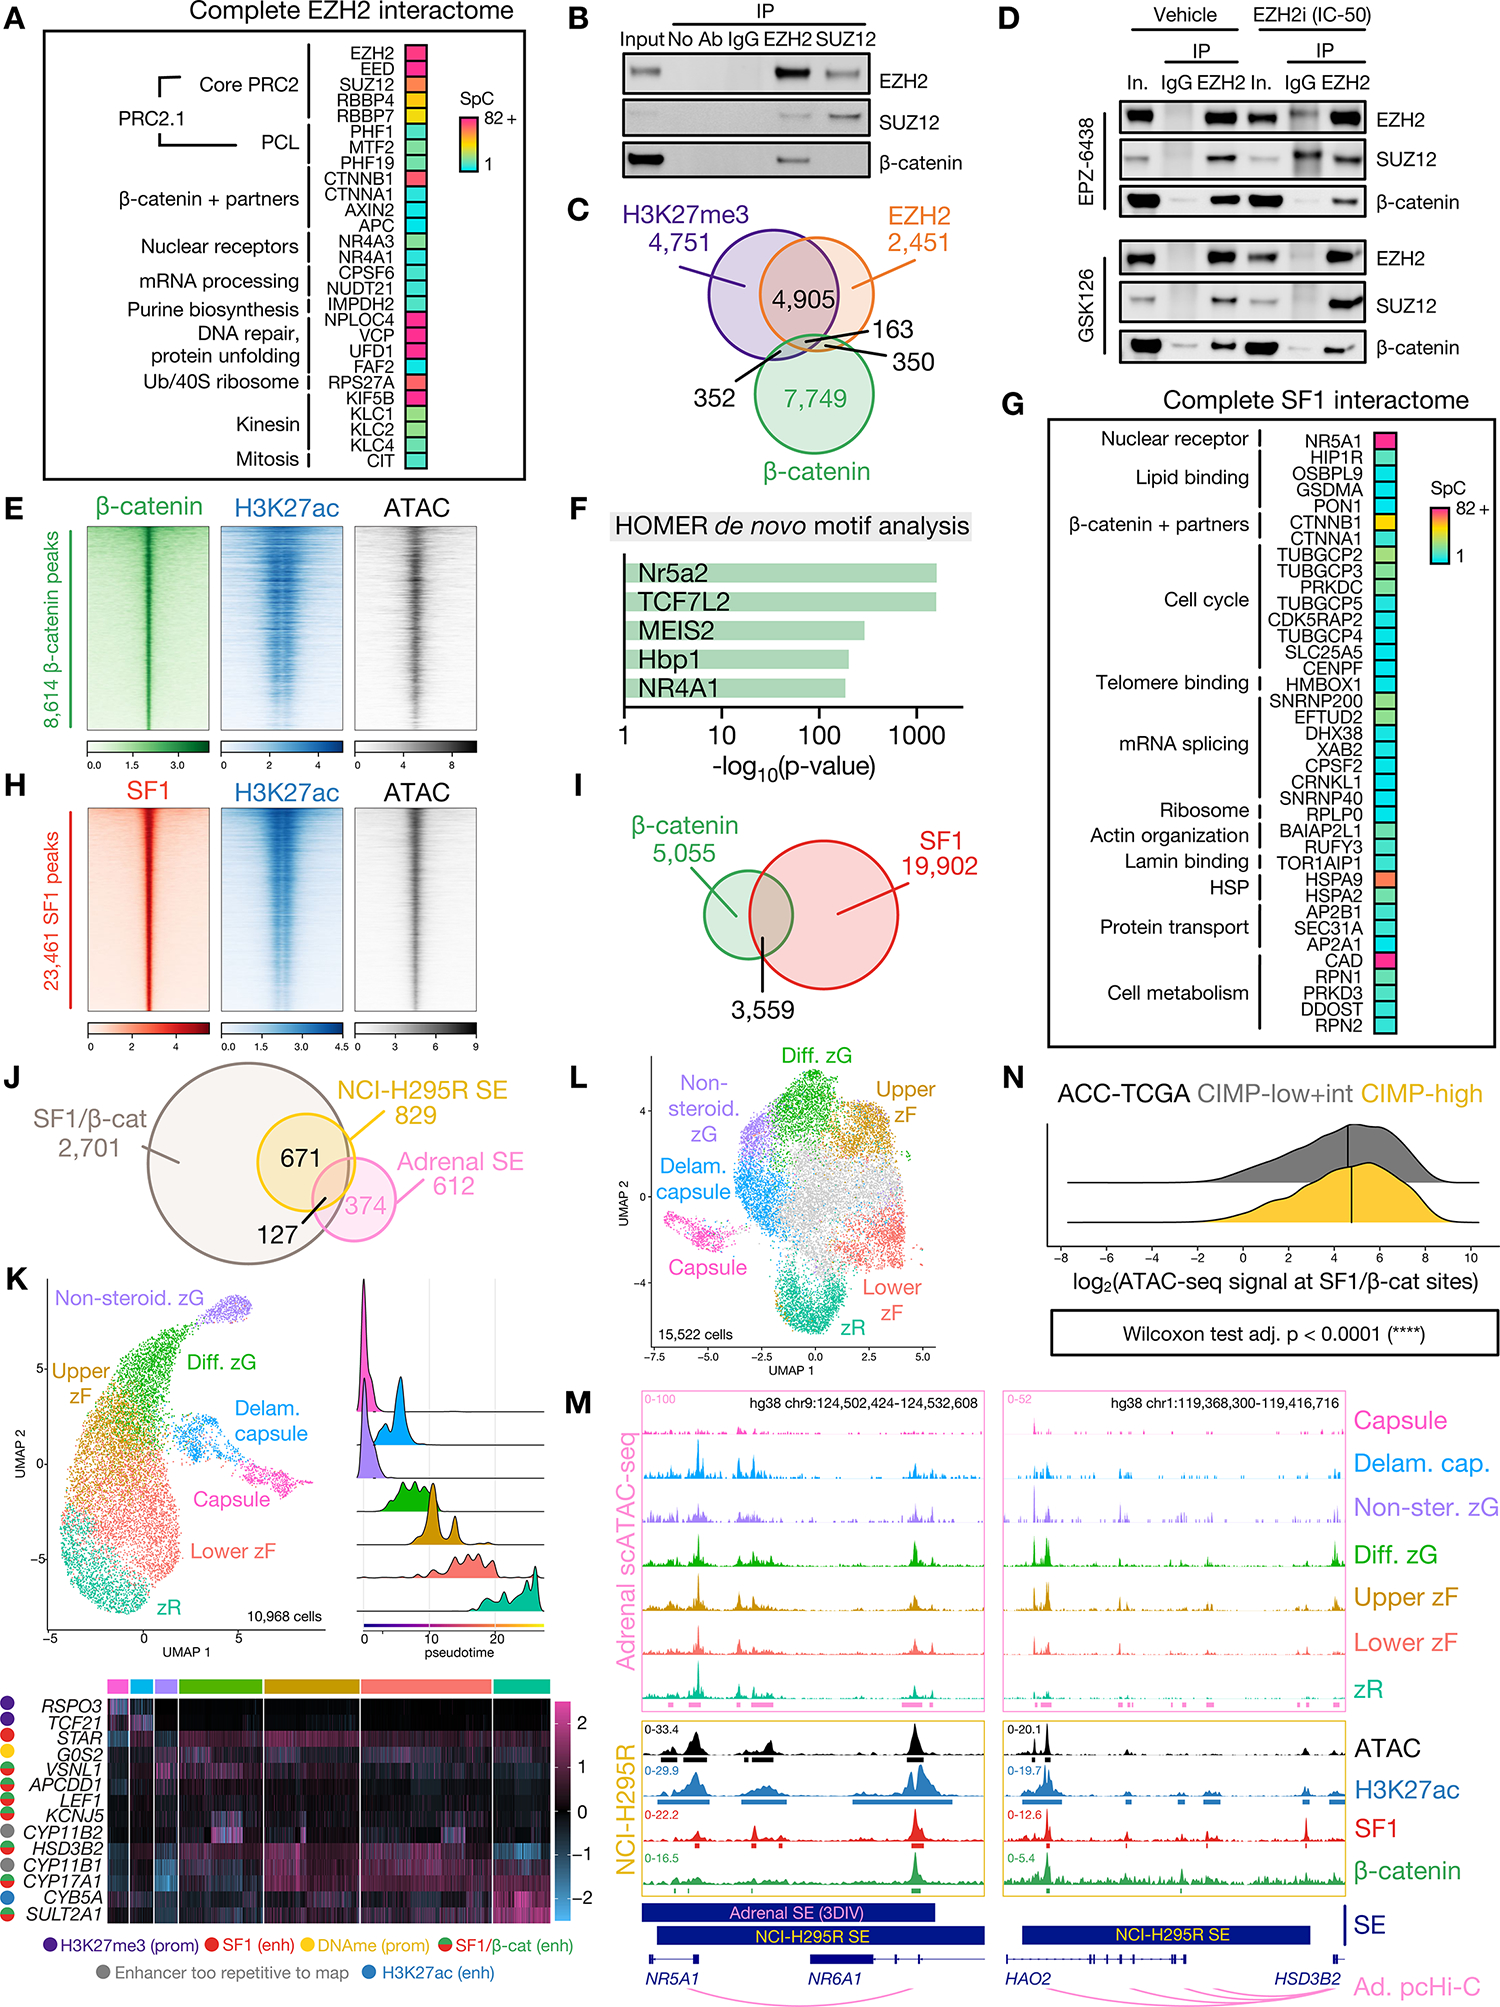
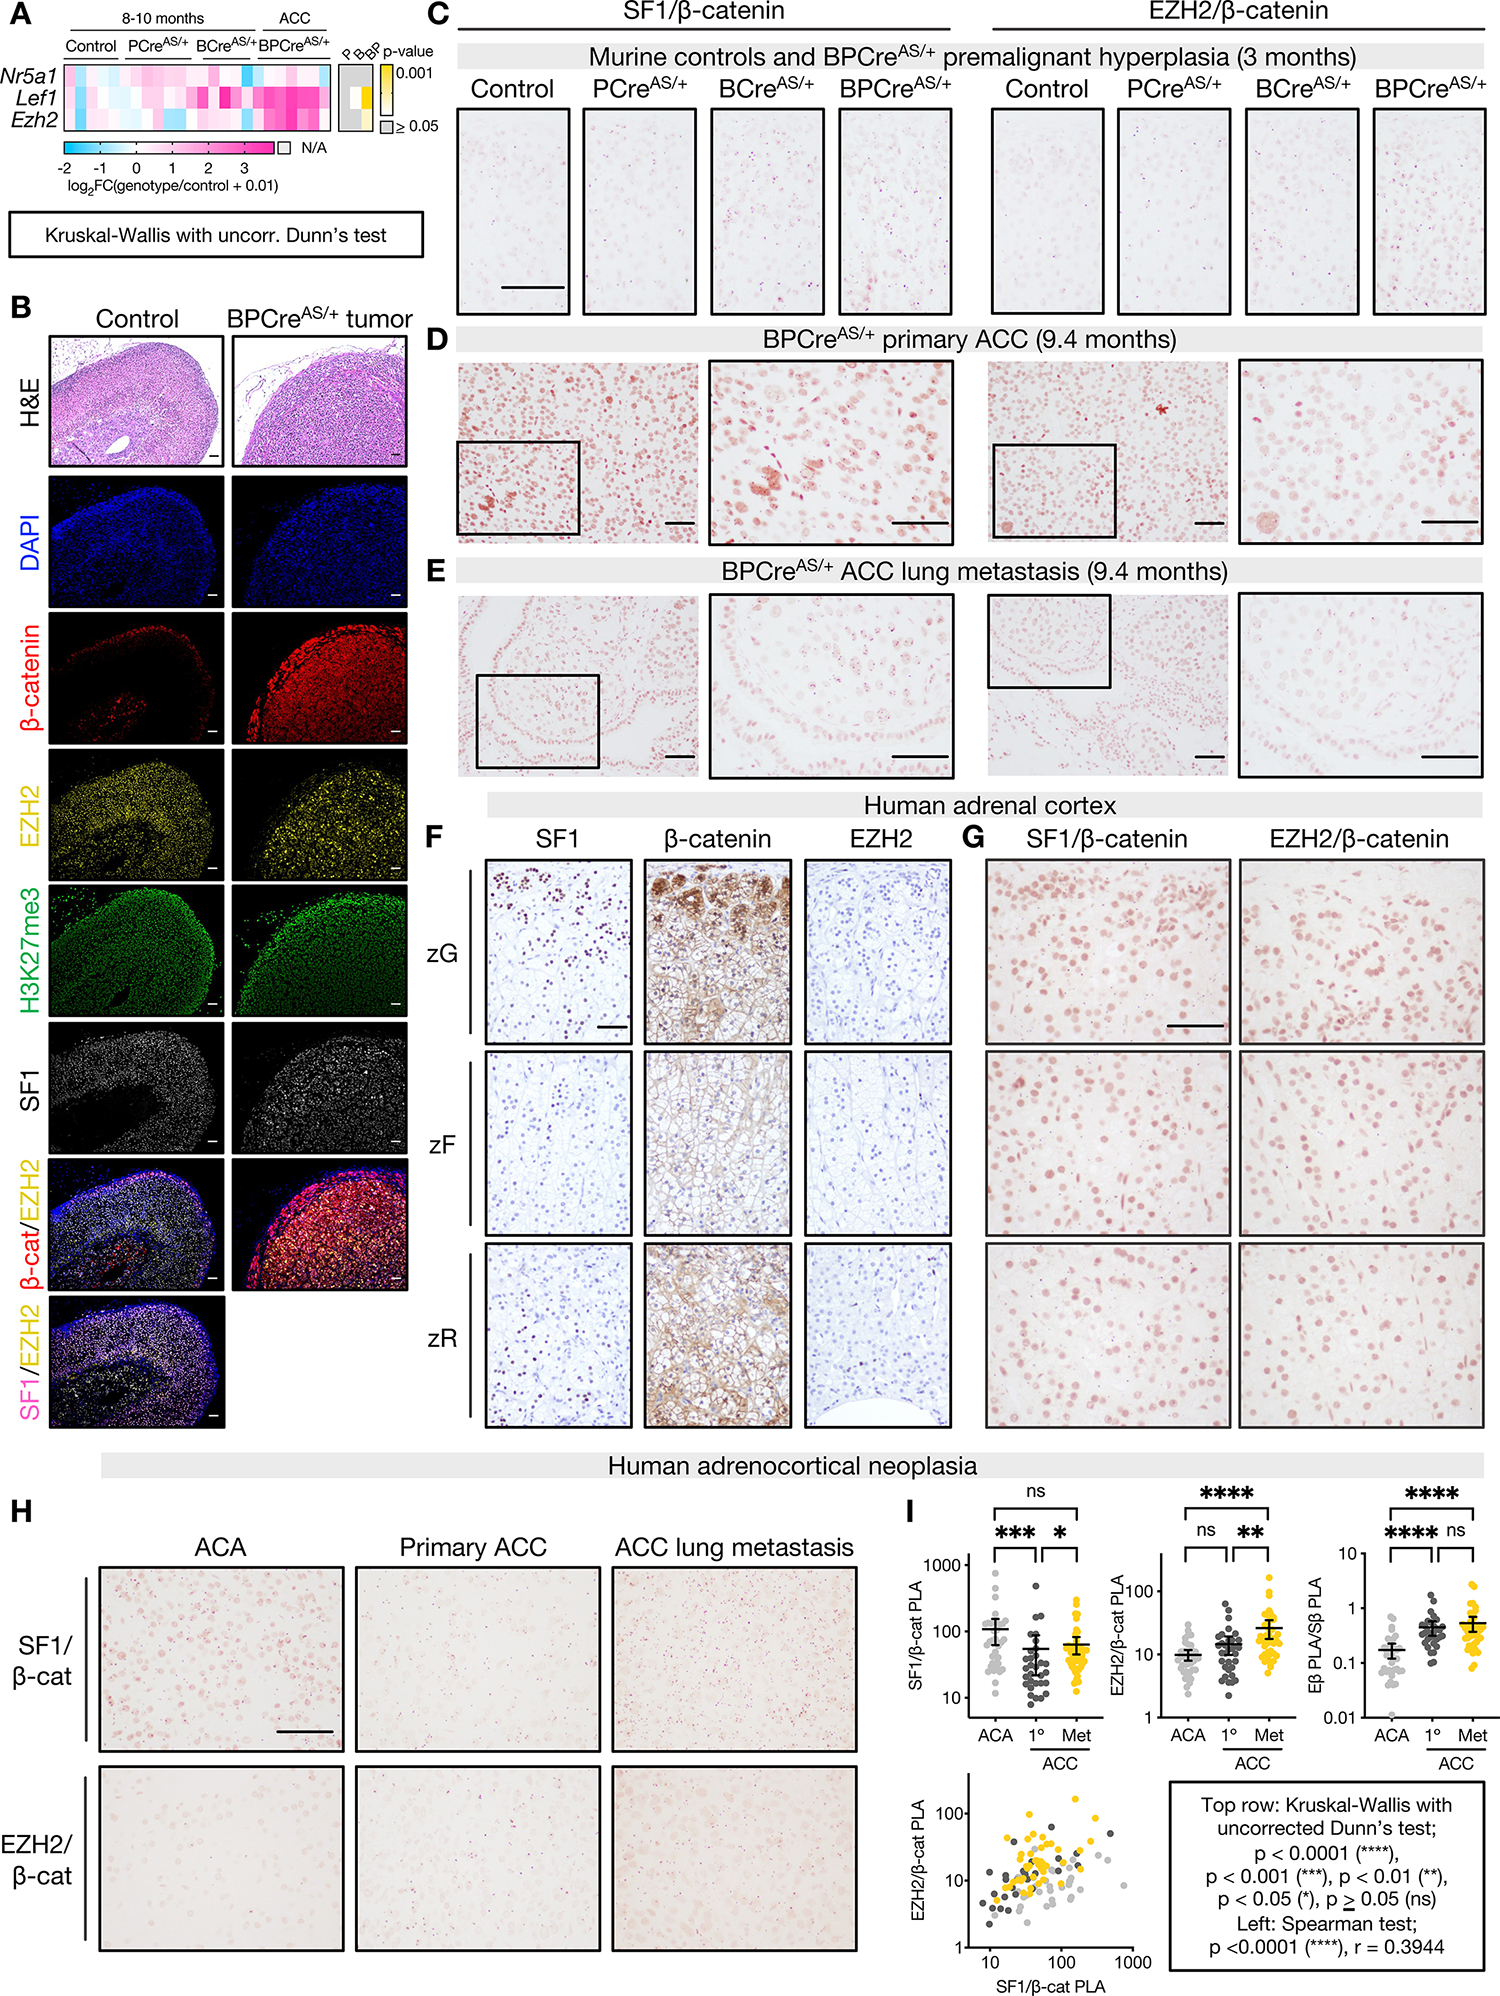
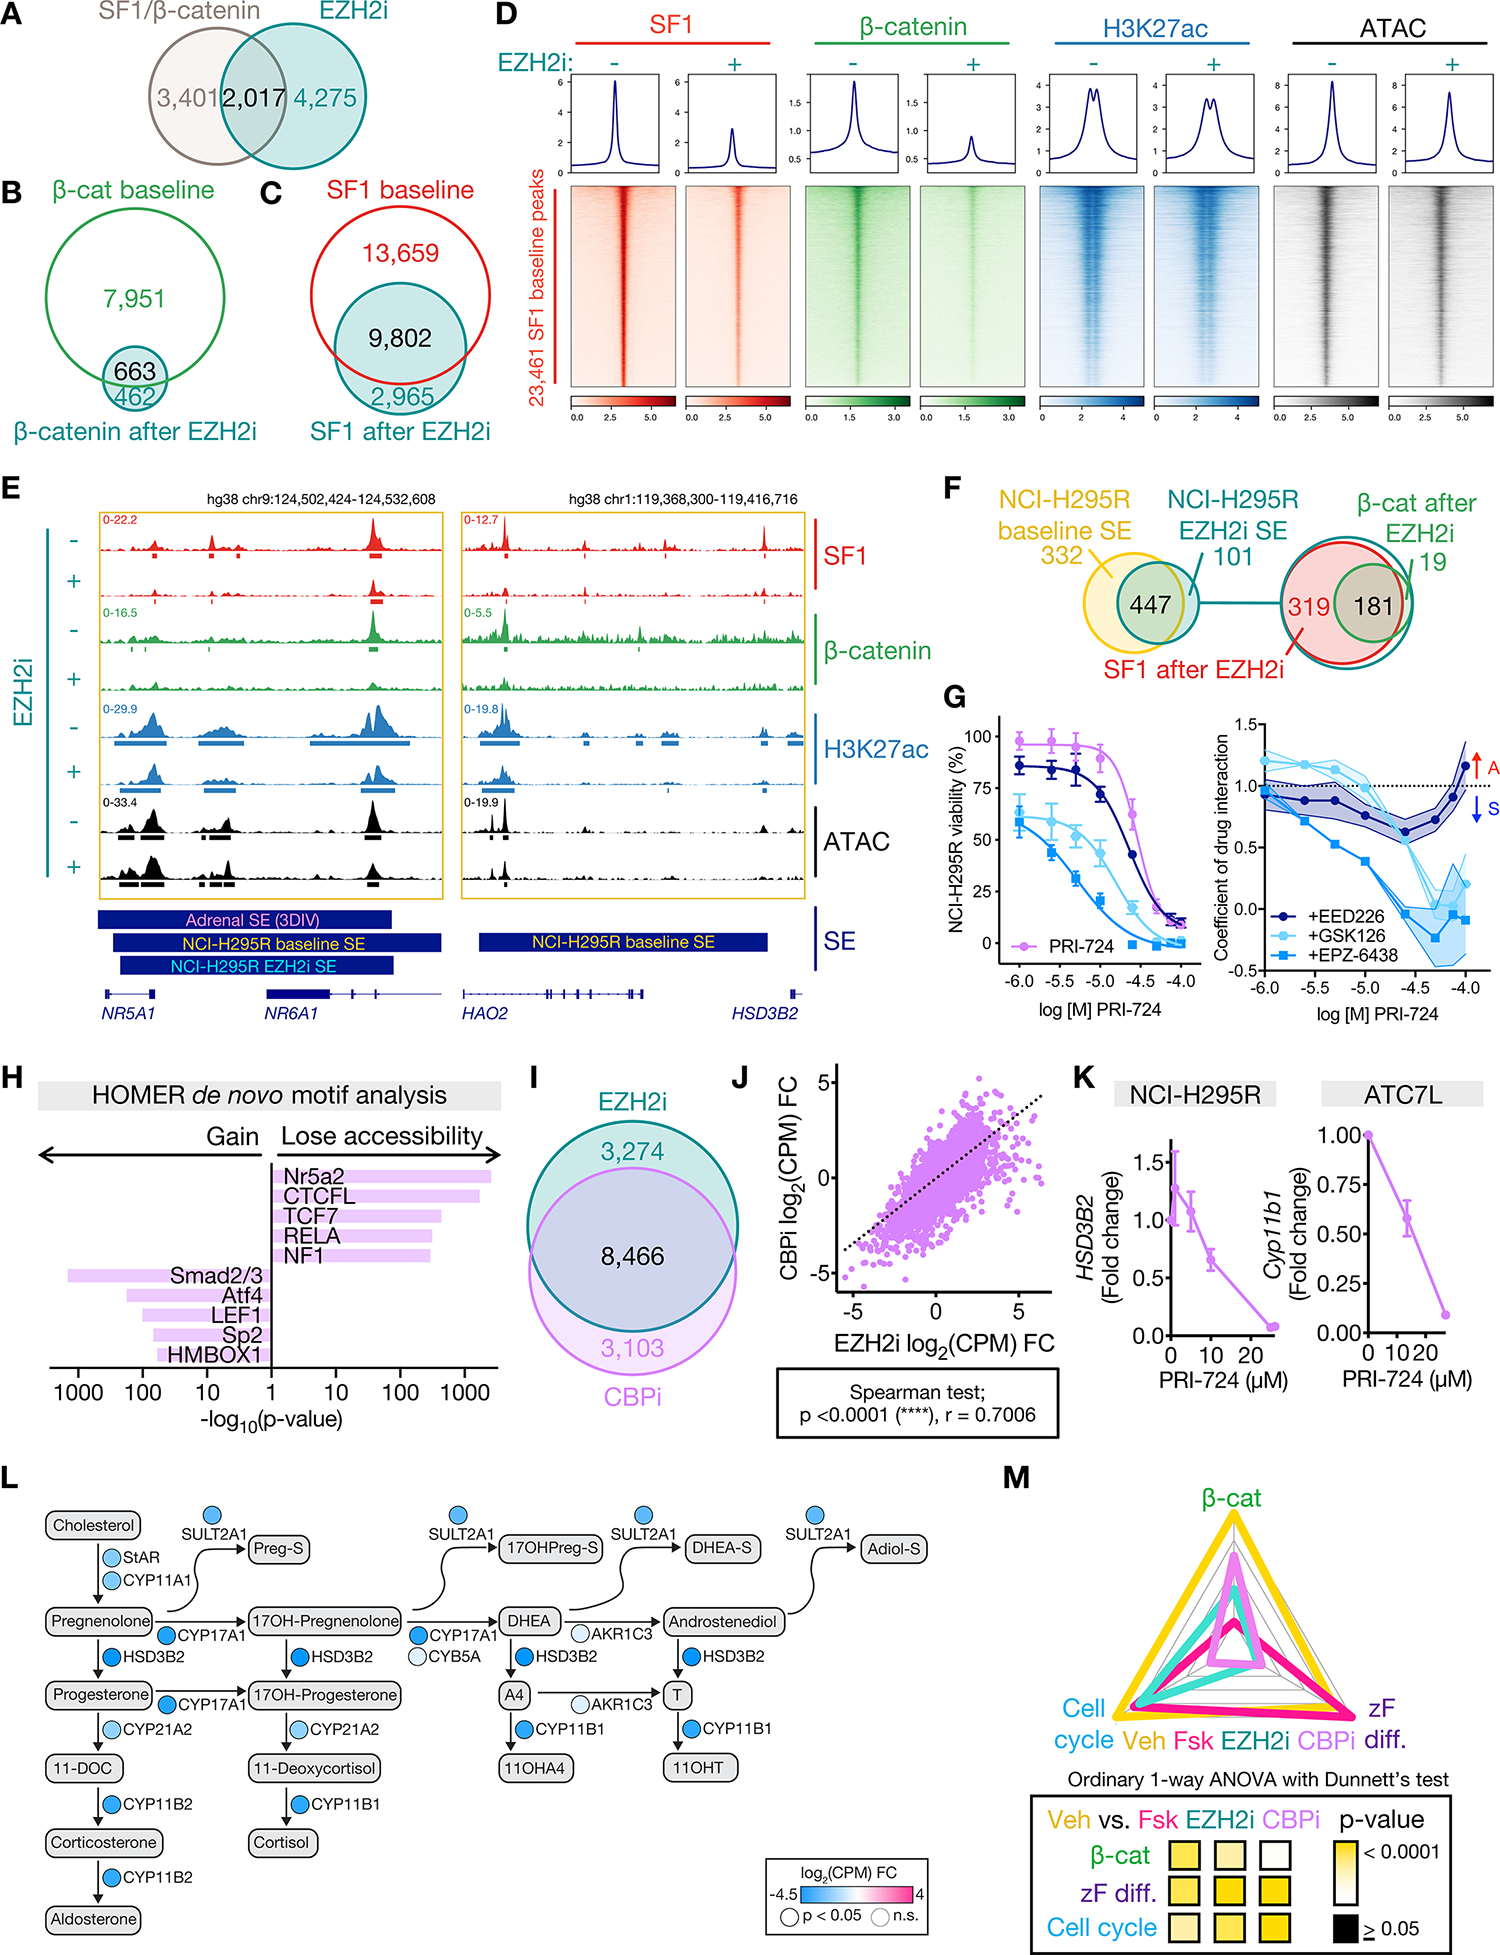
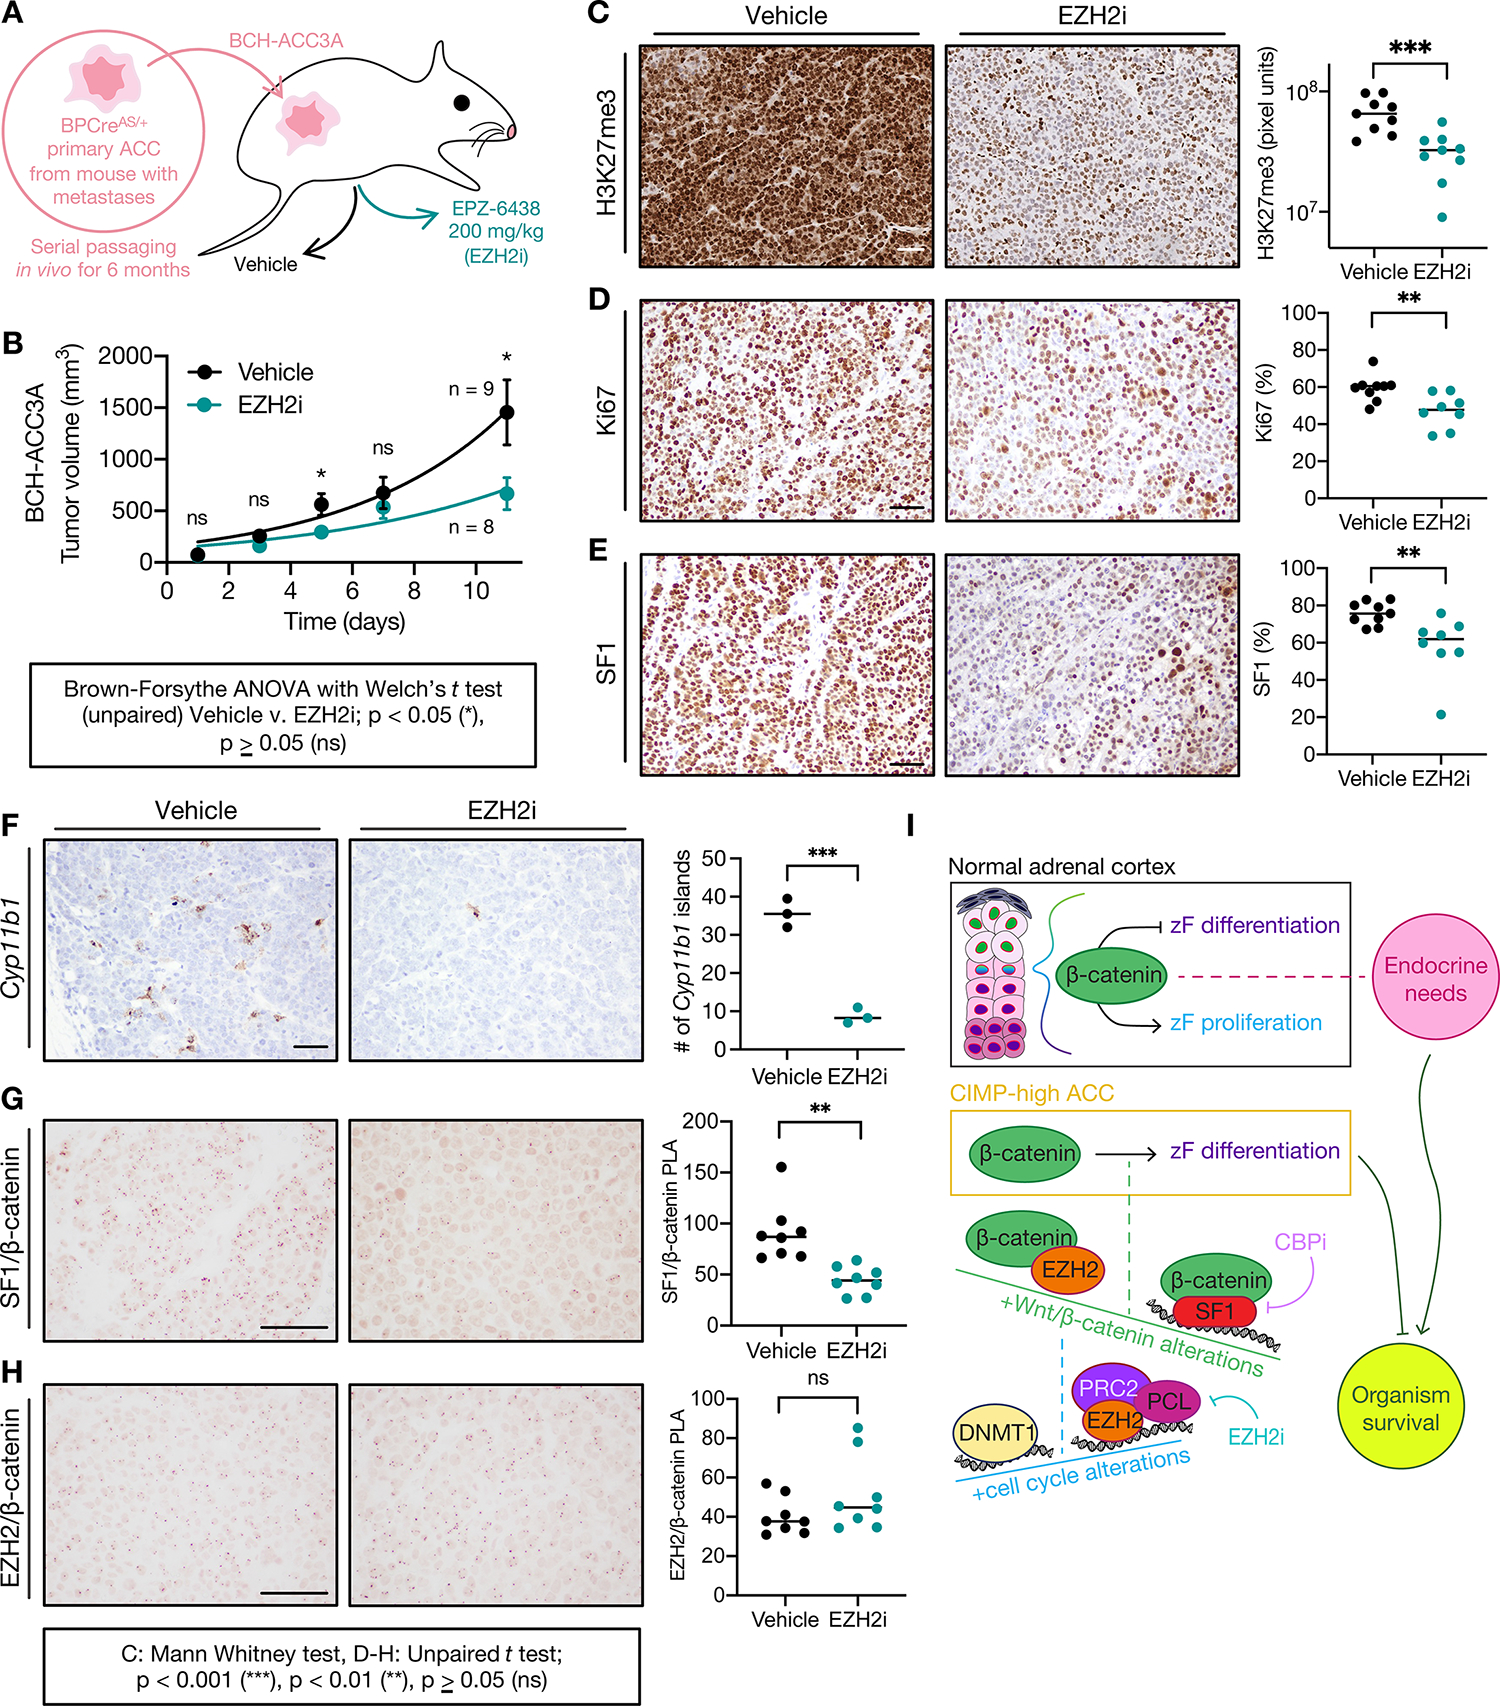
Adrenocortical carcinoma (ACC) is a rare cancer in which tissue-specific differentiation is paradoxically associated with dismal outcomes. The differentiated ACC subtype CIMP-high is prevalent, incurable, and routinely fatal. CIMP-high ACC possess abnormal DNA methylation and frequent β-catenin-activating mutations. Here, we demonstrated that ACC differentiation is maintained by a balance between nuclear, tissue-specific β-catenin-containing complexes, and the epigenome. On chromatin, β-catenin bound master adrenal transcription factor SF1 and hijacked the adrenocortical super-enhancer landscape to maintain differentiation in CIMP-high ACC; off chromatin, β-catenin bound histone methyltransferase EZH2. SF1/β-catenin and EZH2/β-catenin complexes present in normal adrenals persisted through all phases of ACC evolution. Pharmacologic EZH2 inhibition in CIMP-high ACC expelled SF1/β-catenin from chromatin and favored EZH2/β-catenin assembly, erasing differentiation and restraining cancer growth in vitro and in vivo. These studies illustrate how tissue-specific programs shape oncogene selection, surreptitiously encoding targetable therapeutic vulnerabilities.

Significance: Oncogenic β-catenin can use tissue-specific partners to regulate cellular differentiation programs that can be reversed by epigenetic therapies, identifying epigenetic control of differentiation as a viable target for β-catenin-driven cancers.


Conflict of interest statement

CONFLICT OF INTEREST STATEMENT

D.R. Mohan, A.M. Lerario, and G.D. Hammer are inventors on three pending patent applications describing compositions and methods for treating or characterizing cancer. G.D. Hammer reports unrelated personal fees from Radionetics and Orphagen Pharmaceuticals for consultation on projects outside the scope of this work. The remaining authors declare no competing interests.

Figures

Figure 1:
Figure 1:. Differentiated, Wnt-active ACC subtype CIMP-high possesses aberrant PRC2 target hypermethylation with high EZH2 coupled to H3K27me3
A. Corticocapsular unit of adrenocortical homeostasis depicting peripheral mesenchymal cells (capsule) and human cortical populations zona glomerulosa (zG), zona fasciculata (zF), and zona reticularis (zR), that produce mineralocorticoids, glucocorticoids, and androgens, respectively. Differentiation in the cortex is centripetal, and zG, zF, and zR cells are supplied by peripheral capsular and cortical progenitors (arrow). The entire cortex is SF1 positive. ZG cells possess active Wnt/β-catenin signaling and lower zF/zR cells possess active ACTH signaling through protein kinase A (PKA). Wnt/β-catenin signaling fades in the upper zF, and these cells respond to ACTH/PKA with proliferation (Ki67). Mice do not have a zR. B. GSVA was used on ACC-TCGA RNA-seq to calculate the expression score of genes that define zF differentiation or are regulated in a cell-cycle- or Wnt-dependent manner across ACC-TCGA. Score validation detailed in Methods and Supp Fig 1. Radar plot depicts average score for each ACC CIMP class, with values mapped onto an arbitrary scale along each axis. Heatmap below depicts p-value for comparisons. C. 10 most significant gene sets from curated GSEA on genes with promoters targeted for hypermethylation in CIMP-high ACC. D. Violin plot of PRC2 target CpGi methylation measured by Illumina 850k or 450k methylation array in fetal (n=3) or adult adrenal (zF, zR; n=4 each) and ACC from ACC-TCGA (n=79). Lines at median and quartiles. E. EZH2 expression in ACC-TCGA by RNA-seq (n=78), left, and independent cohort by qPCR (n=102, FMUSP+UM classified by CIMP in (8)), right. CPM=counts per million. ACA=adrenocortical adenomas (benign adrenocortical tumors). Line at mean with 95% confidence interval (CI). F-G. Representative images and scoring of tissue microarray (TMA) of human adult ACA (n=74) and primary ACC (n=74). TMA stained for EZH2 and H3K27me3 by immunohistochemistry (IHC). EZH2 quantified on 0–4 scale (%positive nuclei) by 2 independent observers. H3K27me3 quantified by MATLAB (20). EZH2 low=ACC with below median EZH2 expression (≤25% nuclei EZH2+), EZH2 high=ACC with above median EZH2 expression (>25% nuclei EZH2+). EZH2 mRNA/protein are correlated (Spearman r=0.5117, p<0.01, not shown). F, bar=100 μm. G, line at mean with 95% CI. H. Disease-free (after R0/RX resection in patients without metastatic disease at diagnosis) and overall survival (all patients) stratified by ACC EZH2 expression.
Figure 2:
Figure 2:. DNA methylation is propagated independently of PRC2 in CIMP-high ACC
A. Left, heatmap of methylation at probes (rows) that define ACC-TCGA CIMP groups. Columns are ACC-TCGA samples classified by CIMP or baseline NCI-H295R cell line (red arrow, n=3, Illumina 850k array). Unsupervised hierarchical clustering with ward.D2 algorithm, Euclidean distance. Right, targeted assessment of G0S2 methylation in ACA (n=14), ACC stratified by CIMP-status (n=49 non-CIMP-high, n=33 CIMP-high), and baseline NCI-H295R, n=4; line at mean with 95% CI. ACA+ACC data from (8). B. Volcano plot on RNA-seq data from CIMP-high vs. non CIMP-high ACC from ACC-TCGA. Light blue dots correspond to differentially expressed genes (adj. p-value=Benjamini-Hochberg-corrected p-value<0.05). Named genes are color-coded by NCI-H295R gene expression percentile (calculated from baseline RNA-seq). IGF2 is overexpressed in 90% of ACC, not differentially expressed across CIMP classes. C. Total CpG signal across NCI-H295R baseline methylome was summed to predict DNA content, chromosomal segments and copy number, demonstrating “noisy” chromosomal signature characteristic of CIMP-high. In euploidy, Δ Copy number = 0. D. Left, viability curves for NCI-H295R treated with different classes of EZH2i for 96 hours (EPZ-6438, GSK126 are SAM-competitive EZH2i, EED226 is an allosteric EZH2i; n=4 each), x-axis is log10 of the drug concentration in M. Data shown as mean with SEM. Right, western blot measuring H3K27me3 relative to β-actin loading control shown right, n>3; doses tested, GSK126: 0 (Vehicle), 1.25 μM, 5 μM, 7.5 μM, 15 μM, 20 μM (IC-50); EPZ-6438: 0, 1.25 μM, 12.5 μM, 25 μM, 50 μM, 62 μM (IC-50); EED226: 0, 1.25 μM, 12.5 μM, 25 μM, 50 μM, 80 μM (IC-50). Across replicates and all EZH2i, H3K27me3 levels measured by western blot (corrected by loading control and normalized to vehicle) are negatively linearly correlated with EZH2i concentration (Pearson test; p < 0.0001, r = −0.5117). E. NCI-H295R transfected with EZH2 siRNA (siEZH2 A, B, or C) or scrambled negative control (–), and harvested at 144 hours to assess viability (line at mean with 95% CI) and EZH2/H3K27me3/β-actin by western blot (right, n≥2). NCI-H295R doubling time is ~60 hours; time points selected adequate to measure replication dilution of H3K27me3. F. NCI-H295R were pre-treated with different classes of EZH2i for 96 hours as in D (right), and viable cells were plated at colony forming density in regular (EZH2i-free) medium, grown for 4 weeks. Top, colony area (quantified with Fiji) vs. EZH2i pre-treatment doses. Bottom, representative images of crystal-violet stained colonies at increasing EZH2i doses. Representative experiment shown, n=2. G. G0S2 methylation after increasing doses of EZH2i (n=3, top) or EZH2 siRNA (n=1, bottom). Data represented as mean with SEM for each condition. Veh=Vehicle. H. Venn diagram of total number of CpG probes in NCI-H295R methylome and those which were differentially methylated following EZH2i (EPZ-6438 at the IC-50 dose). No probes gained methylation after EZH2i. I. Top, Venn diagram of unique proteins retrieved by DNMT1 IP-MS and EZH2 IP-MS on NCI-H295R nuclear lysates. Bottom, peptides retrieved from DNMT1 or EZH2 IP-MS mapping to known chromatin regulators. SpC=spectral counts. J. Left, heatmap of EZH2, H3K27me3, and H3K27ac ChIP-seq and accessibility (ATAC=ATAC-seq) signal in baseline NCI-H295R at EZH2 peaks, ranked by EZH2 signal. Centered at peak +/− 3 kb window. Right, Venn diagram of EZH2, H3K27me3, and H3K27ac peaks. K. Top, Venn diagram of baseline NCI-H295R H3K27me3 peaks and regions targeted for hypermethylation in CIMP-high ACC (DMR+). Bottom, violin plot of average CpG island methylation level (β) in DMR+, DMR+/H3K27me3 overlap regions, and H3K27me3 peaks; lines at median and quartiles. L. Profile plot and heatmap of H3K27me3 signal at regions annotated as baseline NCI-H295R H3K27me3 peaks and DMR+ in NCI-H295R and ENCODE fetal and adult adrenal ChIP-seq. Centered at peak/DMR +/− 3 kb window.
Figure 3:
Figure 3:. EZH2i disrupts EZH2 recruitment genome-wide, restrains zF differentiation, and reverses the CIMP-high molecular state
A. Left, Venn diagram of NCI-H295R EZH2 peaks at baseline (vehicle-treated, EZH2i−) and after EZH2i (EZH2i+=EPZ-6438 at the IC-50 dose). Right, heatmap of EZH2, H3K27me3, H3K27ac signal in union set of EZH2 peaks at baseline and after EZH2i. Heatmap ranked by ratio of EZH2 signal at baseline to after EZH2i. Centered at peak +/− 3 kb window. B. Average baseline NCI-H295R expression (fragments per kilobase of transcript per million mapped reads, FPKM) of all genes in the transcriptome compared to baseline FPKM of genes induced by EZH2i (Up). C. Top, number of differentially expressed genes (adj. p-value<0.05) in EZH2i- vs. vehicle-treated NCI-H295R, FC=fold change. Bottom, corresponding volcano plot. Light blue dots correspond to differentially expressed genes. D. Left, Venn diagram of genes upregulated by EZH2i in NCI-H295R with genes upregulated in mouse model of SF1-driven Ezh2 deficiency (Ezh2 KO, (52)). Right, 5 most significant gene sets resulting from GSEA on overlap genes using the GO (BP=Biological Processes) gene set. E. HOMER motif analysis on differentially accessible peaks from NCI-H295R EZH2i compared to baseline ATAC-seq. NR5A2 shares same motif as NR5A1 (SF1). F. DiffTF integrating RNA-seq and ATAC-seq from NCI-H295R treated with forskolin to induce zF differentiation vs. vehicle. Negative and positive weighted mean difference reflect transcription factor signal stronger in forskolin- or vehicle-treated cells, respectively. G. Steroidogenesis diagram depicting impact of forskolin on expression of zonally expressed steroidogenic enzymes in NCI-H295R by RNA-seq. H. Venn diagram of differentially expressed genes (compared to baseline) in NCI-H295R treated with EZH2i or forskolin by RNA-seq (Supp Table 1). I. Steroidogenesis diagram depicting impact of EZH2i on enzyme expression in NCI-H295R by RNA-seq. J. Fold change in expression of steroidogenic enzymes in ACC cell lines treated with increasing doses of EZH2i measured by qPCR. NCI-H295R, n=1. ATC7L, n=2–3 for all points. Data shown as mean with SEM. Concentrations tested were: NCI-H295R, as in Figure 2D; ATC7L - 0, 42 μM, 84 μM EPZ-6438 (IC-50) and 0, 53 μM, 107 μM EED226 (IC-50). K. Heatmap of gene expression of NCI-H295R at baseline (vehicle, Veh), following forskolin (Fsk) treatment or following EZH2i with adj. p-value for comparison to Veh shown right, by RNA-seq. FOXF1 is a PRC2 target (Supp Fig 4B). Per Supp Fig 3B, “zF genes”= HSD3B2, MC2R and remainder are “zG genes”. L. NCI-H295R were treated with indicated doses of EZH2i followed by forskolin. Gene expression measured by qPCR, n=3. Data shown as mean with SEM. M. LC-MS/MS analysis of media from NCI-H295R treated as in L to measure zone-specific steroid output. Left, line graph depicting fold change of normalized steroid output relative to vehicle. Data shown as mean and 95% CI. Right, heatmap displaying mean fold change. If the null value (1) falls in the 95% CI of the mean for each treatment group, change in steroid output is considered insignificant (ns) and fold change is not displayed. N. ZF differentiation, Wnt, and cell cycle scores for NCI-H295R at baseline (Veh) or treated with forskolin (Fsk) or EZH2i, calculated and graphed as in Figure 1B.
Figure 4:
Figure 4:. Nuclear pools of off-chromatin (EZH2-bound) and on chromatin (SF1-bound) β-catenin direct upper zF differentiation in CIMP-high ACC
A. Peptides retrieved from EZH2 IP-MS on NCI-H295R nuclear lysates. B. Representative western blot of NCI-H295R nuclear co-IP, detecting EZH2, SUZ12 and β-catenin. Lanes are 10% input, negative control co-IP (no antibody, IgG), EZH2 IP and SUZ12 IP. n>5 (EZH2 IP), n=2 (SUZ12 IP). C. Venn diagram of H3K27me3, EZH2, and β-catenin ChIP-seq peaks in baseline NCI-H295R. D. Representative western blot of EZH2 IP in vehicle- (left) or EZH2i-treated (right, IC-50 dose) NCI-H295R. Lanes are 10% input, negative control IgG IP, EZH2 IP. Higher molecular weight band in EPZ-6438 IgG lane in EZH2/SUZ12 blots is non-specific and emerges when using the same antibody species for IP and western. E. Heatmap of β-catenin, H3K27ac, and ATAC signal in baseline NCI-H295R at β-catenin peaks, ranked by β-catenin signal. Centered at peak +/− 3 kb window. F. HOMER motif analysis on baseline NCI-H295R β-catenin peaks. G. Peptides retrieved from SF1 IP-MS on NCI-H295R nuclear lysates. H. Heatmap of SF1, H3K27ac and ATAC signal in baseline NCI-H295R at SF1 peaks, ranked by SF1 signal. Centered at peak +/− 3 kb window. I. Venn diagram of baseline NCI-H295R SF1 and β-catenin peaks. J. Venn diagram of baseline NCI-H295R SF1/β-catenin peaks, baseline NCI-H295R super-enhancers (SE), and physiologic adrenal SE called by 3DIV on ENCODE samples. K. Single-cell RNA-seq (scRNA-seq) data from fetal, neonatal and adult human adrenal (31) was integrated and analyzed with comparison to reference markers to identify populations comprising the corticocapsular unit. Top left, scRNA-seq UMAP. Non-steroid.=Non-steroidogenic, Diff.=Differentiated, Delam.=Delaminating. Top right, scRNA-seq pseudotime analysis (origins set for fetal and adult adrenal populations in the capsule and non-steroidogenic zG). Bottom, heatmap of scaled expression of lineage-defining genes across scRNA-seq with epigenetic regulation in NCI-H295R shown left. Prom=promoter, enh=enhancer, DNAme=DNA methylation. Gene regulation by active (H3K27ac only) and SF1- or SF1/β-catenin-bound enhancers was identified by overlap of ChIP-seq with adrenal promoter capture Hi-C (pcHi-C (34)). L. Single-cell ATAC-seq (scATAC-seq) data from fetal and adult human adrenal (32,33) was integrated and analyzed with comparison to scRNA-seq and reference markers to identify analogous populations comprising the corticocapsular unit. Cells colored in grey in UMAP plot are likely cortical given accessibility within NR5A1 locus though possess ambiguous classification. M. Example adrenal scATAC-seq and NCI-H295R ATAC, SF1, β-catenin, and H3K27ac tracks across the NR5A1 and HSD3B2 loci in baseline NCI-H295R. Adrenal scATAC peak calls are depicted by pink bars at the bottom of top window, and NCI-H295R peak calls are depicted by bars below each track. 3DIV annotation of adrenal super-enhancers (SE), and NCI-H295R baseline SE are shown by bars below window. Promoter/enhancer contacts from adrenal (Ad.) pcHi-C (34) are depicted below gene annotations. N. Ridge plot of chromatin accessibility signal at SF1/β-catenin co-targets in ACC-TCGA ATAC-seq samples (n=9, (65)). Line at median.
Figure 5:
Figure 5:. Nuclear EZH2/β-catenin and SF1/β-catenin complexes persist through adrenocortical neoplastic evolution
A. Left, heatmap of gene expression measured by qPCR in adrenals from control mice (ASCre/+), mice with p53 LOF (PCreAS/+), mice with β-catenin GOF (BCreAS/+), or ACC from combined p53 LOF/β-catenin GOF (BPCreAS/+). Right, p-value for each genotype compared to control. B. Top row, representative hematoxylin and eosin (H&E) staining of control adult mouse adrenal and BPCreAS/+ primary tumor (10-month-old). Rows 2–6, immunofluorescence staining nuclei (DAPI), β-catenin, EZH2, H3K27me3, or SF1. Rows 7–8, colocalization of β-catenin or SF1 and EZH2. Bar=50 μm. C-E. Representative images of SF1/β-catenin (left) and EZH2/β-catenin (right) proximity ligation assay (PLA) performed on 3-month-old adrenals (control, n=4; PCreAS/+, n=3; BCreAS/+, n=3; BPCreAS/+, n=4), BPCreAS/+ primary ACC (n=5), BPCreAS/+ lung metastases (n=3). PLA signal are subnuclear pink dots. Bar=100 μm. F-G. Representative images of SF1, β-catenin, and EZH2 IHC or SF1/β-catenin and EZH2/β-catenin PLA in human adult adrenal cortex (n=2). Bar=100 μm. H. Representative images of SF1/β-catenin and EZH2/β-catenin PLA in a TMA of human adult ACA (n=39) and primary (n=34) and metastatic (n=35) ACC. I. Normalized TMA PLA signal, quantified by Fiji. Each sample is represented by a point. Top right, “Eβ PLA/Sβ PLA” refers to ratio of EZH2/β-catenin PLA signal to SF1/β-catenin PLA signal. Top row, line at mean with 95% CI.
Figure 6:
Figure 6:. EZH2i evicts SF1 and β-catenin genome-wide, disrupting enhancer programming in CIMP-high ACC
A. Venn diagram of genes putatively regulated by active SF1/β-catenin-bound enhancers and downregulated by EZH2i. B-C. Venn diagram of NCI-H295R β-catenin or SF1 peaks at baseline (vehicle-treated) and after EZH2i. D. Profile plot and heatmap of NCI-H295R SF1, β-catenin, H3K27ac, and ATAC signal at SF1 peaks at baseline (EZH2i−) and after EZH2i (EZH2i+), ranked by baseline SF1 signal. Centered at peak +/− 3 kb window. E. Example SF1, β-catenin, H3K27ac ChIP-seq, and accessibility (ATAC-seq) tracks across the NR5A1 and HSD3B2 loci in NCI-H295R at baseline (as in Figure 4M) or after EZH2i. Peak calls depicted by bars below each track. 3DIV annotation of adrenal SE, NCI-H295R baseline and EZH2i SE shown by bars below window. F. Left, Venn diagram of NCI-H295R SE at baseline and after EZH2i. Right, Venn diagram of NCI-H295R EZH2i SE with SF1 EZH2i peaks and β-catenin EZH2i peaks. G. Left, viability curves for NCI-H295R treated with increasing concentrations of CBP inhibitor (CBPi) PRI-724 +/− different EZH2i (GSK126, EPZ-6438 or EED226) at the IC-50 dose. Right, coefficient of drug interaction (CDI) for viability. CDI>1 represents antagonism (A), CDI <1 represents synergy (S). Data are represented by mean with SEM (whiskers or error bands). CBPi, n=9; CBPi + GSK126, n=3; CBPi + EPZ-6438, n=3; CBPi + EED226, n=3. H. HOMER motif analysis on differentially accessible peaks from NCI-H295R CBPi (IC-50) compared to baseline ATAC-seq. I. Venn diagram of differentially expressed genes (compared to baseline) in NCI-H295R treated with EZH2i or CBPi (IC-50) measured by RNA-seq (Supp Table 1). J. Scatterplot of change in gene expression (compared to baseline) in NCI-H295R treated with CBPi vs. EZH2i. K. Fold change in expression of steroidogenic enzymes in ACC cell lines treated with increasing doses of CBPi measured by qPCR. NCI-H295R, n=2. ATC7L, n=3. Data shown as mean with SEM. L. Steroidogenesis diagram depicting impact of CBPi on enzyme expression in NCI-H295R by RNA-seq. M. ZF differentiation, Wnt, and cell cycle scores for NCI-H295R at baseline (Veh) or treated with forskolin (Fsk), EZH2i, or CBPi calculated and graphed as in Figure 3N.
Figure 7:
Figure 7:. EZH2i hinders ACC growth, proliferation, and differentiation in vivo
A. Derivation of BCH-ACC3A cell line and subcutaneous NSG mouse allograft model, randomized to vehicle or EZH2i treatment at tumor volume 100 mm3. B. Tumor growth across treatment groups; data shown as mean with SEM. C. H3K27me3 IHC across treatment groups. Left, bar=50 μm; right, each sample represented by 3 points, H3K7me3 quantified by MATLAB, line at median. D-H. Ki67 IHC, SF1 IHC, Cyp11b1 RNA in situ hybridization, SF1/β-catenin PLA or EZH2/β-catenin PLA across treatment groups. Left, bar=100 μm; right, each sample is represented by a point and % nuclear signal, Cyp11b1 islands, or normalized PLA signal quantified by Fiji, line at median. I. Model: In the upper zF of the normal adrenal cortex, β-catenin restrains zF differentiation or permits zF proliferation depending on endocrine demands (systemic need for glucocorticoids and flux through ACTH). This homeostasis is required for organism survival. In CIMP-high ACC, β-catenin drives zF differentiation through SF1/β-catenin hijacking of genome-wide SE. SF1/β-catenin’s actions on chromatin are limited by EZH2/β-catenin, an off-chromatin complex that completes for β-catenin binding. EZH2/β-catenin abundance is limited by on chromatin EZH2 and PRC2 catalytic activity. PRC2 remains catalytically active in CIMP-high ACC despite displacement by CpGi hypermethylation (written by DNA methyltransferases like DNMT1). Recurrent Wnt pathway and cell cycle alterations in CIMP-high ACC promote the formation of β-catenin-containing and EZH2-containing complexes. Ultimately, β-catenin-dependent zF differentiation is required for sustained ACC proliferation at the cost of organism survival. This program is erased by ACC dedifferentiating agents like EZH2i or CBPi, representing a promising therapeutic avenue.

References

    1. Flavahan WA, Gaskell E, Bernstein BE. Epigenetic plasticity and the hallmarks of cancer. Science 2017;357 - PMC - PubMed
    1. Kadoch C, Hargreaves DC, Hodges C, Elias L, Ho L, Ranish J, et al. Proteomic and bioinformatic analysis of mammalian SWI/SNF complexes identifies extensive roles in human malignancy. Nat Genet 2013;45:592–601 - PMC - PubMed
    1. Easwaran H, Johnstone SE, Van Neste L, Ohm J, Mosbruger T, Wang Q, et al. A DNA hypermethylation module for the stem/progenitor cell signature of cancer. Genome Res 2012;22:837–49 - PMC - PubMed
    1. Deevy O, Bracken AP. PRC2 functions in development and congenital disorders. Development 2019;146 - PMC - PubMed
    1. Schuettengruber B, Bourbon HM, Di Croce L, Cavalli G. Genome Regulation by Polycomb and Trithorax: 70 Years and Counting. Cell 2017;171:34–57 - PubMed

Publication types

MeSH terms