. 2023 May 15;83(10):1699-1710.
doi: 10.1158/0008-5472.CAN-22-2620.

BRCA2 Germline Mutations Identify Gastric Cancers Responsive to PARP Inhibitors

Affiliations

BRCA2 Germline Mutations Identify Gastric Cancers Responsive to PARP Inhibitors

Annalisa Petrelli et al. Cancer Res. .

Abstract

Despite negative results of clinical trials conducted on the overall population of patients with gastric cancer, PARP inhibitor (PARPi) therapeutic strategy still might represent a window of opportunity for a subpopulation of patients with gastric cancer. An estimated 7% to 12% of gastric cancers exhibit a mutational signature associated with homologous recombination (HR) failure, suggesting that these patients could potentially benefit from PARPis. To analyze responsiveness of gastric cancer to PARPi, we exploited a gastroesophageal adenocarcinoma (GEA) platform of patient-derived xenografts (PDX) and PDX-derived primary cells and selected 10 PDXs with loss-of-function mutations in HR pathway genes. Cell viability assays and preclinical trials showed that olaparib treatment was effective in PDXs harboring BRCA2 germline mutations and somatic inactivation of the second allele. Olaparib responsive tumors were sensitive to oxaliplatin as well. Evaluation of HR deficiency (HRD) and mutational signatures efficiently stratified responder and nonresponder PDXs. A retrospective analysis on 57 patients with GEA showed that BRCA2 inactivating variants were associated with longer progression-free survival upon platinum-based regimens. Five of 7 patients with BRCA2 germline mutations carried the p.K3326* variant, classified as "benign." However, familial history of cancer, the absence of RAD51 foci in tumor cells, and a high HRD score suggest a deleterious effect of this mutation in gastric cancer. In conclusion, PARPis could represent an effective therapeutic option for BRCA2-mutated and/or high HRD score patients with GEA, including patients with familial intestinal gastric cancer.

Significance: PARP inhibition is a potential strategy for treating patients with gastric cancer with mutated BRCA2 or homologous repair deficiency, including patients with familial intestinal gastric cancer, for whom BRCA2 germline testing should be recommended.


Figures

Figure 1. GEA primary cells bearing BRCA2 germline mutations and loss of the WT allele are sensitive to PARPis. Boxplots showing the GR50 of primary cells derived from gastric cancer PDXs exposed to 3 different PARPis: olaparib, niraparib, and rucaparib. Boxes indicate the median ± standard deviation of GR50 values of 3 independent dose–response experiments (dots). GR50 and statistical significance (Wilcoxon rank-sum test) were calculated using the GRcalculator tool [(14); see Methods for details].
Figure 1.
GEA primary cells bearing BRCA2 germline mutations and loss of the WT allele are sensitive to PARPis. Boxplots showing the GR50 of primary cells derived from gastric cancer PDXs exposed to three different PARPis: olaparib, niraparib, and rucaparib. Boxes indicate the median ± SD of GR50 values of three independent dose–response experiments (dots). GR50 and statistical significance (Wilcoxon rank-sum test) were calculated using the GRcalculator tool (see Materials and Methods for details; ref. 14).
Figure 2. MSS gastric cancers carrying BRCA2 germline mutations and loss of the WT allele are responsive to olaparib in preclinical trials. Tumor growth curves of the PDX cohorts derived from the BRCA2 germline mutated human specimens of the indicated models. After reaching an average tumor volume of 220 to 250 mm3, PDXs were treated either with placebo (vehicle, blue lines) or olaparib (2 mg/mouse, 5 days/week per OS; orange lines). Lines represent average tumor volume + standard deviation. N = 5–7 animals. The response has been evaluated using RECIST 1.1-like criteria: PD: ≥ 35% increase from baseline; PR: ≥ 50% reduction from baseline; SD: intermediate variations from baseline (dashed lines). The clinical response of each PDX is indicated in red). On the top of the graphs the BRCA2 genotype and the MSS/MSI status of the treated model are indicated; group A comprises BRCA2 germline mutations and loss of the WT allele in a MSS context; group B shows BRCA2 germline mutations and loss of the WT allele in a MSI context; group C carries BRCA2 germline mutations without loss of the WT allele in a MSS context. Arrows = treatment start. Statistical significance was calculated using the Two-way ANOVA with Bonferroni correction. For GTR0126 and GTR0222 the olaparib arm at the end of the trial was compared with the Vehicle arm at the time of mice sacrifice (****, P < 0.0001).
Figure 2.
MSS gastric cancers carrying BRCA2 germline mutations and loss of the WT allele are responsive to olaparib in preclinical trials. A-C, Tumor growth curves of the PDX cohorts derived from the BRCA2 germline mutated human specimens of the indicated models. After reaching an average tumor volume of 220 to 250 mm3, PDXs were treated either with placebo (vehicle, blue lines) or olaparib (2 mg/mouse, 5 days/week per OS; orange lines). Lines represent average tumor volume + SD. N = 5–7 animals. The response has been evaluated using RECIST 1.1-like criteria: PD, ≥ 35% increase from baseline; PR, ≥ 50% reduction from baseline; SD, intermediate variations from baseline (dashed lines). The RECIST-based response of each PDX is indicated in red. At the top of the graphs, the BRCA2 genotype and the MSS/MSI status of the treated model are indicated; group A comprises BRCA2 germline mutations and loss of the WT allele in a MSS context; group B shows BRCA2 germline mutations and loss of the WT allele in a MSI context; group C carries BRCA2 germline mutations without loss of the WT allele in a MSS context. Arrows, treatment start. Statistical significance was calculated using the two-way ANOVA with Bonferroni correction. For GTR0126 and GTR0222, the olaparib arm at the end of the trial was compared with the vehicle arm at the time of mice sacrifice. ****, P < 0.0001.
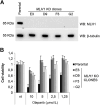
Figure 3. MLH1 gene KO abrogates responsiveness to olaparib. A, Western blot analysis of 4 different MLH1 KO clones (E3, D9, F3, G2) obtained from GTR0210 primary cells (parental) by CRISPR-Cas9 genome editing. B, Cell viability of GTR0210 parental cells and MLH1 KO clones derived thereof, exposed at the indicated increasing concentrations of olaparib for 6 days.
Figure 3.
MLH1 gene KO abrogates responsiveness to olaparib. A, Western blot analysis of four different MLH1 KO clones (E3, D9, F3, G2) obtained from GTR0210 primary cells (parental) by CRISPR-Cas9 genome editing. B, Cell viability of GTR0210 parental cells and MLH1 KO clones derived thereof, exposed at the indicated increasing concentrations of olaparib for 6 days.
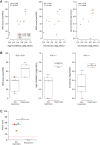
Figure 4. HRD score and mutational signatures predict responsiveness to olaparib. A, Scatter plots showing values of HRD and mutational signature score (colored dots) obtained with the indicated tools in the PDXs used in preclinical trials. For the GTR0126, GTR0210, GTR0222, and GTR0503 models the analysis was performed on two different mice. GTR0126, GTR0210, and GTR0222 = responder PDXs; GTR0264, GTR0324, GTR0459, and GTR0503 = nonresponder PDXs. B, Boxplot showing distribution of HRD score, COSMIC Signature 3 and S3 signature from (9) in responder and nonresponder PDXs. C, Evaluation of the RAD51 score in the PARPi responsive and resistant models used in the preclinical trials shown in Fig. 2. GTR0222 tumor tissue was not evaluable due to technical issues. RAD51 score was defined as the number of geminin-positive cells that express at least 5 RAD51 nuclear foci. The predefined cutoff of 10% (red dashed line) for the RAD51 score was used to qualify tumors as HRD (≤ 10%) or HRP (> 10%). **, P = 0.005.
Figure 4.
HRD score and mutational signatures predict responsiveness to olaparib. A, Scatter plots showing values of HRD and mutational signature score (colored dots) obtained with the indicated tools in the PDXs used in preclinical trials. For the GTR0126, GTR0210, GTR0222, and GTR0503 models the analysis was performed on two different mice. GTR0126, GTR0210, and GTR0222 are responder PDXs; GTR0264, GTR0324, GTR0459, and GTR0503 are nonresponder PDXs. B, Boxplot showing distribution of HRD score, COSMIC Signature 3, and S3 signature from ref. in responder and nonresponder PDXs. C, Evaluation of the RAD51 score in the PARPi responsive and resistant models used in the preclinical trials shown in Fig. 2. GTR0222 tumor tissue was not evaluable due to technical issues. RAD51 score was defined as the number of geminin-positive cells that express at least 5 RAD51 nuclear foci. The predefined cutoff of 10% (red dashed line) for the RAD51 score was used to qualify tumors as HRD (≤10%) or HRP (>10%). **, P = 0.005.
Figure 5. Gastric cancer PDXs responsive to olaparib exhibit cross-sensitivity to platinum agents. Tumor growth curves in the same BRCA2 germline mutated PDX models shown in Fig. 2. When reaching an average tumor volume of 220 to 250 mm3, mice were treated either with placebo (vehicle, blue lines) or oxaliplatin (0.1 mg/mouse, once a week, IP, for 3 weeks; orange lines). Lines represent average tumor volume + standard deviation. N = 4–7 animals. The response has been evaluated using RECIST 1.1-like criteria: PD: ≥ 35% increase from baseline; PR: ≥ 50% reduction from baseline; SD: intermediate variations from baseline (dashed lines). The clinical response of each PDX is indicated in red). On the top of the graphs the BRCA2 genotype and the MSS/MSI status of the model are indicated (groups A, B, and C as in Fig. 2) Arrows = treatment start. Statistical significance was calculated using the two-way ANOVA with Bonferroni correction. For GTR0222 the Oxaliplatin arm at the end of the trial was compared with the Vehicle arm at the time of mice sacrifice (****, P < 0.01).
Figure 5.
Gastric cancer PDXs responsive to olaparib exhibit cross-sensitivity to platinum agents. A-C, Tumor growth curves in the same BRCA2 germline mutated PDX models shown in Fig. 2. When reaching an average tumor volume of 220 to 250 mm3, mice were treated either with placebo (vehicle, blue lines) or oxaliplatin (0.1 mg/mouse, once a week, IP, for 3 weeks; orange lines). Lines represent average tumor volume + SD. N = 4–7 animals. The response has been evaluated using RECIST 1.1-like criteria: PD: ≥ 35% increase from baseline; PR: ≥ 50% reduction from baseline; SD: intermediate variations from baseline (dashed lines). The RECIST-based response of each PDX is indicated in red. At the top of the graphs, the BRCA2 genotype and the MSS/MSI status of the model are indicated (groups A, B, and C, as in Fig. 2). Arrows, treatment start. Statistical significance was calculated using the two-way ANOVA with Bonferroni correction. For GTR0222, the oxaliplatin arm at the end of the trial was compared with the vehicle arm at the time of mice sacrifice. **, P = 0.005; ****, P < 0.01.
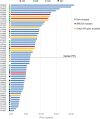
Figure 6. BRCA2-mutated patients with GEA achieve prolonged PFS upon platinum-based chemotherapy. Waterfall plot of PFS in patients with GEA administered platinum agents. Red bars = patients with BRCA2-mutated tumors; yellow bars = patients with LOF mutations in other HR genes (see Supplementary Table S3). The horizontal dashed line indicates the patient with the median PFS (= 6.4 months). CR, complete response.
Figure 6.
BRCA2-mutated patients with GEA achieve prolonged PFS upon platinum-based chemotherapy. Waterfall plot of PFS in patients with GEA administered platinum agents. Red bars, patients with BRCA2-mutated tumors; yellow bars, patients with LOF mutations in other HR genes (see Supplementary Table S3). The horizontal dashed line indicates the patient with the median PFS (= 6.4 months). CR, complete response.

References

    1. Bray F, Ferlay J, Soerjomataram I, Siegel RL, Torre LA, Jemal A. Global cancer statistics 2018: GLOBOCAN estimates of incidence and mortality worldwide for 36 cancers in 185 countries. CA Cancer J Clin 2018;68:394–424. - PubMed
    1. Network CGAR. Comprehensive molecular characterization of gastric adenocarcinoma. Nature 2014;513:202–9. - PMC - PubMed
    1. Bang YJ, Van Cutsem E, Feyereislova A, Chung HC, Shen L, Sawaki A, et al. . Trastuzumab in combination with chemotherapy versus chemotherapy alone for treatment of HER2-positive advanced gastric or gastroesophageal junction cancer (ToGA): a phase III, open-label, randomized controlled trial. Lancet 2010;376:687–97. - PubMed
    1. Wilke H, Muro K, Van Cutsem E, Oh SC, Bodoky G, Shimada Y, et al. . Ramucirumab plus paclitaxel versus placebo plus paclitaxel in patients with previously treated advanced gastric or gastroesophageal junction adenocarcinoma (RAINBOW): a double-blind, randomized phase III trial. Lancet Oncol 2014;15:1224–35. - PubMed
    1. Janjigian YY, Kawazoe A, Yañez P, Li N, Lonardi S, Kolesnik O, et al. . The KEYNOTE-811 trial of dual PD-1 and HER2 blockade in HER2-positive gastric cancer. Nature 2021;600:727–30. - PMC - PubMed

Publication types

MeSH terms