

Femoral posture during embryonic and early fetal development: An analysis using landmarks on the cartilaginous skeletons of ex vivo human specimens
- PMID: 37130112
- PMCID: PMC10153723
- DOI: 10.1371/journal.pone.0285190
Femoral posture during embryonic and early fetal development: An analysis using landmarks on the cartilaginous skeletons of ex vivo human specimens
Abstract
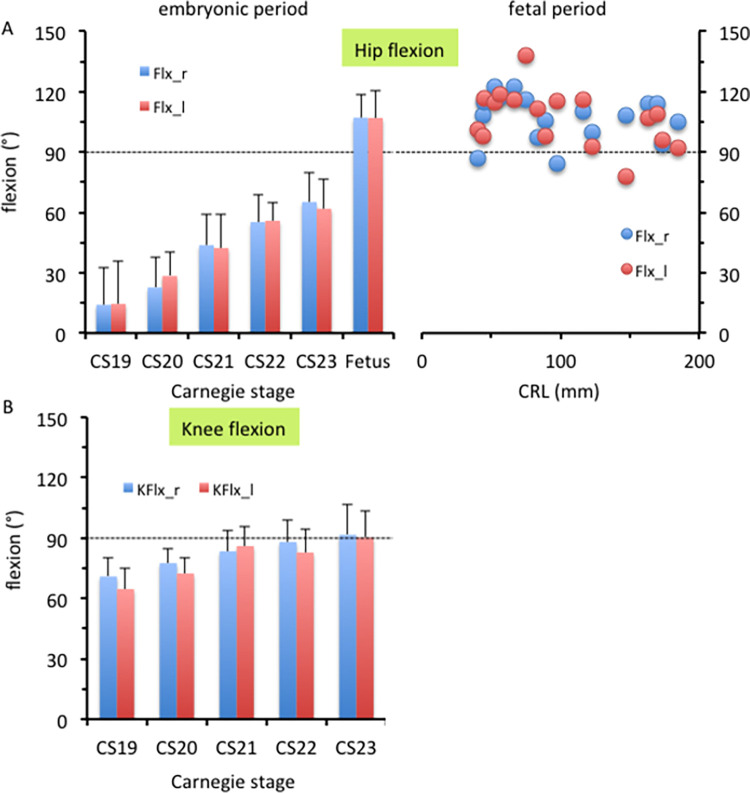
The pre-axial border medially moves between the fetal and early postnatal periods, and the foot sole can be placed on the ground. Nonetheless, the precise timeline when this posture is achieved remains poorly understood. The hip joint is the most freely movable joint in the lower limbs and largely determines the lower-limb posture. The present study aimed to establish a timeline of lower-limb development using a precise measurement of femoral posture. Magnetic resonance images of 157 human embryonic samples (Carnegie stages [CS] 19-23) and 18 fetal samples (crown rump length: 37.2-225 mm) from the Kyoto Collection were obtained. Three-dimensional coordinates of eight selected landmarks in the lower limbs and pelvis were used to calculate the femoral posture. Hip flexion was approximately 14° at CS19 and gradually increased to approximately 65° at CS23; the flexion angle ranged from 90° to 120° during the fetal period. Hip joint abduction was approximately 78° at CS19 and gradually decreased to approximately 27° at CS23; the average angle was approximately 13° during the fetal period. Lateral rotation was greater than 90° at CS19 and CS21 and decreased to approximately 65° at CS23; the average angle was approximately 43° during the fetal period. During the embryonic period, three posture parameters (namely, flexion, abduction, and lateral rotation of the hip) were linearly correlated with each other, suggesting that the femoral posture at each stage was three-dimensionally constant and exhibited gradual and smooth change according to growth. During the fetal period, these parameters varied among individuals, with no obvious trend. Our study has merits in that lengths and angles were measured on anatomical landmarks of the skeletal system. Our obtained data may contribute to understanding development from anatomical aspects and provide valuable insights for clinical application.
Copyright: © 2023 Takakuwa et al. This is an open access article distributed under the terms of the Creative Commons Attribution License, which permits unrestricted use, distribution, and reproduction in any medium, provided the original author and source are credited.
Conflict of interest statement
The authors have declared that no competing interests exist.
Figures


Similar articles
-
Upper arm posture during human embryonic and fetal development.Anat Rec (Hoboken). 2022 Jul;305(7):1682-1691. doi: 10.1002/ar.24796. Epub 2021 Oct 19. Anat Rec (Hoboken). 2022. PMID: 34605199
-
Cartilage formation in the pelvic skeleton during the embryonic and early-fetal period.PLoS One. 2017 Apr 6;12(4):e0173852. doi: 10.1371/journal.pone.0173852. eCollection 2017. PLoS One. 2017. PMID: 28384153 Free PMC article.
-
Radiology of adolescent slipped capital femoral epiphysis: measurement of epiphyseal angles and diagnosis.Oper Orthop Traumatol. 2007 Oct;19(4):329-44. doi: 10.1007/s00064-007-1214-6. Oper Orthop Traumatol. 2007. PMID: 17940732 English, German.
-
[In vitro analysis of the continuous active patellofemoral kinematics of the normal and prosthetic knee].Rev Chir Orthop Reparatrice Appar Mot. 2002 Dec;88(8):797-802. Rev Chir Orthop Reparatrice Appar Mot. 2002. PMID: 12503021 French.
-
[The origin of femoral trochlear dysplasia: comparative anatomy, evolution, and growth of the patellofemoral joint].Rev Chir Orthop Reparatrice Appar Mot. 2001 Jun;87(4):373-83. Rev Chir Orthop Reparatrice Appar Mot. 2001. PMID: 11431633 Review. French.
Cited by
-
Association of femoral retroversion and out-toeing gait with development of hip osteoarthritis and treatment: a systematic review.Acta Orthop. 2025 Apr 17;96:356-362. doi: 10.2340/17453674.2025.43475. Acta Orthop. 2025. PMID: 40242886 Free PMC article.
References
-
- O’Rahilly R, Müller F. Developmental stages in human embryos: Including a revision of Streeter’s “Horizons” and a survey of the Carnegie collection. Washington District of Columbia: Carnegie Institution of Washington; 1987.
-
- O’Rahilly R, Müller F. Chapter 18. The skeletal system and limbs. In: O’Rahilly R, Müller F, editors. Human embryology and teratology. 3rd ed. New York: Wiley-Liss, Inc.; 2001. pp. 357–394.
-
- Standring S. Gray’s anatomy. 41st ed. Amsterdam: Elsevier; 2005.
Publication types
MeSH terms
LinkOut - more resources
Full Text Sources
Medical
