A deep learning-based application for COVID-19 diagnosis on CT: The Imaging COVID-19 AI initiative
- PMID: 37130128
- PMCID: PMC10153726
- DOI: 10.1371/journal.pone.0285121
A deep learning-based application for COVID-19 diagnosis on CT: The Imaging COVID-19 AI initiative
Abstract
Background: Recently, artificial intelligence (AI)-based applications for chest imaging have emerged as potential tools to assist clinicians in the diagnosis and management of patients with coronavirus disease 2019 (COVID-19).
Objectives: To develop a deep learning-based clinical decision support system for automatic diagnosis of COVID-19 on chest CT scans. Secondarily, to develop a complementary segmentation tool to assess the extent of lung involvement and measure disease severity.
Methods: The Imaging COVID-19 AI initiative was formed to conduct a retrospective multicentre cohort study including 20 institutions from seven different European countries. Patients with suspected or known COVID-19 who underwent a chest CT were included. The dataset was split on the institution-level to allow external evaluation. Data annotation was performed by 34 radiologists/radiology residents and included quality control measures. A multi-class classification model was created using a custom 3D convolutional neural network. For the segmentation task, a UNET-like architecture with a backbone Residual Network (ResNet-34) was selected.
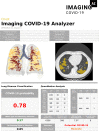
Results: A total of 2,802 CT scans were included (2,667 unique patients, mean [standard deviation] age = 64.6 [16.2] years, male/female ratio 1.3:1). The distribution of classes (COVID-19/Other type of pulmonary infection/No imaging signs of infection) was 1,490 (53.2%), 402 (14.3%), and 910 (32.5%), respectively. On the external test dataset, the diagnostic multiclassification model yielded high micro-average and macro-average AUC values (0.93 and 0.91, respectively). The model provided the likelihood of COVID-19 vs other cases with a sensitivity of 87% and a specificity of 94%. The segmentation performance was moderate with Dice similarity coefficient (DSC) of 0.59. An imaging analysis pipeline was developed that returned a quantitative report to the user.
Conclusion: We developed a deep learning-based clinical decision support system that could become an efficient concurrent reading tool to assist clinicians, utilising a newly created European dataset including more than 2,800 CT scans.
Copyright: © 2023 Topff et al. This is an open access article distributed under the terms of the Creative Commons Attribution License, which permits unrestricted use, distribution, and reproduction in any medium, provided the original author and source are credited.
Conflict of interest statement
I have read the journal’s policy and the authors of this manuscript have the following competing interests: Laurens Topff, Merel Huisman, Regina G.H. Beets-Tan: no disclosures; Jacob J. Visser: medical advisor Noaber Foundation, medical advisor NLC, medical advisor Contextflow GmbH, medical advisor Quibim S.L.; Julien Guiot: personal fees for advisory board, work and lectures from Boehringer Ingelheim, Janssens, GSK, Roche and Chiesi, non-financial support for meeting attendance from Chiesi, Roche, Boehringer Ingelheim and Janssens, permanent SAB of Radiomics (Oncoradiomics SA) for the SALMON trial without any specific consultancy fee for this work, co-inventor of one issued patent on radiomics licensed to Radiomics (Oncoradiomics SA); Erik R. Ranschaert: medical advisor Quibim S.L, medical advisor Robovision BV; Ángel Alberich-Bayarri: CEO and a shareholder of Quibim S.L.; José Sánchez-García, Rafael López-González, Ana Jiménez Pastor, Almudena Fuster-Matanzo: current or past employees of Quibim S.L.
Figures


References
Publication types
MeSH terms
LinkOut - more resources
Full Text Sources
Medical

