. 2023 Jun 13;56(6):1220-1238.e7.
doi: 10.1016/j.immuni.2023.04.002. Epub 2023 May 1.

M cell maturation and cDC activation determine the onset of adaptive immune priming in the neonatal Peyer's patch

Affiliations

M cell maturation and cDC activation determine the onset of adaptive immune priming in the neonatal Peyer's patch

Natalia Torow et al. Immunity. .

Abstract

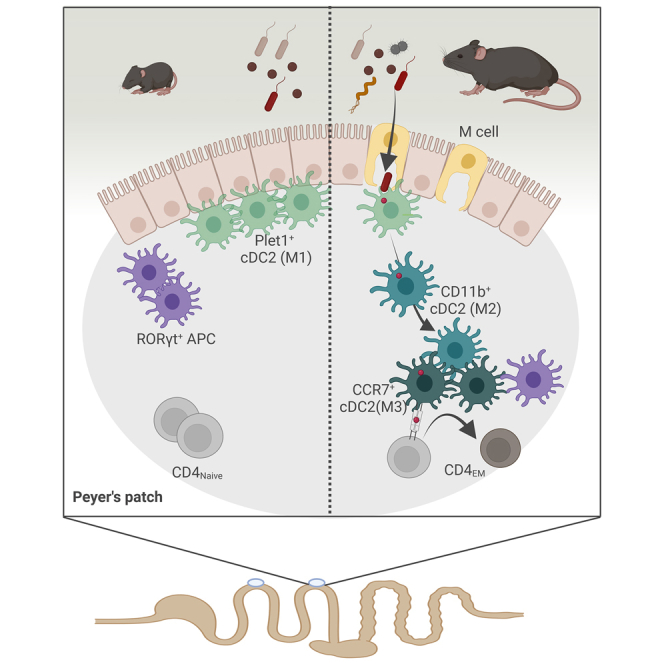
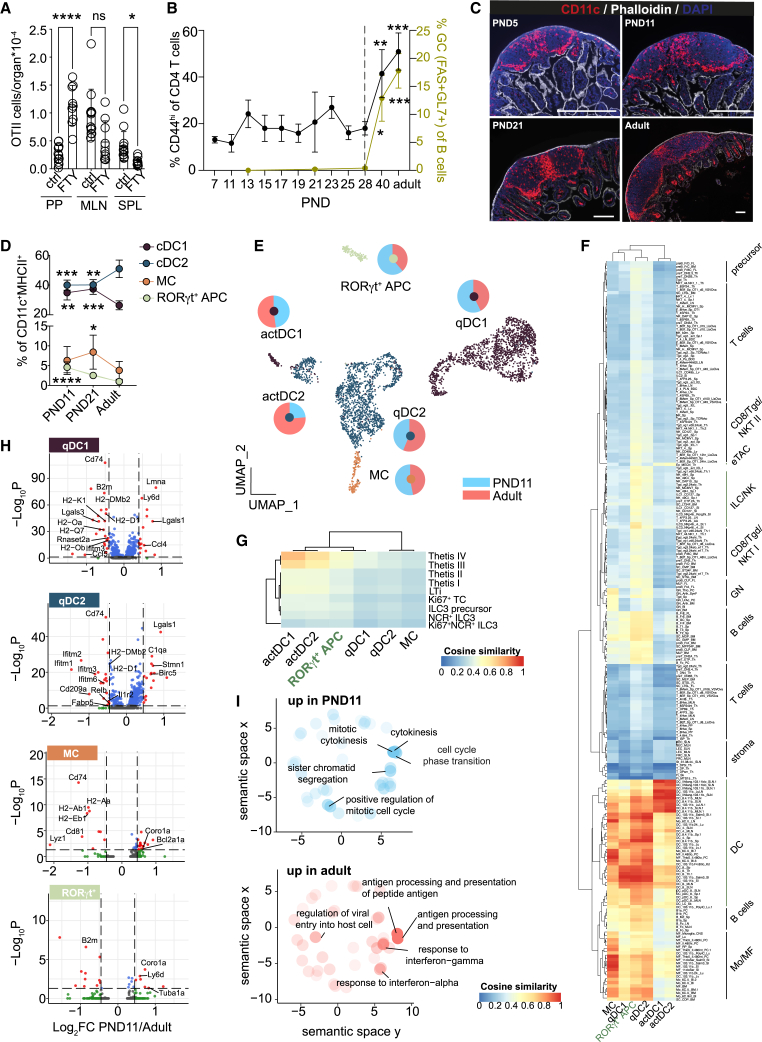
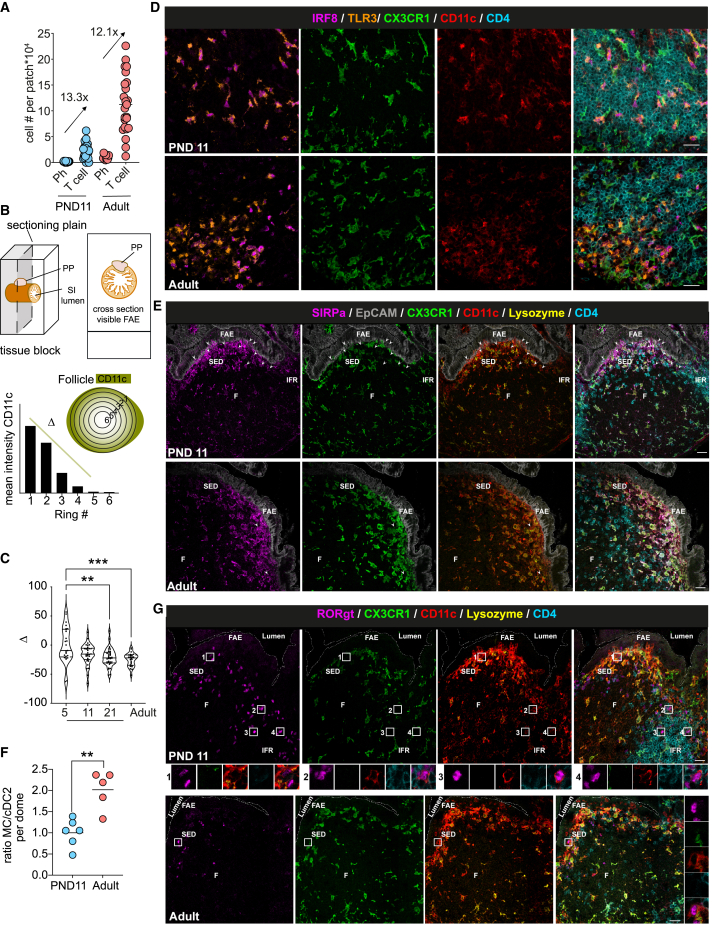
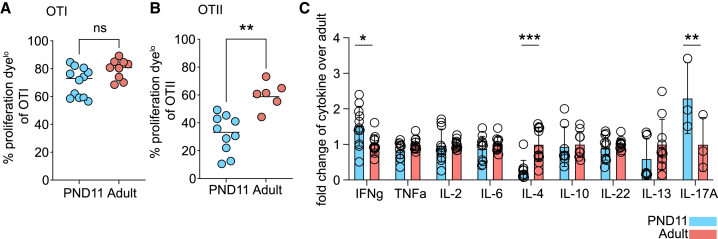
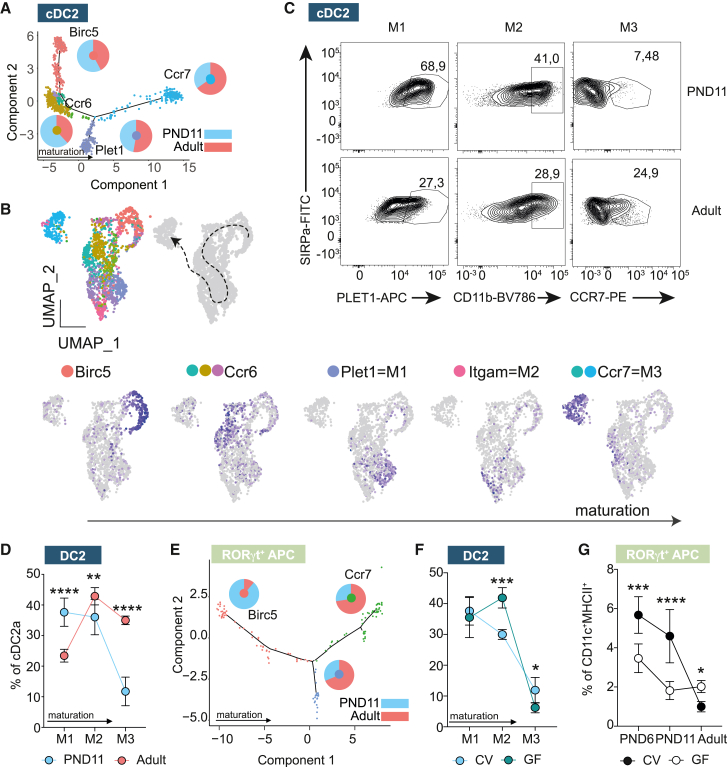
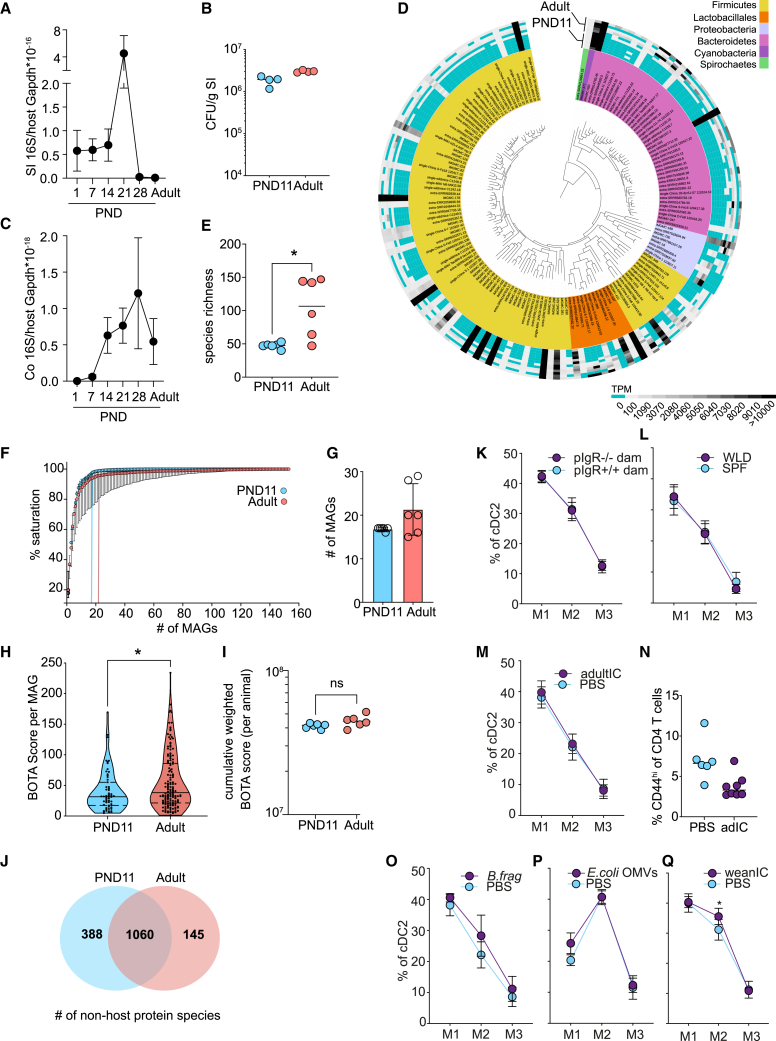
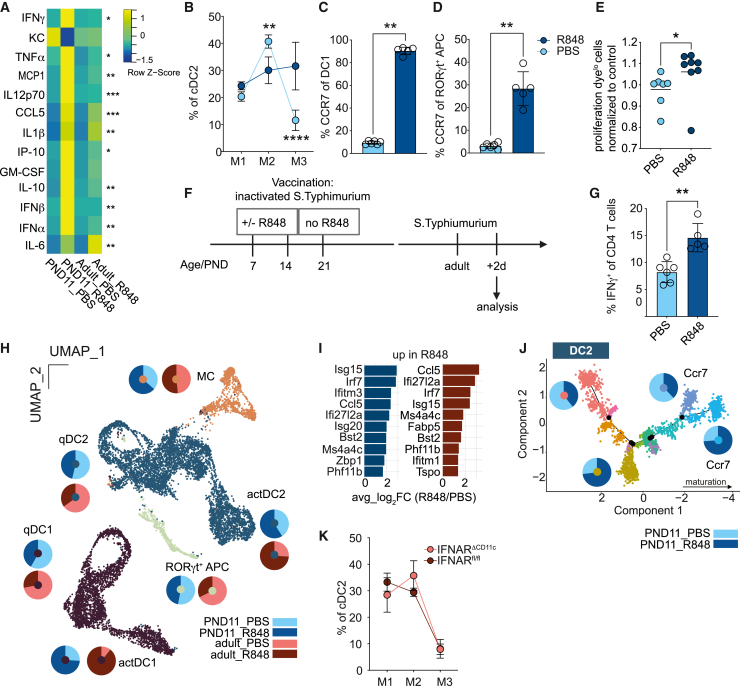
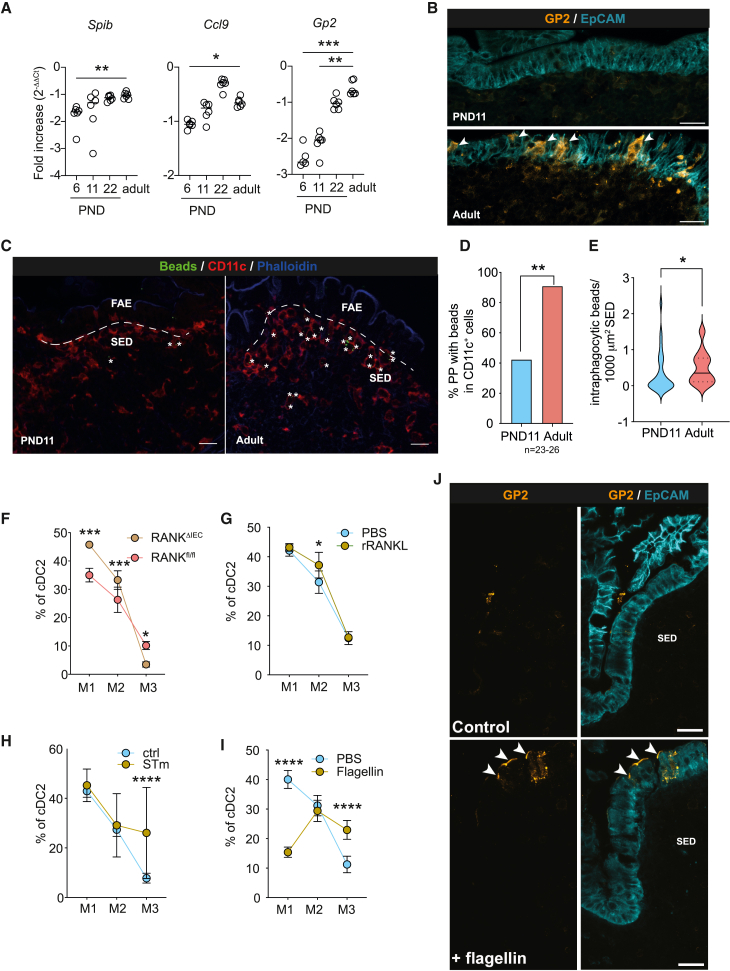
Early-life immune development is critical to long-term host health. However, the mechanisms that determine the pace of postnatal immune maturation are not fully resolved. Here, we analyzed mononuclear phagocytes (MNPs) in small intestinal Peyer's patches (PPs), the primary inductive site of intestinal immunity. Conventional type 1 and 2 dendritic cells (cDC1 and cDC2) and RORgt+ antigen-presenting cells (RORgt+ APC) exhibited significant age-dependent changes in subset composition, tissue distribution, and reduced cell maturation, subsequently resulting in a lack in CD4+ T cell priming during the postnatal period. Microbial cues contributed but could not fully explain the discrepancies in MNP maturation. Type I interferon (IFN) accelerated MNP maturation but IFN signaling did not represent the physiological stimulus. Instead, follicle-associated epithelium (FAE) M cell differentiation was required and sufficient to drive postweaning PP MNP maturation. Together, our results highlight the role of FAE M cell differentiation and MNP maturation in postnatal immune development.

Keywords: M cell; Peyer's patch; RORgt(+) APC; cDC2; dendritic cell; microbiota; neonatal immunology; post-natal establishment of intestinal homeostasis.


Conflict of interest statement

Declaration of interests The authors declare no competing interests.

Figures

None
Graphical abstract
Figure 1
Figure 1
Neonatal PP MNPs exhibit diminished antimicrobial activity and reduced antigen processing and presentation capacity (A) OTII cell numbers (PP, Peyer’s patch; MLN, mesenteric lymph node; SPL, spleen) of PND10 mice administered with OVA ± FTY720 on PND 6–8 (n = 9–13, mean, one-way ANOVA/Kruskall-Wallis test). (B) Percentage of CD44hi of PP CD4+ T cells (left y axis, black line) and GC B cells of B cells (right y axis, yellow green line) (n = 4–20, mean + SD, one-way ANOVA/Kruskal-Wallis test). (C) Representative immunofluorescent images of PP stained for CD11c (red), phalloidin (white), DAPI (blue); scale bars, 200 μm. (D) Percentage of PP MNP subsets (cDC1 = XCR1+SIRPαMHCII+CD11c+, cDC2 = SIRPα+/hiBST2XCR1MHCII+CD11c+, Rorγt+ APC = RORγt+SIRPαloXCR1MHCII+CD11c+, MC = BST2+SIRPα+XCR1MHCII+CD11c+) quantified by FACS (n = 5–12, mean + SD; one-way ANOVA/Kruskall-Wallis test). (E) scRNA-seq of PP MNP (n = 2; pooled from PP from 1 L or 3 adult animals per sample). Pie charts depict relative contribution of PND11 and adult cells within the indicated subset. (F and G) Pseudobulk profile comparison of scRNA-seq clusters from (D) against (F) all ImmGen gene expression profiles and (G) scRNA-seq of RORγt+MHCII+ cells from Akagbosu et al. using a cosine similarity metric. (H) DE genes in CCR7 qDC1, CCR7 qDC2, MC, and RORγt+ APC between PND11 and adult mice. (I) GO terms overrepresented in qDC2 of PND11 (upper panel, blue circles) or adult (lower panel, red circles). Top 5 GO terms are labeled. See also Figure S1.
Figure 2
Figure 2
Anatomical distribution of MNPs in neonatal and adult PP (A) FACS quantification of CD4+ T cells and phagocytic cells in PP. Ratio of mean T cell:phagocyte is indicated. (B) Sample preparation and signal distribution model of CD11c using radial segmentation of the PP to obtain Δ. (C) Δ calculated in individual PP (n = 25–36 follicles, Kruskall-Wallis test). (D, E, and G) Representative spectral confocal imaging projection of PP illustrating anatomical distribution of (D) TLR3+IRF8+CD11c+CX3CR1 cDC1 (TLR3, orange; IRF8, magenta; GFP, green; CD11c, red; CD4, blue [only TLR3+ IRF8+ cells represent cDC1]), (E) SIRPα+CD11c+CX3CR1lysozyme cDC2 (SIRPα, magenta; EpCAM, gray; GFP, green; CD11c, red; lysozyme, yellow; CD4, blue [arrowheads point toward cDC2 in the SED]) and (G) RORγt+CD11c+CX3CR1CD4 APC (RORγt, magenta; GFP, green; CD11c, red; lysozyme, yellow; CD4, blue [boxed areas of individual RORγt+APC shown below]). Scale bars, 20 μm. (F) Ratio between SIRPα+CX3CR1+Lysozyme+CD11c+ MC and SIRPα+CX3CR1lysozymeCD11c+ cDC2 in SED shown in (E). (n = 5–6, median, Mann-Whitney U test.) Each dot represents one animal (A) or one follicle (C and G). See also Figure S2.
Figure 3
Figure 3
Altered T cell priming by neonatal PP MNPs (A and B) Proliferation of transferred (A) OTI and (B) OTII cells in PP 48 h after oral OVA (n = 3–11, mean, Mann-Whitney U test). (C) T helper cytokine levels in the supernatant of OTII and PP MNP co-cultures in presence of OVA (n = 3–11, mean + SD, two-way ANOVA/Sidak’s multiple comparison test). See also Figure S3.
Figure 4
Figure 4
Maturation delay of PP cDC subsets during the post-natal period (A) cDC2 pseudotime trajectory; pie charts indicate relative contribution of adult and PND11 cells to specific branch; genes indicate marker genes in and color code is consistent with (B). (B) Seurat subclusters contributing to cDC2 (upper left, subclustered from Figure 1E), proposed maturation trajectory (upper right) and marker genes for maturational stages of cDC2 (bottom). (C) Representative FACS plots of PP cDC2 showing the expression of PLET1, CD11b, and CCR7 for maturational stages M1, M2, and M3, respectively. (D) Percentage of M1–M3 cDC2 (n = 8–10, mean + SD, two-way ANOVA/Bonferroni test between age groups within the same maturational stage). (E) RORgt+ APC pseudotime trajectory; pie charts indicate relative contribution of adult and PND11 cells to specific branches. (F) Percentage of M1–M3 of cDC2 in PND11 germ-free (GF) vs. conventional (CV) animals (n = 4–12, mean + SD; two-way ANOVA/Bonferroni test, statistical significance between colonization groups within the same maturational stage) determined by FACS. (G) Percentage of RORgt+APC in germ-free (GF) vs. conventional (CV) animals (n = 4–11, mean + SD, one-way ANOVA/Kruskall-Wallis test, statistical significance indicated within the same age group). See also Figure S4.
Figure 5
Figure 5
Rapid establishment of a dense and immunogenic small intestinal core microbiome in absence of adaptive immune maturation (A) Bacterial density determined by quantitative 16S rRNA gene qRCR normalized to murine Gapdh in total small intestinal (SI) tissue (n = 5, mean + SD, Kruskall-Wallis/Dunn’s multiple comparison to adult). (B) Anaerobic culture of homogenized small intestinal tissue (n = 4, mean, Mann-Whitney U test). (C) Bacterial density determined by quantitative 16S rDNA quantitative real-time PCR normalized to murine Gapdh in total colonic tissue (n = 5, mean + SD, Kruskall-Wallis/Dunn’s multiple comparison to adult). (D) Phylogenetic placement, phylum assignment (inner circle), and relative abundance (outer circle) of metagenome-assembled genomes (MAGs) in the SI luminal content by shotgun sequencing. (E) Molecular species richness determined in (D) (n = 6, mean, Mann-Whitney U test). (F) Saturation plot depicting number of MAGs required to cover most of the functional potential (n = 6, median + SD). Knee points indicated with vertical lines. (G) Knee points of the individual saturation curves indicated in (F) (n = 6, mean + SD, Mann-Whitney U test). (H) BOTA scores of all MAGs from (D) (nPND11 = 59, nAdult = 149 MAGs, violin plot, Mann-Whitney U test). (I) Cumulative abundance-weighted BOTA scores from (D) (n = 6, mean, Mann-Whitney-U test). (J) Venn diagram of non-host-derived protein species identified by mass spectrometry in small intestinal luminal material (n = 6). (K and L) Percentage of M1–M3 of cDC2 in PND11 (K) pIgR+/− offspring born to pIgR−/− dams or pIgR+/+ offspring born to pIgR+/+ dams (n = 4–5) and (L) wildling (WLD) animals (n = 11–12), (mean + SD; two-way ANOVA/Bonferroni test between genetic groups within the same maturational stage) determined by FACS. (M) Percentage of M1–M3 of cDC2 in PND12 mice after oral administration of adult intestinal content (adultIC) on PND9-11 (n = 5), (mean + SD; two-way ANOVA/Bonferroni test between treatment groups within the same maturational stage). (N) Percentage of CD44hi cells among total PP CD4+ T cells in 14-day-old mice after oral administration of adult intestinal content (adultIC) on PND1-9 (n = 6–8; median). (O–Q) Percentage of M1–M3 of cDC2 in PND12 mice that were administered (O) B. fragilis by oral gavage on PND9-11 (n = 5), (P) 8 h after E. coli OMVs oral gavage (n = 6–7), and (Q) weaning intestinal content (weanIC) by oral gavage on PND9-11 (n = 5–9) (mean + SD, two-way ANOVA/Bonferroni test between treatment groups within the same maturational stage). See also Figure S5 and Tables S1 and S2.
Figure 6
Figure 6
IFN I induces DC activation in neonatal PP and modifies the adaptive immune response (A) Heatmap of serum cytokines 8 h after R848 (n = 4–5; Kruskall-Wallis test, comparison within age group). (B) Percentage of M1–M3 of cDC2 in PND11 mice after R848 (n = 4–5), (mean + SD; two-way ANOVA/Bonferroni test between treatment groups within the same maturational stage) determined by FACS. (C and D) Percentage of CCR7+ among (C) cDC1 and (D) RORγt+ APC in PP after R848 in PND11 mice (mean + SD, Mann-Whitney U test). (E) Proliferation dye dilution in OTII cells in PP of neonatal mice 48 h after oral gavage of OVA ± R848 normalized to mean PBS (n = 7–8, mean, Mann-Whitney U test). (F) Neonatal PAA-STm/R848 vaccination experimental setup. (G) Percentage of IFNγ+ of CD4+ T cells in colonic LP of STm infected mice vaccinated with PAA STm ± R848 as neonates (n = 5–6, mean + SD, Mann-Whitney U test). (H) scRNA-seq of PP MNP (n = 1; cells pooled from 4 animals per sample). (I) Top 10 upregulated genes in PND11 (dark blue) and adult (berry) R848 vs. PBS qDC2. (J) Pseudotime trajectory of cDC2 from PND11 mice ± R848, pie charts represent the relative contribution of cells from PBS and R848 treated animals to indicated branches. (K) Percentage of M1–M3 of cDC2 in adult IFNARΔCD11c and IFNARfl/fl mice (n = 5), (mean + SD, two-way ANOVA and Bonferroni test between genetic groups within the same maturational stage) determined by FACS. See also Figures S6 and S7.
Figure 7
Figure 7
M cells are associated with PP DC maturation (A) Quantitative real-time PCR of Spib, Ccl9, and Gp2 from PP (n = 5–6, mean, Brown, Forsyth, and Welch ANOVA). (B) Spectral confocal imaging projection representative of PP dome regions. Sections illustrate epithelial cells and M cells (right panels) using EpCAM (cyan) and GP2 (orange). Arrowheads point toward M cells in the FAE. Scale bars, 20 μm. (C) Immunofluorescence imaging representative of PND11 and adult PP after oral administration of 100-nm fluorescent beads stained for CD11c (red), phalloidin (blue), beads (green); asterisks indicate intraphagocytic beads in the SED. Scale bars, 20 μm. (D) Percentage of PP with beads in CD11c+ cells within the SED (n = 23–26 follicles from 4 animals, Fisher’s exact test). (E) Intraphagocytic beads normalized to SED area (n = 23–26 follicles, Mann-Whitney U test). (F–I) Percentage of M1–M3 of cDC2 in (F) adult RANKΔIEC or RANKfl/fl (n = 4–9) or PND12 mice (G) after RANKL administration (n = 3–6) or (H) S. Typhimurium infection (n = 4–12) or (I) or flagellin administration (n = 4–9); (mean + SD, two-way ANOVA/Bonferroni test between genetic or treatment groups within the same maturational stage) determined by FACS. (J) Spectral confocal imaging projection representative of dome regions of PP illustrating M cells stained for CCL9 (green) and GP2 (orange) (left and mid panels) as well as SED myeloid cells stained for SIRPa (red) and epithelial cells using EpCAM (cyan) (right panels) arrowheads point toward M cells in FAE. Scale bars, 20 μm.

References

    1. Herzenberg L.A., Herzenberg L.A. Toward a layered immune system. Cell. 1989;59:953–954. doi: 10.1016/0092-8674(89)90748-4. - DOI - PubMed
    1. Hornef M.W., Torow N. 'Layered immunity' and the 'neonatal window of opportunity' - timed succession of non-redundant phases to establish mucosal host-microbial homeostasis after birth. Immunology. 2020;159:15–25. doi: 10.1111/imm.13149. - DOI - PMC - PubMed
    1. Abdel-Gadir A., Stephen-Victor E., Gerber G.K., Noval Rivas M., Wang S., Harb H., Wang L., Li N., Crestani E., Spielman S., et al. Microbiota therapy acts via a regulatory T cell MyD88/RORgammat pathway to suppress food allergy. Nat. Med. 2019;25:1164–1174. doi: 10.1038/s41591-019-0461-z. - DOI - PMC - PubMed
    1. Cahenzli J., Köller Y., Wyss M., Geuking M.B., McCoy K.D. Intestinal microbial diversity during early-life colonization shapes long-term IgE levels. Cell Host Microbe. 2013;14:559–570. doi: 10.1016/j.chom.2013.10.004. - DOI - PMC - PubMed
    1. Lynn M.A., Tumes D.J., Choo J.M., Sribnaia A., Blake S.J., Leong L.E.X., Young G.P., Marshall H.S., Wesselingh S.L., Rogers G.B., et al. Early-life antibiotic-driven dysbiosis leads to dysregulated vaccine immune responses in mice. Cell Host Microbe. 2018;23:653–660.e5. doi: 10.1016/j.chom.2018.04.009. - DOI - PubMed

Publication types