. 2023 May 2;14(1):2501.
doi: 10.1038/s41467-023-38248-4.

Gut microbiome dysbiosis across early Parkinson's disease, REM sleep behavior disorder and their first-degree relatives

Affiliations

Gut microbiome dysbiosis across early Parkinson's disease, REM sleep behavior disorder and their first-degree relatives

Bei Huang et al. Nat Commun. .

Abstract

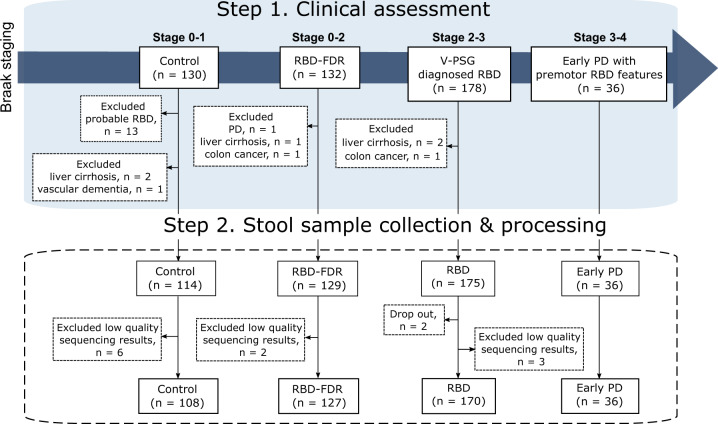
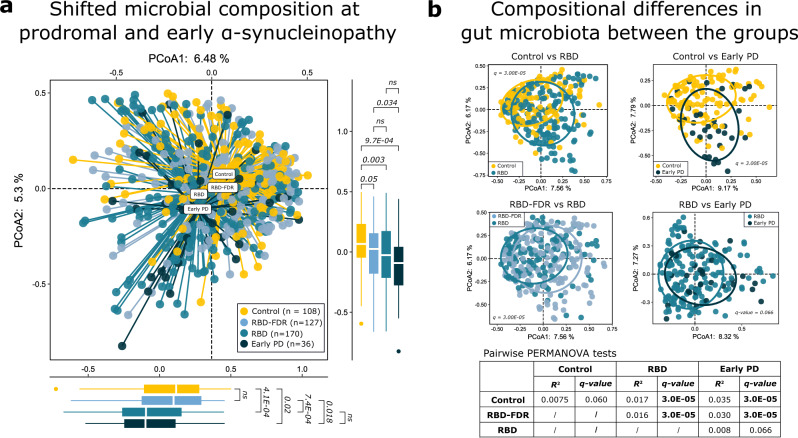
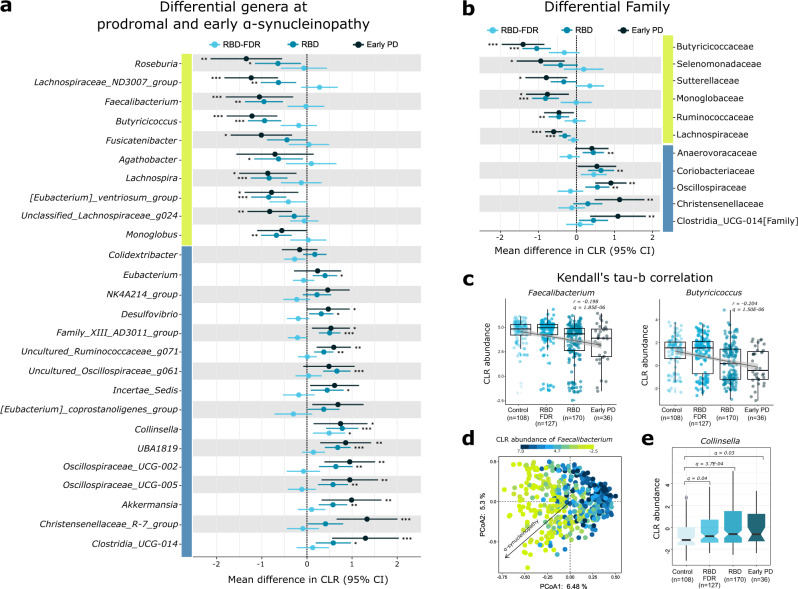
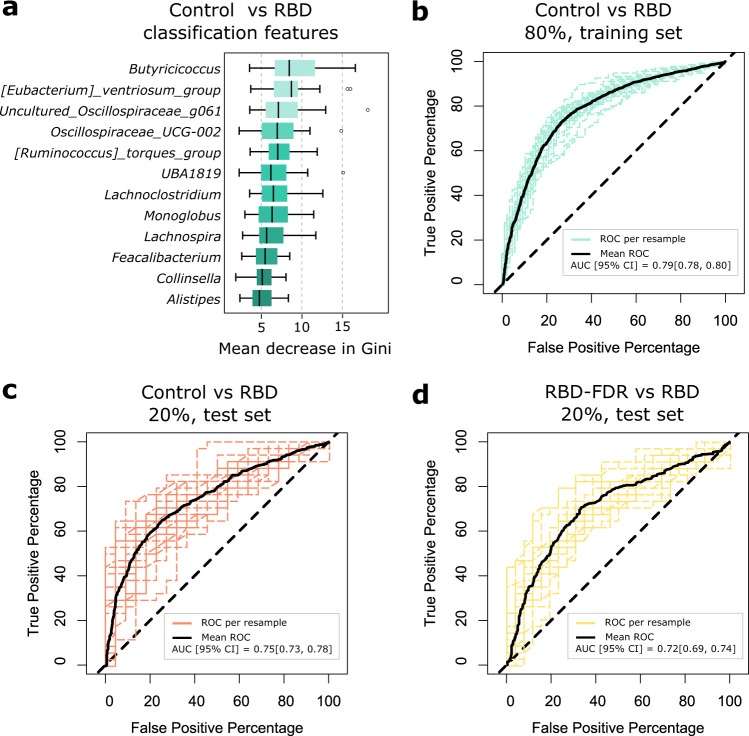
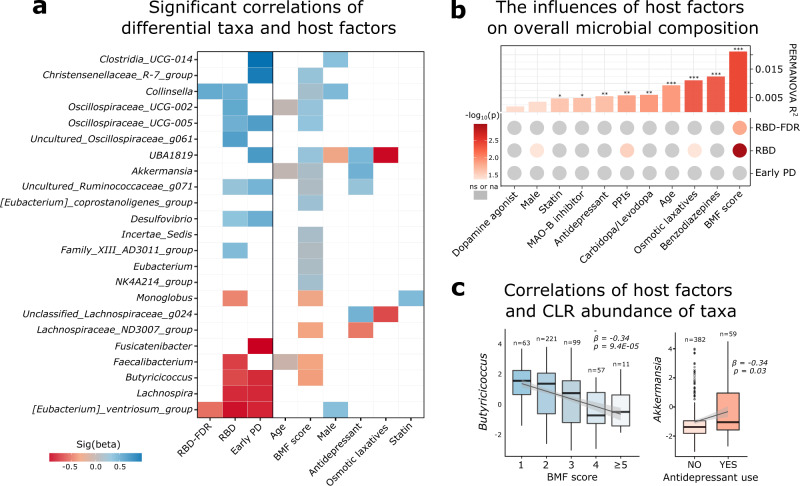
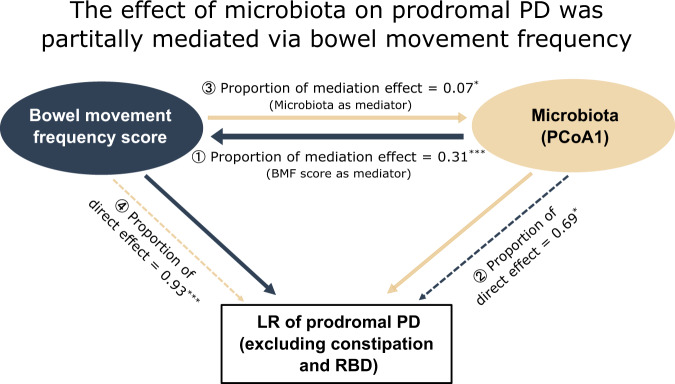
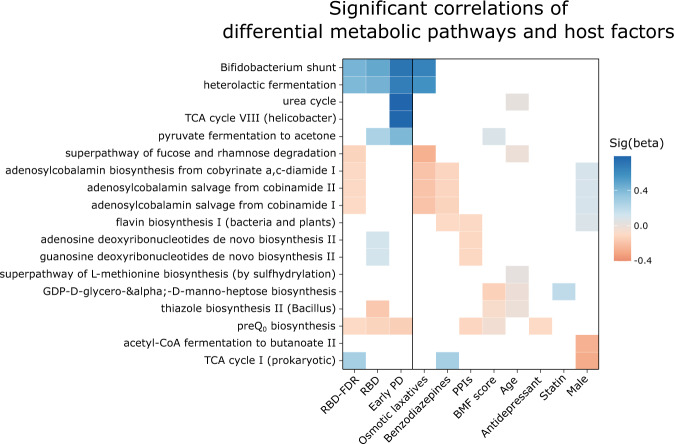
The microbiota-gut-brain axis has been suggested to play an important role in Parkinson's disease (PD). Here we performed a cross-sectional study to profile gut microbiota across early PD, REM sleep behavior disorder (RBD), first-degree relatives of RBD (RBD-FDR), and healthy controls, which could reflect the gut-brain staging model of PD. We show gut microbiota compositions are significantly altered in early PD and RBD compared with control and RBD-FDR. Depletion of butyrate-producing bacteria and enrichment of pro-inflammatory Collinsella have already emerged in RBD and RBD-FDR after controlling potential confounders including antidepressants, osmotic laxatives, and bowel movement frequency. Random forest modelling identifies 12 microbial markers that are effective to distinguish RBD from control. These findings suggest that PD-like gut dysbiosis occurs at the prodromal stages of PD when RBD develops and starts to emerge in the younger RBD-FDR subjects. The study will have etiological and diagnostic implications.


Conflict of interest statement

Y.K.W. received personal fees from Eisai Co., Ltd for lecture, travel support from Lundbeck HK Limited and J.W.Y.C. received personal fees for joining an expert panel meeting of Eisai Co., Ltd., which are outside the submitted work. The Chinese University of Hong Kong has filed a U.S. provisional patent (application no. 63/446,304, filed on February 16, 2023) relating to the use of microbial markers for the early detection of prodromal PD (RBD and RBD-FDR), on which Y.K.W., H.M.L., B.H., P.K.S.C., V.C.T.M., and F.K.L.C. are inventors. B.H. and J.W. were supported by the Faculty Postdoctoral Fellowship Scheme, Faculty of Medicine, CUHK. The remaining authors declare no competing interests.

Figures

Fig. 1
Fig. 1. Flowchart of subject selection and recruitment.
We recruited subjects according to the proposed staging model of α-synucleinopathy, which aptly represented the pathological staging of Parkinson’s disease (i.e., Braak staging). Four different clinical stages were controls (Braak stage 0–1), RBD-FDR (stage 0–2), patients with RBD (stage 2–3) and early PD (stage 3–4). Early PD refers to patients who had clinically confirmed PD with motor symptoms onset less than 5 years. Control subjects with probable RBD as diagnosed by using structured clinical interview were excluded. Besides, subjects with neurodegenerative diseases (except early PD group) and severe gastrointestinal diseases were excluded from this study. In the end, a total of 452 subjects successfully collected stool samples, while 11 of them were removed for subsequent analysis due to the low quality of sequencing data (i.e., total read count <1000). RBD REM sleep behavior disorder, RBD-FDR first-degree relatives of patients with RBD, PD Parkinson’s disease.
Fig. 2
Fig. 2. Shifted microbial composition across the prodromal and early stages of α-synucleinopathy.
a Principal coordinates analysis (PCoA) of microbial communities across control (n = 108), RBD-FDR (n = 127), RBD (n = 170), and early PD (n = 36) based on Bray–Curtis distance matrix at the genus level. The label of each group indicates group centroid. Boxplots along the axes of PCoA showed the distributions of PCoA1 and PCoA2 between groups. The white line in the box represented median values, while the lower and upper boundaries represented the first and third quartiles, respectively; whiskers extend up to values within 1.5 times of the interquartile range; outliers are plotted as individual points beyond the whiskers. Statistical differences were analyzed using ANOVA (two-sided test) with post hoc test. P values for multiple testing were adjusted by applying Benjamini–Hochberg method. b Principal coordinates analysis of microbial communities between groups with 70% confidence ellipse. The significance of inter-group differences in overall microbial composition was calculated by PERMANOVA with adjustment of age and sex (permutation = 99,999, two-sided test, based on Bray–Curtis distance matrix at the genus level). R2 indicated the inter-individual variation explained by grouping factors in PERMANOVA test, and P values for pairwise comparisons were adjusted by applying Benjamini–Hochberg method. RBD REM sleep behavior disorder, RBD-FDR first-degree relatives of patients with RBD, PD Parkinson’s disease, PERMANOVA permutational multivariate analysis of variance, ns not significant. Source data are provided as a Source Data file.
Fig. 3
Fig. 3. Differential gut microbes at the prodromal and early stages of α-synucleinopathy.
a, b Error bar plot demonstrated mean difference of CLR-transformed abundance of taxa at prodromal and early α-synucleinopathy as compared with control, and 95% confidence interval of the mean difference. The blue and yellow bars along the vertical axis of the plot indicated taxa increased and decreased with disease progression (Kendall’s τb > 0 and <0, respectively). The associations of differentially abundant taxa with the progression of α-synucleinopathy were analyzed using MaAsLin 2. The model was computed with group as fixed effect, family clustering as random effects. “***”, “**”, and “*” represented Benjamini–Hochberg method adjusted P values (q value) less than 0.001, 0.01, and 0.05, respectively. At family level, only taxa that significantly changed at prodromal and early α-synucleinopathy was presented, see also Supplementary Fig. 4 and Dataset 8. c Kendall’s tau-b correlation analysis showed that Butyricicoccus and Faecalibacterium had strongest correlations with the progression of α-synucleinopathy. Individual data points were shown with the boxplot covers the interquartile interval of the data; median of the data was shown as a thick line in the middle of the box; whiskers extend up to values within 1.5 times of interquartile range. d Genus Faecalibacterium best explained the variation of first principal component from the principal coordinates analysis of whole genera. Black arrow indicated the influence of disease progression (i.e., from control, RBD-FDR, RBD to early PD). e Genus Collinsella was progressively increased from control (n = 108), RBD-FDR (n = 127), RBD (n = 170) to early PD (n = 36) in MaAsLin 2 (two-sided test, see also Supplementary Dataset 8). The notched boxplot panel showed CLR-transformed abundance. The thick line in box represented median values, while the lower and upper boundaries represented the first and third quartiles, respectively; whiskers extend up to values within 1.5 times of the interquartile range; outliers are plotted as individual points beyond the whiskers. MaAsLin 2 Microbiome Multivariable Associations with Linear Model, CLR centered log ratio, RBD REM sleep behavior disorder, RBD-FDR first-degree relatives of patients with RBD, PD Parkinson’s disease. Source data are provided as a Source Data file.
Fig. 4
Fig. 4. Random Forest model predicting RBD status.
a Feature selection was based on the recursive feature elimination (RFE) algorithm, and microbial markers appeared in at least 60% of all 25 final trained models (classifying RBD [n = 170] and control [n = 108]) were considered as classification features.Thick line in box represents the median values, while the lower and upper boundaries represent the first and third quartiles, respectively; whiskers extend up to values within 1.5 times of interquartile range; outliers are plotted as individual points beyond the whiskers. bd The receiver operating characteristic curves and mean AUC (with 95% confidence intervals) of random forest classification models. Dashed curves represented the results from 25 repeats of the whole process of random forest-RFE (i.e., 25 resamples), with bold curves showing the mean performance. RBD REM sleep behavior disorder, ROC operating characteristic curve, AUC area under the ROC curve. Source data are provided as a Source Data file.
Fig. 5
Fig. 5. Host–microbiome interactions at prodromal and early α-synucleinopathy.
a The associations between taxa abundance and host factors were assessed by using MaAsLin 2. Only significant results were shown in the heatmap (Benjamini–Hochberg adjusted P values <0.25). For detailed descriptions and results of MaAsLin 2, see Supplementary Dataset 10. b Interactions of overall microbial composition and host factors. Boxplot displayed the inter-individual variation explained by each host factor in whole samples by using PERMANOVA test (i.e., PERMANOVA R2, permutations = 99,999). “***”, “**”, and “*” represented Benjamini–Hochberg adjusted P values <0.001, <0.01, and <0.05, respectively. Heatmap showed the stage-specific (i.e., each stage versus control) impact of host factors. All significant associations were highlighted with red color (q value <0.05 from the PERMANOVA model). See also Supplementary Dataset 4. c MaAsLin 2 test revealed significant correlations between BMF score and short-chain fatty acids-producing bacteria Butyricicoccus, as well as the co-occurrence of antidepressant use and RBD/early PD-enriched genera Akkermansia. Beta and P value (without Benjamini–Hochberg adjustment) were derived from MaAsLin 2 (two-sided test, see also Supplementary Dataset 10). The thick line in box represents the median values, while the lower and upper boundaries represent the first and third quartiles, respectively; whiskers extend up to values within 1.5 times of the interquartile range; outliers are plotted as individual points beyond the whiskers. RBD REM sleep behavior disorder, RBD-FDR first-degree relatives of patients with RBD, PD Parkinson’s disease, PERMANOVA permutational multivariate analysis of variance, BMF bowel movement frequency, PPIs proton pump inhibitors, CLR centered log ratio, MaAsLin 2 Microbiome multivariable associations with linear model, ns not significant, na not applicable. Source data are provided as a Source Data file.
Fig. 6
Fig. 6. Mediating effect of bowel movement frequency.
Generalized linear model mediation analyses were performed among control, RBD-FDR and RBD patients (n = 405), with microbiota (blue arrows) and BMF score (yellow arrows) as mediators, respectively. The proportion of mediation effect (①③, solid line) indicates the ratio of indirect effects (goes through the mediator) to the total effect, while direct effect (②④, dashed line) describes the proportion of exposure that directly affects the outcome after controlling for mediators. The significance of indirect/direct effects were assessed using bootstrapping procedures (two-sided test, P values were not adjusted). The effect of gut microbiota (exposure) on the likelihood ratio (LR) of prodromal PD (outcome) was partially mediated via bowel movement frequency (mediator) (proportion of mediation effect = 0.31, P = 0.0004). “***”, “**”, and “*” represented a P value less than 0.001, 0.01, and 0.05, respectively. RBD REM sleep behavior disorder, RBD-FDR first-degree relatives of patients with RBD, PD Parkinson’s disease, BMF bowel movement frequency, PCoA1 first principal component from the principal coordinates analysis, LR likelihood ratio. Source data are provided as a Source Data file.
Fig. 7
Fig. 7. Changes of microbiota metabolism at prodromal and early α-synucleinopathy.
The associations between pathway abundance and host factors were assessed by using MaAsLin 2. Only significant results were shown in the heatmap (Benjamini–Hochberg adjusted P values <0.25). Pathways related to short-chain fatty acids metabolism (e.g., Bifidobacterium shunt and heterolactic fermentation) and preQ0 biosynthesis were consistently increased and decreased at prodromal and early stages of α-synucleinopathy even after adjusting all potential covariates, respectively. For detailed descriptions and results of MaAsLin 2, see Supplementary Dataset 15. RBD REM sleep behavior disorder, RBD-FDR first-degree relatives of patients with RBD, PD Parkinson’s disease, MaAsLin 2 Microbiome multivariable associations with linear model, TCA tricarboxylic acid. Source data are provided as a Source Data file.

References

    1. Spillantini MG, et al. α-Synuclein in Lewy bodies. Nature. 1997;388:839–840. doi: 10.1038/42166. - DOI - PubMed
    1. Braak H, et al. Staging of brain pathology related to sporadic Parkinson’s disease. Neurobiol. Aging. 2003;24:197–211. doi: 10.1016/S0197-4580(02)00065-9. - DOI - PubMed
    1. Stokholm MG, Danielsen EH, Hamilton-Dutoit SJ, Borghammer P. Pathological α-synuclein in gastrointestinal tissues from prodromal Parkinson disease patients. Ann. Neurol. 2016;79:940–949. doi: 10.1002/ana.24648. - DOI - PubMed
    1. Sprenger FS, et al. Enteric nervous system alpha-synuclein immunoreactivity in idiopathic REM sleep behavior disorder. Neurology. 2015;85:1761–1768. doi: 10.1212/WNL.0000000000002126. - DOI - PMC - PubMed
    1. Hawkes CH, Del Tredici K, Braak H. Parkinson’s disease: a dual-hit hypothesis. Neuropathol. Appl. Neurobiol. 2007;33:599–614. doi: 10.1111/j.1365-2990.2007.00874.x. - DOI - PMC - PubMed

Publication types

MeSH terms