. 2023 May 2;18(1):29.
doi: 10.1186/s13024-023-00621-8.

Mutations in α-synuclein, TDP-43 and tau prolong protein half-life through diminished degradation by lysosomal proteases

Affiliations

Mutations in α-synuclein, TDP-43 and tau prolong protein half-life through diminished degradation by lysosomal proteases

Paul J Sampognaro et al. Mol Neurodegener. .

Erratum in

Abstract

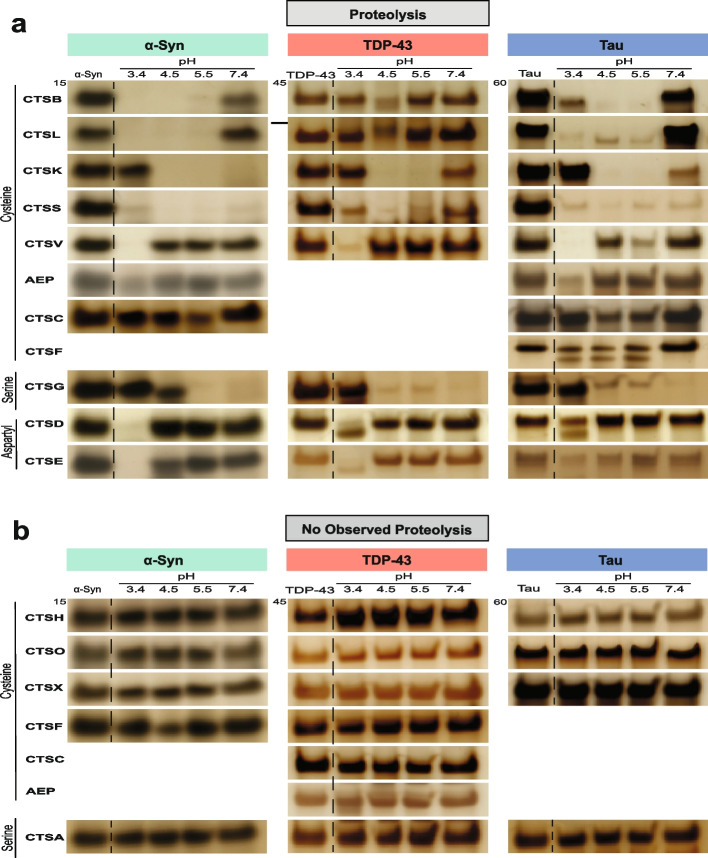
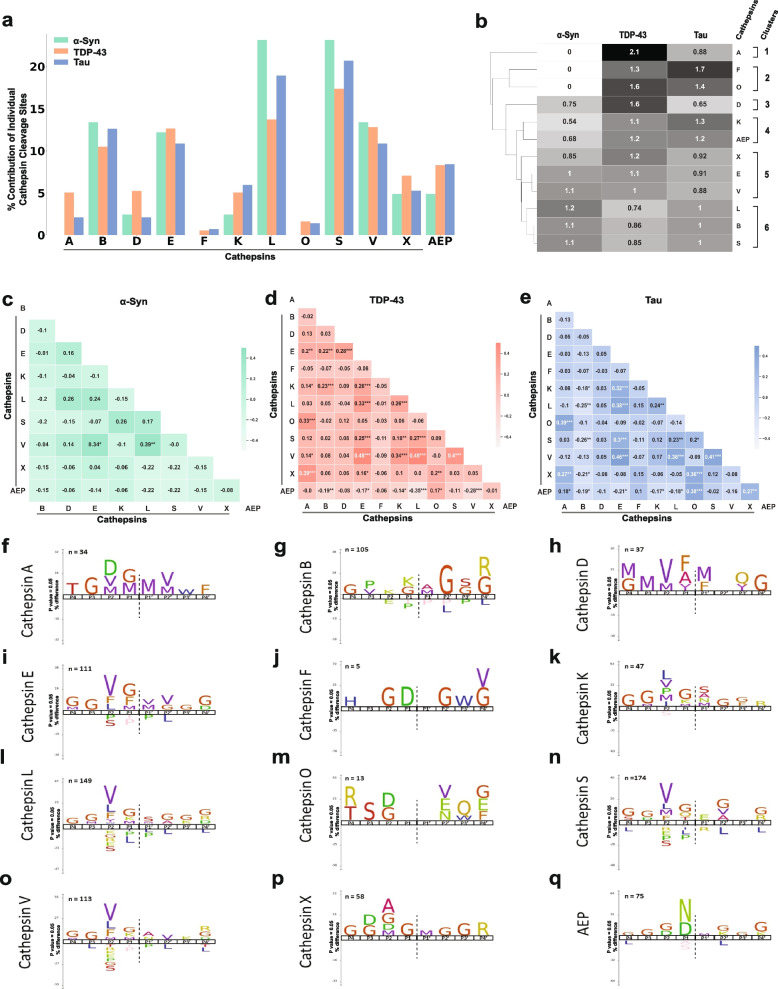
Background: Autosomal dominant mutations in α-synuclein, TDP-43 and tau are thought to predispose to neurodegeneration by enhancing protein aggregation. While a subset of α-synuclein, TDP-43 and tau mutations has been shown to increase the structural propensity of these proteins toward self-association, rates of aggregation are also highly dependent on protein steady state concentrations, which are in large part regulated by their rates of lysosomal degradation. Previous studies have shown that lysosomal proteases operate precisely and not indiscriminately, cleaving their substrates at very specific linear amino acid sequences. With this knowledge, we hypothesized that certain coding mutations in α-synuclein, TDP-43 and tau may lead to increased protein steady state concentrations and eventual aggregation by an alternative mechanism, that is, through disrupting lysosomal protease cleavage recognition motifs and subsequently conferring protease resistance to these proteins.

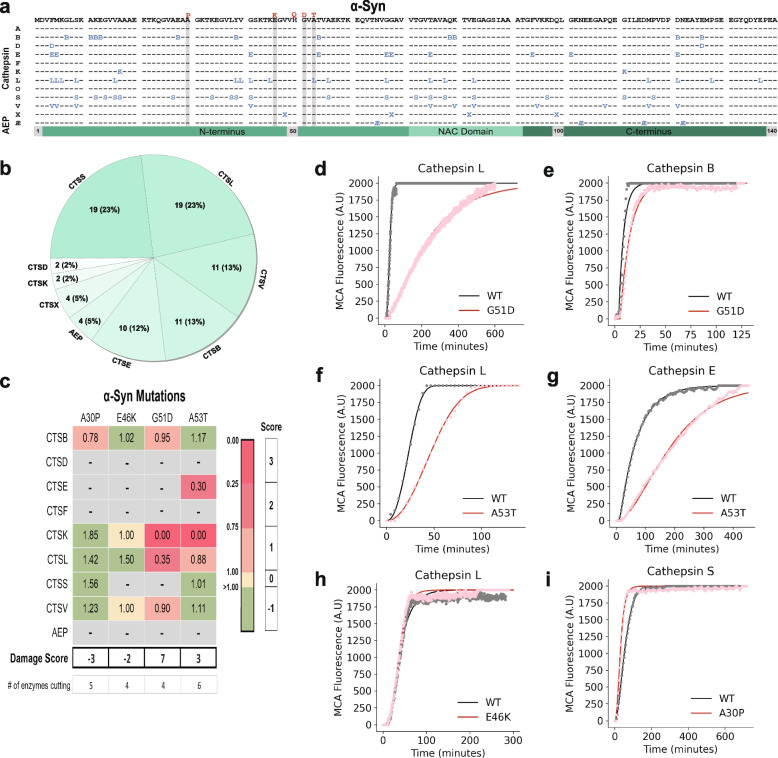
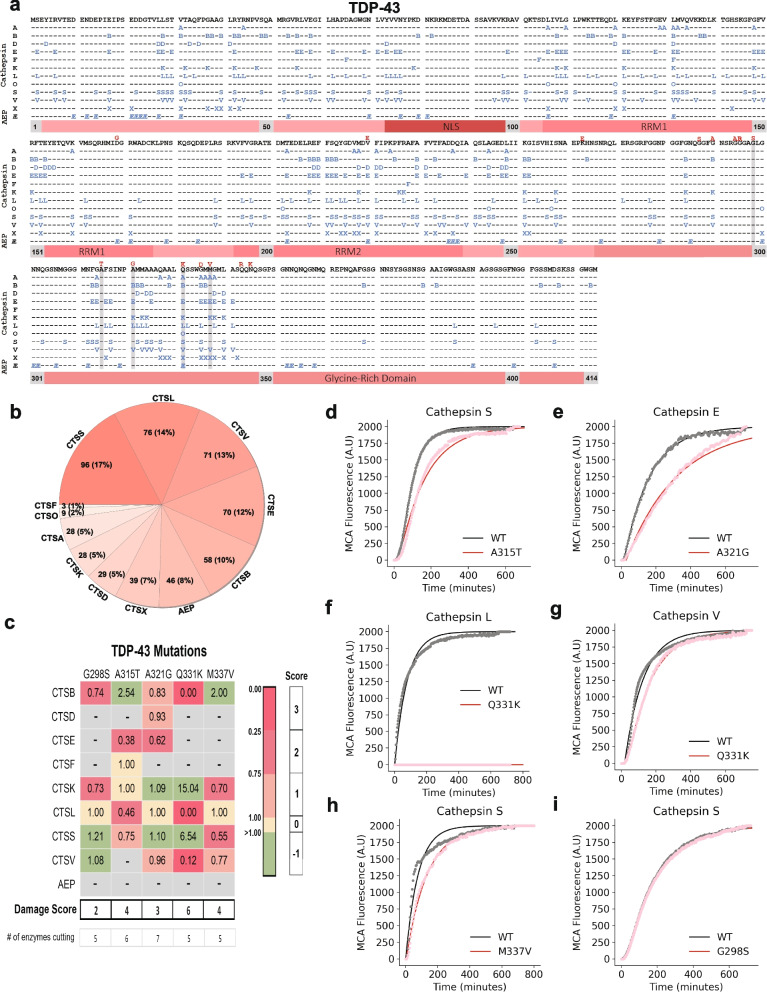
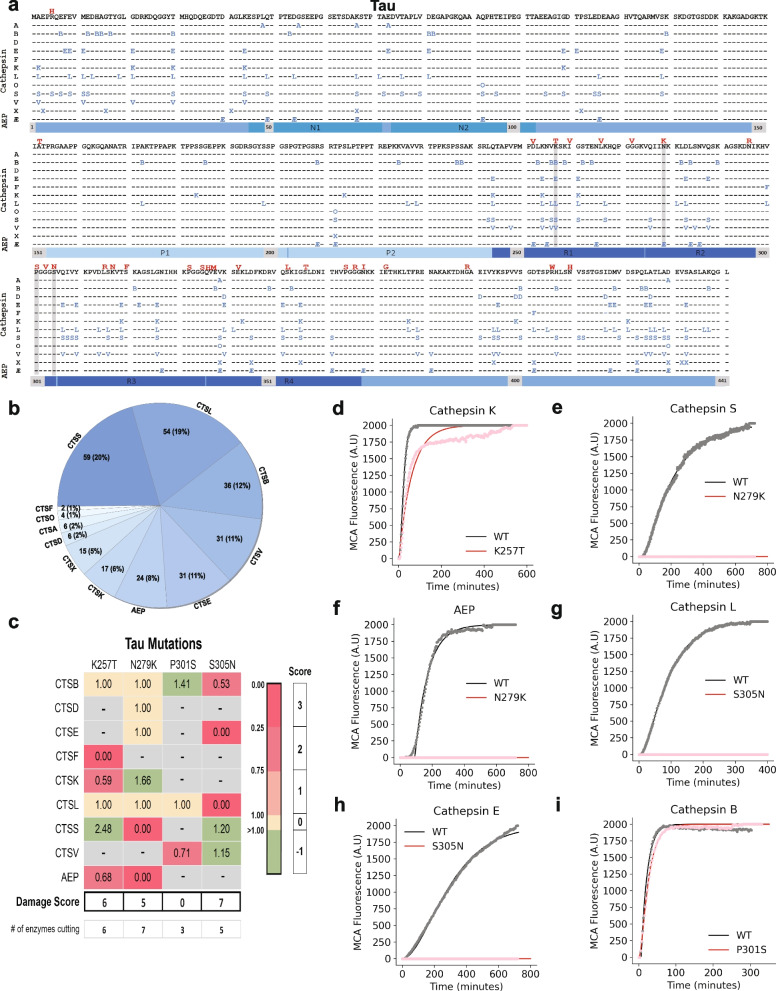
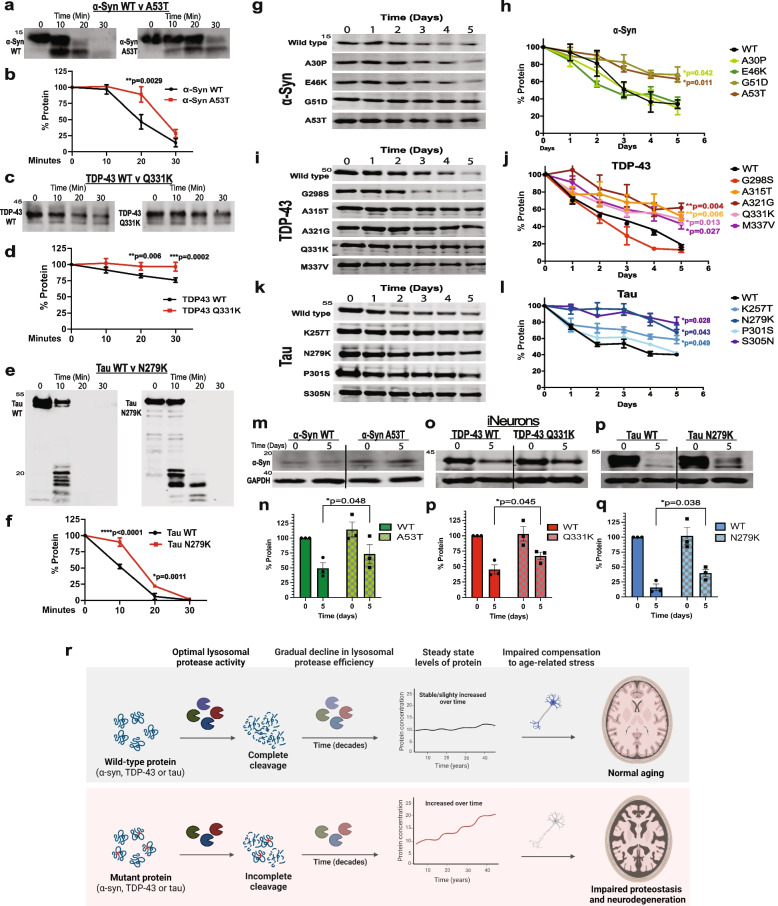
Results: To test this possibility, we first generated comprehensive proteolysis maps containing all of the potential lysosomal protease cleavage sites for α-synuclein, TDP-43 and tau. In silico analyses of these maps indicated that certain mutations would diminish cathepsin cleavage, a prediction we confirmed utilizing in vitro protease assays. We then validated these findings in cell models and induced neurons, demonstrating that mutant forms of α-synuclein, TDP-43 and tau are degraded less efficiently than wild type despite being imported into lysosomes at similar rates.

Conclusions: Together, this study provides evidence that pathogenic mutations in the N-terminal domain of α-synuclein (G51D, A53T), low complexity domain of TDP-43 (A315T, Q331K, M337V) and R1 and R2 domains of tau (K257T, N279K, S305N) directly impair their own lysosomal degradation, altering protein homeostasis and increasing cellular protein concentrations by extending the degradation half-lives of these proteins. These results also point to novel, shared, alternative mechanism by which different forms of neurodegeneration, including synucleinopathies, TDP-43 proteinopathies and tauopathies, may arise. Importantly, they also provide a roadmap for how the upregulation of particular lysosomal proteases could be targeted as potential therapeutics for human neurodegenerative disease.

Keywords: Autophagy; Cathepsin; Lysosome; Mutations; Neurodegeneration; Protease; TDP-43; Tau; α-synuclein.


Conflict of interest statement

A.W.K. and M.P.J. are Scientific Advisory Board members, and M.P.J. is a founder of Nine Square Therapeutics. C.S.C. is a founder, and G.M.K. is an employee of Alaunus Biosciences. Authors declare that they have no conflicts of interest or competing interests.

Figures

Fig. 1
Fig. 1
Lysosomal proteases digest α-syn, TDP-43 and tau in a selective fashion. Recombinant, human, full-length α-syn, TDP-43 or 2N4R tau (1 µg) were incubated with 1 µM lysosomal protease for 1 h at the indicated pH. Reactions were subjected to SDS-PAGE and gels visualized by silver stain. Gels are representative of n = 3 independent replicates. Protein and protease combinations are organized according to those in which the protease can cleave (a) or cannot cleave (b) the protein. Full-length gels are shown in Supplementary Data 1 and control reactions for those proteases that cannot cleave any of the substrates are shown in Figure S1
Fig. 2
Fig. 2
α-Syn proteolysis map and in vitro fluorescence protease assays. a A peptide library tiling across α-syn was incubated with individual lysosomal proteases (left). At various times and pHs, the reaction was subjected to MSP-MS to detect proteolytic cleavage sites in α-syn. The amino acid sequence of α-syn is in black letters at the top. Cleavage sites are indicated with the enzyme letter (e.g., B for CTSB) positioned at the P1 position (e.g. the B for CTSB is at amino acid position 7, so the cleavage occurs between positions 7 and 8). A total of 82 cleavages were found. Autosomal-dominant coding mutations associated with Parkinson’s Disease are noted in red above the α-syn sequence. Grey bars highlight amino acid mutations tested in in vitro fluorescent protease assays. b Pie chart demonstrating the number of cleavage sites within the α-syn sequence for each protease with the percentage of contributed cleavage sites in parentheses. c Table of maximal velocity (Vmax) ratios (mutant/WT), comparing protease cleavage of WT versus mutant α-syn peptides. A grey box denotes a mutation which was predicted to be "non-damaging." Mutations decreasing the Vmax of protease cleavage by 0–25% (1 point), 25–75% (2 points), and > 75% (3 points) are highlighted in light pink, dark pink, and dark red, respectively. Mutations augmenting the cleavage rate (-1 point) are highlighted in light green. Mutations with similar rate of cleavage compared to WT (0 points) are highlighted in yellow. Grey boxes denote no observed cleavage for either the WT or mutant peptide. Points were summed to derive a total “Damage Score”. d-i Representative curves of fluorescence generated from α-syn peptide cleavage, comparing WT and mutant peptides as labeled (n = 3 for all protease-substrate pairs). NAC, non-amyloid component domain; Æ, asparagine endopeptidase (AEP)
Fig. 3
Fig. 3
TDP-43 proteolysis map and in vitro fluorescence protease assays. a A peptide library tiling across TDP-43 was incubated with individual lysosomal proteases (left). At various times and pHs, the reaction was subjected to MSP-MS to detect proteolytic cleavage sites in TDP-43. The amino acid sequence of TDP-43 is in black letters at the top. Cleavage sites are indicated with the enzyme letter (e.g., B for CTSB) positioned at the P1 position (e.g. the B for CTSB is at amino acid position 17, so the cleavage occurs between positions 17 and 18). A total of 553 cleavages were found. Autosomal-dominant coding mutations associated with amyotrophic lateral sclerosis are noted in red above the TDP-43 sequence. Grey bars highlight amino acid mutations tested in in vitro fluorescent protease assays. b Pie chart demonstrating the number of cleavages sites within the TDP-43 sequence for each protease with the percentage of contributed cleavage sites in parentheses. c Table of maximal velocity (Vmax) ratios (mutant/WT), comparing protease cleavage of WT versus mutant TDP-43 peptides. A grey box denotes a mutation which was predicted to be "non-damaging." Mutations decreasing the Vmax of protease cleavage by 0–25% (1 point), 25–75% (2 points), and > 75% (3 points) are highlighted in light pink, dark pink, and dark red, respectively. Mutations augmenting the cleavage rate (-1 point) are highlighted in light green. Mutations with similar rate of cleavage compared to WT (0 points) are highlighted in yellow. Grey boxes denote no observed cleavage for either the WT or mutant peptide. Points were summed to derive a total “damage score”. d-i Representative curves of fluorescence generated from TDP-43 peptide cleavage, comparing WT and mutant peptides as labeled (n = 3 for all protease-substrate pairs). NLS, nuclear localization sequence; RRM1 and RRM2, RNA recognition motifs 1 and 2; Æ, asparagine endopeptidase (AEP)
Fig. 4
Fig. 4
Tau proteolysis map and in vitro fluorescence protease assays. a A peptide library tiling across tau was incubated with individual lysosomal proteases (left). At various times and pHs, the reaction was subjected to MSP-MS to detect proteolytic cleavage sites in tau. The amino acid sequence of tau is in black letters at the top. Cleavage sites are indicated with the enzyme letter (e.g., B for CTSB) positioned at the P1 position (e.g. the B for CTSB is at amino acid position 7, so the cleavage occurs between positions 7 and 8). A total of 285 cleavages were found. Autosomal-dominant coding mutations associated with frontotemporal dementia are noted in red above the tau sequence. Grey bars highlight amino acid mutations tested in in vitro fluorescent protease assays. b Pie chart demonstrating the number of cleavages sites within the tau sequence for each protease with the percentage of contributed cleavage sites in parentheses. c Table of maximal velocity (Vmax) ratios (mutant/WT), comparing protease cleavage of WT versus mutant tau peptides. A grey box denotes a mutation which was predicted to be "non-damaging." Mutations disrupting protease cleave by 0–25% (1 point), 25–75% (2 points), and > 75% (3 points) are highlighted in light pink, dark pink, and dark red, respectively. Mutations augmenting the rate cleavage (-1 point) are highlighted in light green. Mutations with similar rate of cleavage compared to WT (0 points) are highlighted in yellow. Grey boxes denote no observed cleavage for either the WT or mutant peptide. Points were summed to derive a total “damage score”. d-i Representative curves of fluorescence generated from tau peptide cleavage, comparing WT and mutant peptides as labeled (n = 3 for all protease-substrate pairs). N1 and N2, N-terminal repeats; P1 and P2, proline-rich regions, R1-4, microtubule binding repeats 1–4; Æ, asparagine endopeptidase (AEP)
Fig. 5
Fig. 5
Lysosomal proteases exhibit distinctive abilities to process α-syn, TDP-43 and tau. a Comparison of the number of cleavage sites within α-syn, TDP-43 and tau for each lysosomal protease relative to total number of cleavage sites. b Hierarchical clustering analysis demonstrating the relative affinity of proteases for α-syn, TDP-43 or tau. Clusters identified are designated to the right. c-e Pairwise correlation analyses with significance values (p-values) of unique versus redundant activity between lysosomal proteases for α-syn (C), TDP-43 (D) and tau (E). A positive score suggests more correlation and a negative score lower correlation between protease cleavage sites. f-q The iceLogo output for each of the serine (F), aspartyl (G-H) and cysteine (I-Q) proteases demonstrating the frequency of particular amino acids at the P4 – P4’ positions of each protease recognition motif within α-syn, TDP-43 and tau. Amino acids that were more frequently seen are above the horizontal axis and those that were less frequently seen are below the horizontal axis. The cleavage site is indicated with a vertical hatched line. *p < 0.05, **p < 0.01, or ***p < 0.001
Fig. 6
Fig. 6
Pathogenic mutations prolong α-syn, TDP-43 and tau half-life. a-f Recombinant, full-length WT or A53T α-syn (a, b), WT or Q331K TDP-43 (c, d), and WT or N279K tau (e, f) was incubated with 50 μg of human lysosome extract for 30 min. The reaction was subjected to Western blot and results quantified. g-l, Differentiated SH-SY5Y cells expressing inducible FLAG-tagged WT or mutant α-syn (g, h), TDP-43 (i, j) or tau (k, l) were treated with doxycycline for 24 h to induce protein expression. Doxycycline was removed (t = 0 days), MG132 (100 nm) was added to inhibit proteasomal degradation and lysates were collected at each time point as indicated. Samples then underwent SDS-PAGE and anti-FLAG Western blotting (n = 3 for all cell-lines tested). Samples were normalized for quantification using GAPDH as a loading control. Representative images showing the gradual clearance of of WT or mutant protein over time are shown in g, I and k with quantification of three independent replicates shown in (h, j) and (i). m-q Control or mutant iNeurons were generated as indicated, and then exposed to MG132 treatment (100 nm) for 5 days. Lysates were collected at day 0 and day 5 and underwent SDS-PAGE and anti- α-syn, anti-TDP-43, or anti-tau Western blotting (n = 3 for all cell-lines tested). Samples were normalized for quantification using GAPDH as a loading control. Representative images demonstrating WT or mutant protein over time are shown in k with quantification of three independent replicates shown in (l). r Proposed model for how mutations in α-syn, TDP-43 and tau can gradually increase steady state levels of protein over decades to predispose to impaired proteostasis, protein aggregation and neurodegeneration. *p < 0.05, **p < 0.01, or ***p < 0.001

References

    1. Dugger BN, Dickson DW. Pathology of Neurodegenerative Diseases. Cold Spring Harb Perspect Biol. 2017;9(7):a028035. - PMC - PubMed
    1. Li B, Ge P, Murray KA, Sheth P, Zhang M, Nair G, et al. Cryo-EM of full-length α-synuclein reveals fibril polymorphs with a common structural kernel. Nat Commun. 2018;9(1):3609. - PMC - PubMed
    1. Cao Q, Boyer DR, Sawaya MR, Ge P, Eisenberg DS. Cryo-EM structures of four polymorphic TDP-43 amyloid cores. Nat Struct Mol Biol. 2019;26(7):619–627. - PMC - PubMed
    1. Fitzpatrick AWP, Falcon B, He S, Murzin AG, Murshudov G, Garringer HJ, et al. Cryo-EM structures of tau filaments from Alzheimer’s disease. Nature. 2017;547(7662):185–190. - PMC - PubMed
    1. Mathieu C, Pappu RV, Taylor JP. Beyond aggregation: Pathological phase transitions in neurodegenerative disease. Science. 2020;370(6512):56–60. - PMC - PubMed

Publication types