. 2023 Jan-Dec;15(1):2205425.
doi: 10.1080/19490976.2023.2205425.

Crohn's disease proteolytic microbiota enhances inflammation through PAR2 pathway in gnotobiotic mice

Affiliations

Crohn's disease proteolytic microbiota enhances inflammation through PAR2 pathway in gnotobiotic mice

Alba Santiago et al. Gut Microbes. 2023 Jan-Dec.

Abstract

Emerging evidence implicates microbial proteolytic activity in ulcerative colitis (UC), but whether it also plays a role in Crohn's disease (CD) remains unclear. We investigated the effects of colonizing adult and neonatal germ-free C57BL/6 mice with CD microbiota, selected based on high (CD-HPA) or low fecal proteolytic activity (CD-LPA), or microbiota from healthy controls with LPA (HC-LPA) or HPA (HC-HPA). We then investigated colitogenic mechanisms in gnotobiotic C57BL/6, and in mice with impaired Nucleotide-binding Oligomerization Domain-2 (NOD2) and Protease-Activated Receptor 2 (PAR2) cleavage resistant mice (Nod2-/-; R38E-PAR2 respectively). At sacrifice, total fecal proteolytic, elastolytic, and mucolytic activity were analyzed. Microbial community and predicted function were assessed by 16S rRNA gene sequencing and PICRUSt2. Immune function and colonic injury were investigated by inflammatory gene expression (NanoString) and histology. Colonization with HC-LPA or CD-LPA lowered baseline fecal proteolytic activity in germ-free mice, which was paralleled by lower acute inflammatory cell infiltrate. CD-HPA further increased proteolytic activity compared with germ-free mice. CD-HPA mice had lower alpha diversity, distinct microbial profiles and higher fecal proteolytic activity compared with CD-LPA. C57BL/6 and Nod2-/- mice, but not R38E-PAR2, colonized with CD-HPA had higher colitis severity than those colonized with CD-LPA. Our results indicate that CD proteolytic microbiota is proinflammatory, increasing colitis severity through a PAR2 pathway.

Keywords: Crohn’s disease; DSS-induced colitis; Proteinase-activated receptor 2 (PAR2); gnotobiotic mice; inflammation; proteolytic activity.


Conflict of interest statement

EFV is Member of the Biocodex International and National (Canada) Scientific Review Boards, Member of the Center for Gut Microbiome Research and Education Scientific Advisory Board of the AGA, Secretary of the International Society of the Study of Celiac Disease, and holds grants from Kallyope and Codexis, unrelated to this study.

Figures

Figure 1.
Figure 1.
Colonization with CD-HPA lacks a homeostatic modulation of host proteolytic activity in germ-free mice. (a) Fecal samples from a previously characterized human cohort were selected for mouse colonizations. Feces from a healthy control with low (HC-LPA; n = 1) or high proteolytic activity (HC-HPA; n = 1), or from Crohn’s disease patients with low (CD-LPA, n = 1) or high proteolytic activity (CD-HPA; n = 2 differentially identified by red open or closed dots) were gavaged to germ-free (GF) C57BL/6 mice. (b) Overall proteolytic activity, (c) elastase activity, and (d) mucolytic activity were measured in mouse fecal samples 3 weeks following colonization. Germ-free (GF; n = 32), HC-LPA (n = 14), HC-HPA (n = 5), CD-LPA (n = 7), CD-HPA (n = 9). (e) Luminescent intensity was used to measure PAR2 cleavage in vitro. Germ-free (GF; n = 7), HC-LPA (n = 10), HC-HPA (n = 4), CD-LPA (n = 6), CD-HPA (n = 8). Data are presented as median with interquartile range, with whiskers extending from minimum to maximum. Each dot represents one mouse. Statistical significance was determined by one-way ANOVA with Tukey post-hoc test for multiple comparisons.
Figure 2.
Figure 2.
Colonization of GF mice with CD-HPA induces an inflammatory immune tone. (a) Heatmap of gene expression, determined by NanoString nCounter codesets, in colonic tissue of CD-LPA (n = 4) and CD-HPA1 (n = 4) colonized mice. Data presented as Z-scores of differential gene expression and analyzed in R package. Only significantly altered genes are shown. (b) Polymorphonuclear (PMN) cell counts in the colonic mucosa of CD-LPA (n = 7) or CD-HPA (n = 9) feces. Each dot represents one mouse. Open circles refer to mice colonized with CD-HPA donor 2. Data are presented as median with interquartile range with whiskers extending from minimum to maximum. Statistical significance was determined by one-way ANOVA with Tukey post-hoc test for multiple comparisons. (c) Representative images of the different groups of colonic mucosa sections stained with hematoxylin and eosin and examined at 40× magnification. Arrowheads show examples of PMN cells.
Figure 3.
Figure 3.
Mice colonized with CD-LPA and CD-HPA have a distinct microbial composition. Fecal microbiota composition in germ-free mice colonized with CD-LPA (n = 7) or CD-HPA (n = 9) was determined by 16S rRNA gene sequencing. (a) Alpha diversity of fecal microbiota profiles calculated using the Chao 1 and Shannon indexes. Data are presented as median with interquartile range with whiskers extending from minimum to maximum. Statistical significance determined by t-test. (b) Beta diversity of fecal microbiota profiles of CD-LPA and CD-HPA colonized mice at genus level illustrated with PCoA using Bray-Curtis and weighted UniFrac distance metrics. Each dot represents one mouse. Open circles refer to mice colonized with CD-HPA donor 2. (c) Heatmap of differentially expressed bacteria at the species level between CD-LPA and CD-HPA colonized mice. Data presented as Z-scores with the average relative abundance of that species shown in the rightmost column. Extreme outliers are marked with a slash and are not included for the statistical analysis.
Figure 4.
Figure 4.
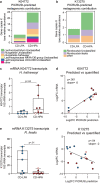
Serine proteases are differentially expressed in CD-LPA and CD-HPA colonized mice. PICRUSt2 predicted metagenomic contribution was used to identify bacterial species responsible for the increase in (a) K04772 and (b) K13275. (c) Targeted transcriptional analysis using RT-qPCR of the H. hathewayi serine protease K04772. (d) Correlation between quantified transcripts and PICRUSt2-predicted genes for H. hathewayi serine protease K04772. (e) Targeted transcriptional analysis using RT-qPCR of the R. ilealis serine protease K13275. (f) Correlation between quantified transcripts and PICRUSt2-predicted genes for R. ilealis serine protease K13275. Each dot represents one mouse. Open circles refer to mice colonized with CD-HPA donor 2. Data are presented as median with interquartile range with whiskers extending from minimum to maximum. Statistical significance was determined by t-test for the expression of transcripts and Spearman index for correlations.
Figure 5.
Figure 5.
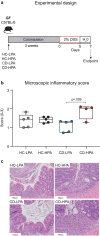
CD-HPA microbiota has a colitogenic effect in C57BL/6 germ-free mice. (a) Germ-free (GF) C57BL/6 mice were colonized with feces from HC-LPA (n = 5), HC-HPA (n = 5), CD-LPA (n = 5), or CD-HPA (n = 4). Three weeks later, acute colitis was induced, where mice received 2% DSS in drinking water for 5 days followed by 2 days of water. (b) Histological scores of colonic intestinal inflammation were determined using a modified pathological score. Statistical significance was determined by one-way ANOVA with Tukey post-hoc test for multiple comparisons. Each dot represents one mouse. (c) Representative images of colonic mucosa sections stained with hematoxylin and eosin and examined at 20× magnification.
Figure 6.
Figure 6.
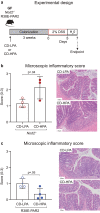
PAR2 cleavage-resistant mice colonized with CD-HPA are protected from colitis. (a) Germ-free (GF) Nod2−/− and R38E-PAR2 were colonized with feces from CD-LPA (n = 4 Nod2−/−; n = 3 R38E-PAR2) or CD-HPA (n = 3 Nod2−/−; n = 4 R38E-PAR2). Three weeks later, acute colitis was induced where mice received 2% DSS in drinking water for 5 days followed by 2 days of water. Colonic histological scores were determined using a modified pathological score, and representative images of colonic mucosa sections stained with hematoxylin and eosin and examined at 20× magnification are shown for (b) Nod2−/- and (c) R38E-PAR2 mice. Statistical significance was determined by t-test between CD-LPA and CD-HPA within each strain of mice. Each dot represents one mouse.

References

    1. Ananthakrishnan AN. Epidemiology and risk factors for IBD. Nat Rev Gastroenterol Hepatol. 2015;12(4):205–19. doi:10.1038/nrgastro.2015.34. - DOI - PubMed
    1. Chang JT, Longo DL. Pathophysiology of inflammatory bowel diseases. N Engl J Med. 2020;383(27):2652–2664. doi:10.1056/NEJMra2002697. - DOI - PubMed
    1. Kaplan GG. The global burden of IBD: from 2015 to 2025. Nat Rev Gastroenterol Hepatol. 2015;12(12):720–727. doi:10.1038/nrgastro.2015.150. - DOI - PubMed
    1. Ng SC, Shi HY, Hamidi N, Underwood FE, Tang W, Benchimol EI, Panaccione R, Ghosh S, Wu JCY, Chan FKL, et al. Worldwide incidence and prevalence of inflammatory bowel disease in the 21st century: a systematic review of population-based studies. Lancet. 2017;390(10114):2769–2778. doi:10.1016/S0140-6736(17)32448-0. - DOI - PubMed
    1. Motta J, Magne L, Descamps D, Rolland C, Squarzoni–Dale C, Rousset P, Martin L, Cenac N, Balloy V, Huerre M, et al. Modifying the protease, antiprotease pattern by Elafin overexpression protects mice from colitis. Gastroenterology. 2011;140(4):1272–1282. doi:10.1053/j.gastro.2010.12.050. - DOI - PubMed

Publication types