. 2023 Apr 26:16:1805-1823.
doi: 10.2147/JIR.S406562. eCollection 2023.

Identification of Ferroptosis-Related Biomarkers for Diagnosis and Molecular Classification of Staphylococcus aureus-Induced Osteomyelitis

Affiliations

Identification of Ferroptosis-Related Biomarkers for Diagnosis and Molecular Classification of Staphylococcus aureus-Induced Osteomyelitis

Xiangwen Shi et al. J Inflamm Res. .

Abstract

Objective: Staphylococcus aureus (SA)-induced osteomyelitis (OM) is one of the most common refractory diseases in orthopedics. Early diagnosis is beneficial to improve the prognosis of patients. Ferroptosis plays a key role in inflammation and immune response, while the mechanism of ferroptosis-related genes (FRGs) in SA-induced OM is still unclear. The purpose of this study was to determine the role of ferroptosis-related genes in the diagnosis, molecular classification and immune infiltration of SA-induced OM by bioinformatics.

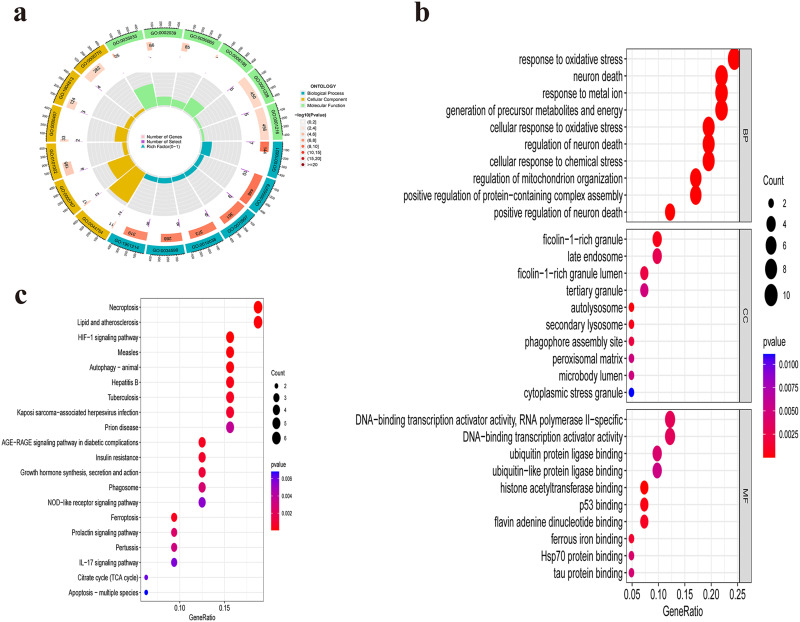
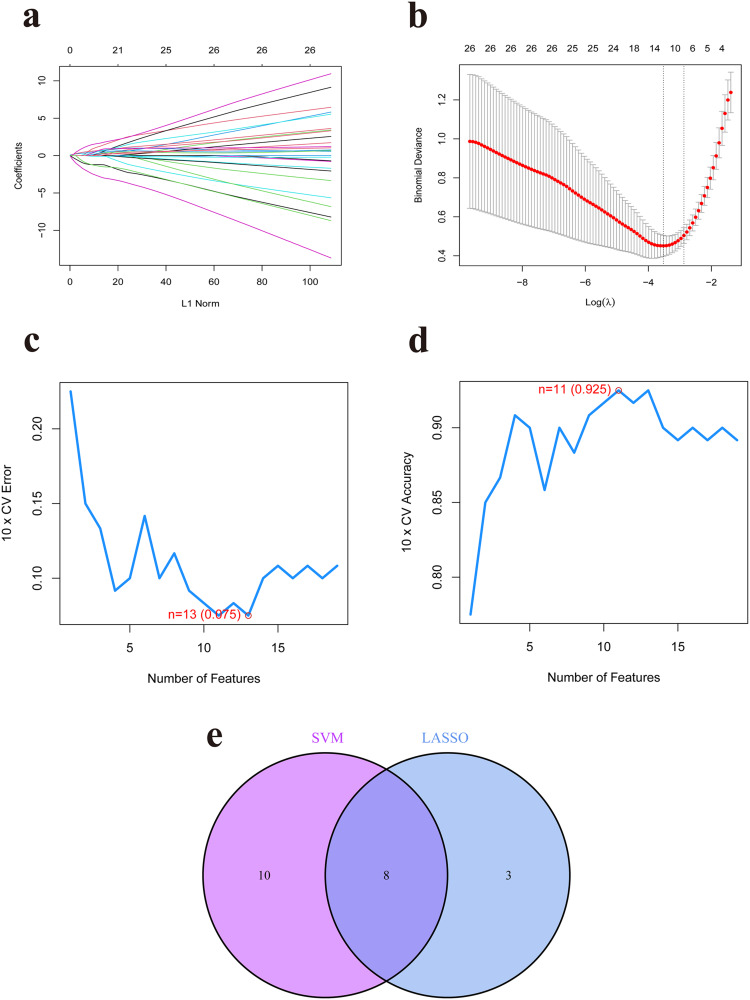
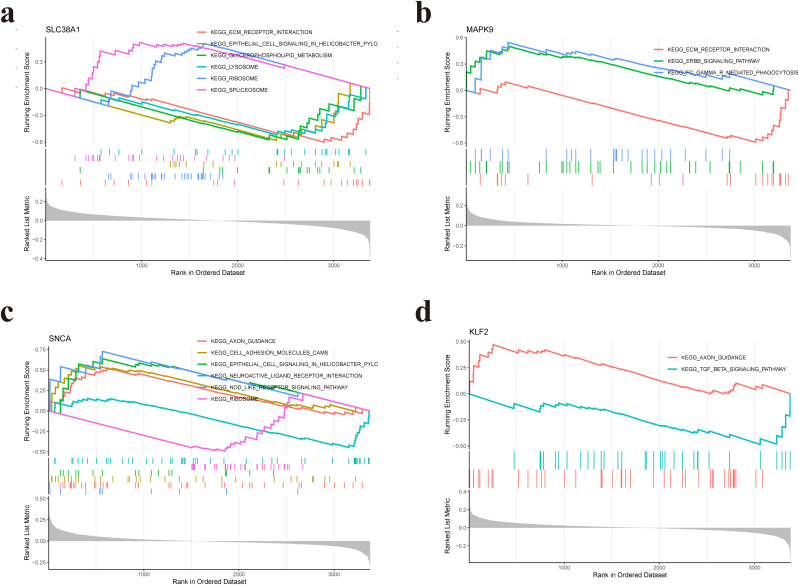
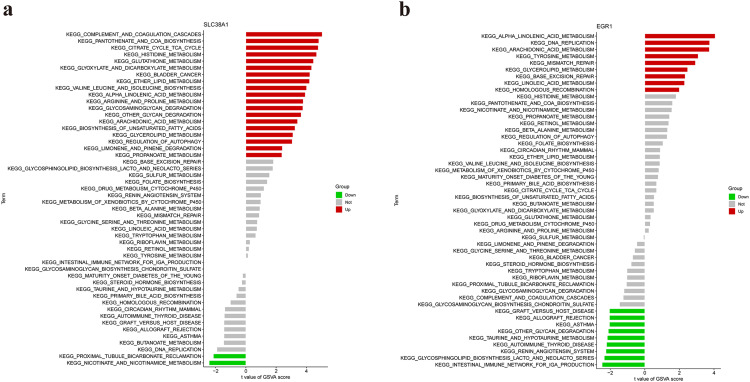
Methods: Datasets related to SA-induced OM and ferroptosis were collected from the Gene Expression Omnibus (GEO) and ferroptosis databases, respectively. The least absolute shrinkage and selection operator (LASSO) and support vector machine-recursive feature elimination (SVM-RFE) algorithms were combined to screen out differentially expressed-FRGs (DE-FRGs) with diagnostic characteristics, and gene set enrichment analysis (GSEA) and gene set variation analysis (GSVA) were used to explore specific biological functions and pathways. Based on these key DE-FRGs, a diagnostic model was established, and molecular subtypes were divided to explore the changes in the immune microenvironment between molecular subtypes.

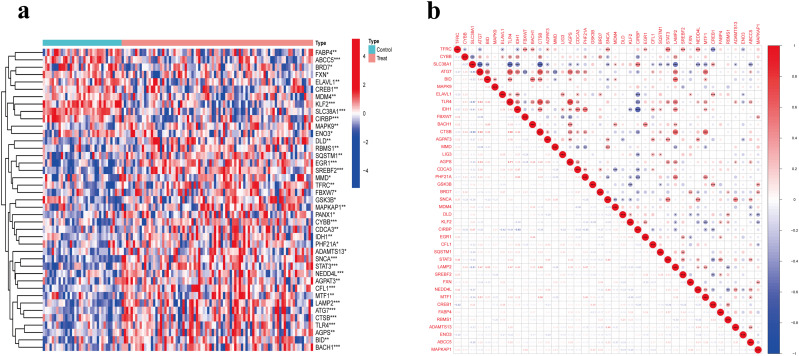
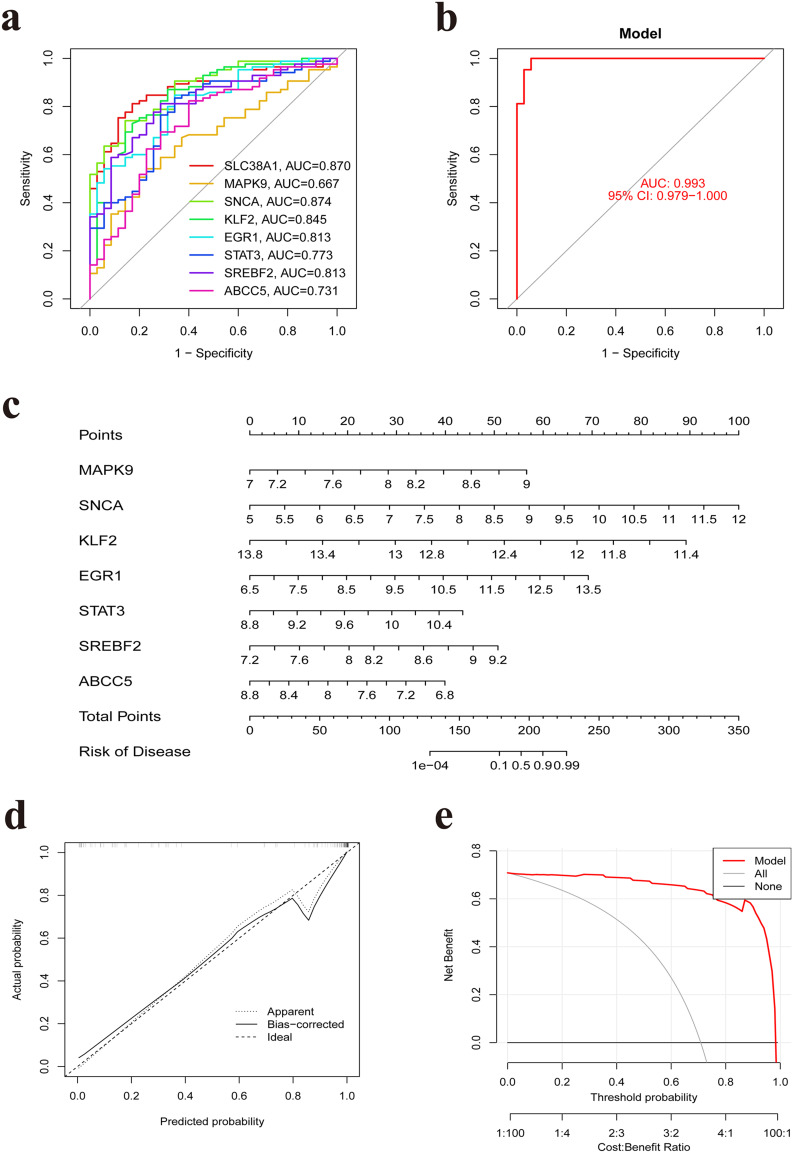
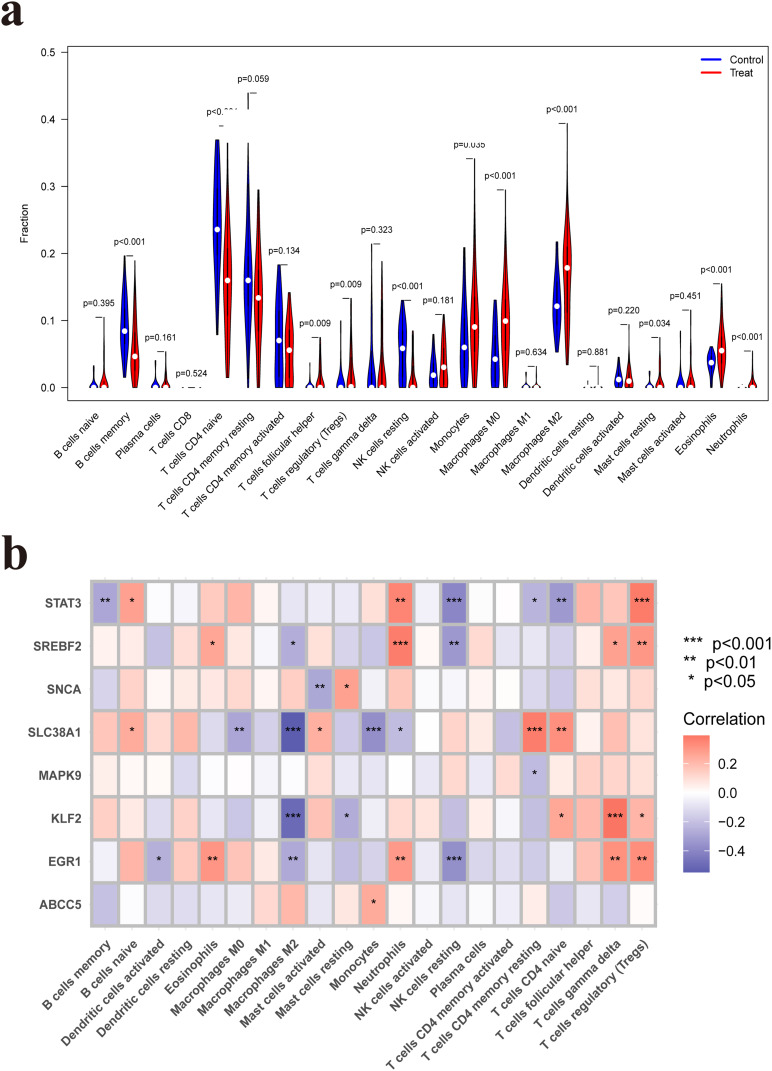
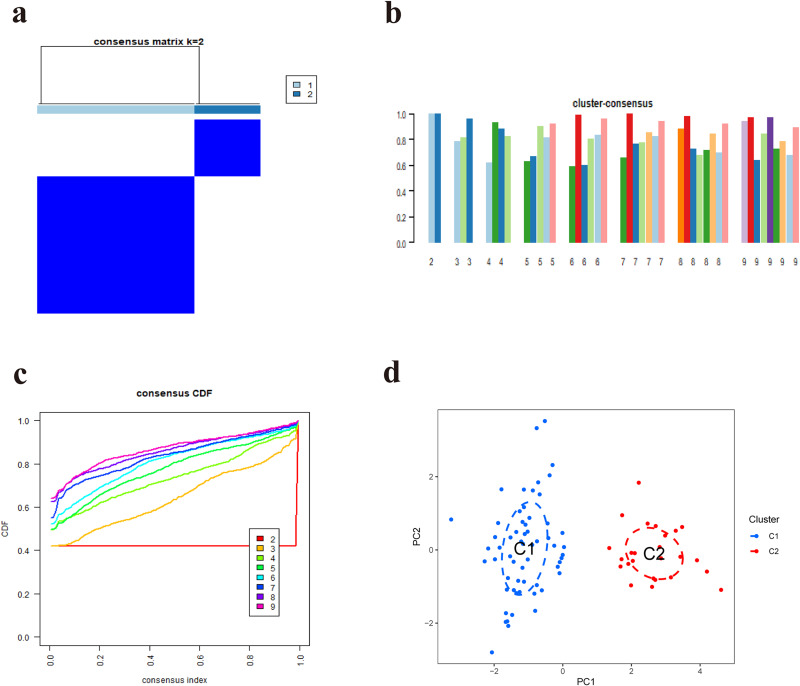
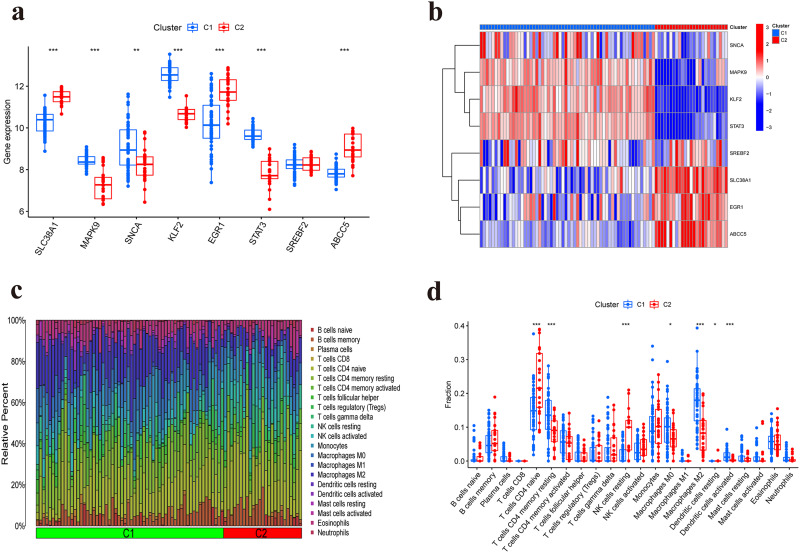
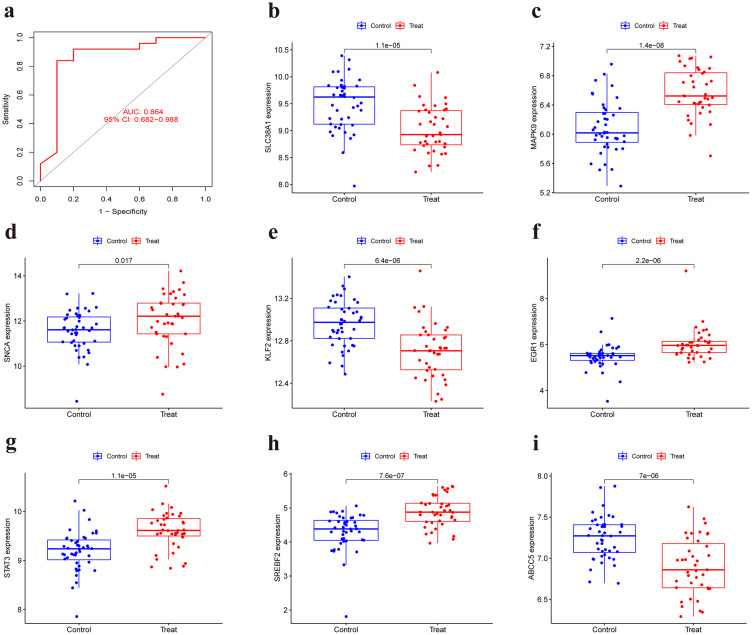
Results: A total of 41 DE-FRGs were identified. After screening and intersecting with LASSO and SVM-RFE algorithms, 8 key DE-FRGs with diagnostic characteristics were obtained, which may regulate the pathogenesis of OM through the immune response and amino acid metabolism. The ROC curve indicated that the 8 DE-FRGs had excellent diagnostic ability for SA-induced OM (AUC=0.993). Two different molecular subtypes (subtype 1 and subtype 2) were identified by unsupervised cluster analysis. The CIBERSORT analysis revealed that the subtype 1 OM had higher immune cell infiltration rates, mainly in T cells CD4 memory resting, macrophages M0, macrophages M2, dendritic cells resting, and dendritic cells activated.

Conclusion: We developed a diagnostic model related to ferroptosis and molecular subtypes significantly related to immune infiltration, which may provide a novel insight for exploring the pathogenesis and immunotherapy of SA-induced OM.

Keywords: biomarker; ferroptosis; immune infiltration; molecular subtype; osteomyelitis.


Conflict of interest statement

All the authors declare that they have no competing interests in this work.

Figures

Figure 1
Figure 1
Expression levels and correlations of DE-FRGs in OM. (a) Differential heatmap of these DE-FRGs. Red indicates the DE-FRG is highly expressed in the sample, and blue indicates the DE-FRG is lowly expressed in the sample. (b) The correlation analysis of these DE-FRGs. Red represents positive correlation, blue represents negative correlation. *: P<0.05, **: P<0.01, ***: P<0.001.
Figure 2
Figure 2
Functional enrichment analysis of GO and KEGG pathway in DE-FRGs. (a) GO enrichment analysis of top 20 biological processes. (b) Top 10 enriched GO terms for biological processes (BP), cellular components (CC), and biological functions (BF). (c) Enrichment analysis of the top 20 KEGG pathways.
Figure 3
Figure 3
8 Diagnostic biomarkers were identified for OM based on significant DE-FRGs. (a) Coefficient distribution graph; a line represents a gene, and the ordinate of each gene corresponds to a coefficient. (b) Screening of gene biomarkers from DE-FRGs using the LASSO algorithm. (c) Result of cross-validation error. (d) Result of cross-validation accuracy. (e) Gene biomarkers are obtained based on the intersection of LASSO and SVM-RFE algorithms.
Figure 4
Figure 4
ROC curve and nomogram model based on 8 diagnostic biomarkers. (a) ROC curves for the 8 diagnostic biomarkers. (b) a Logistic regression model was constructed to identify the OM samples. (c) Nomogram of 8 gene biomarkers in the diagnosis of OM patients. (d) Calibration curve. (e) Decision curve analysis of the nomogram model.
Figure 5
Figure 5
Single-gene GSEA-KEGG pathway analysis in SLC38A1 (a), MAPK9 (b), SNCA (c), KLF2 (d).
Figure 6
Figure 6
Differentially activated pathways between the high- and low-expression groups based on the expression levels of each gene biomarkers. (a) GSVA-KEGG pathway analysis in SLC38A1. (b) GSVA-KEGG pathway analysis in EGR1.
Figure 7
Figure 7
Immune microenvironment analysis. (a) Implemented the CIBERSORT algorithm to evaluate the abundant difference of immune cells between OM samples and healthy samples. (b) The results of immune correlation analysis indicated that both SLC38A1 and KLF2 had a strong negative correlation with macrophages M2, while SREBF2, STAT3 and EGR1 had a strong positive correlation with neutrophils. *P<0.05, **P<0.01, ***P<0.001.
Figure 8
Figure 8
Molecular subgroups based on clustering analysis of 8 gene biomarkers. (a) Heatmap of 2 clusters (k = 2) based on gene biomarkers. (b) Consistency scores of 2–9 clusters. (c) Cumulative distribution graph. (d) PCA analysis of the 2 clusters: blue indicates cluster 1 samples; red indicates cluster 2 samples.
Figure 9
Figure 9
The differences in gene expression levels and immune microenvironment characteristics between two different clusters. (a) Differences in the expression levels of 8 gene biomarkers between cluster 1 and cluster 2: blue indicates cluster 1 samples; red indicates cluster 2 samples. (b) Clusting heatmap of gene expression levels between two different clusters: red represents high expression, blue represents low expression. (c) Immune cell content stacking plot between cluster 1 and cluster 2: different colors indicate different immune cells; the horizontal axis is the different clusters. (d) Immune cell content histogram: the horizontal axis indicates 22 immune cells; the vertical axis indicates infiltration abundance; blue indicates cluster 1 samples; red indicates cluster 2 samples. *: P<0.05, **: P<0.01, ***: P<0.001.
Figure 10
Figure 10
Logistic regression model and expression levels of gene biomakers in the validation set. (a) Logistic regression model in the validation set. Expression levels of SLC38A1 (b), MAPK9 (c), SNCA (d), KLF2 (e), EGR1 (f), STAT3 (g), SREBF2 (h) and ABCC5 (i) in the validation set.
Figure 11
Figure 11
Clinical correlation analysis between 8 gene biomakers and the ages of OM patients. Clinical correlation analysis of SLC38A1 (a), MAPK9 (b), SNCA (c), KLF2 (d), EGR1 (e), STAT3 (f), SREBF2 (g) and ABCC5 (h) in the validation set: R>0 indicates the two variables are positively correlated; R<0 indicates the two variables are negatively correlated; P<0.05 represents that the two variables are significantly correlated.
Figure 12
Figure 12
RT-qPCR validation. Rat models of OM was established and total RNA was extracted from the focal bone tissue and healthy bone tissue of rat model of OM, the mRNA expression levels of SLC38A1 (a), MAPK9 (b), SNCA (c), KLF2 (d), EGR1 (e), STAT3 (f), SREBF2 (g) and ABCC5 (h) in the the focal bone tissue and control group. ns: P≥0.05, *: P<0.05, **: P<0.01, ***: P<0.001.

Similar articles

Cited by

References

    1. Momodu II, Savaliya V. Osteomyelitis. Treasure Island (FL): StatPearls Publishing Copyright © 2022, StatPearls Publishing LLC; 2022.
    1. Schmitt SK. Osteomyelitis. Infect Dis Clin North Am. 2017;31(2):325–338. doi:10.1016/j.idc.2017.01.010 - DOI - PubMed
    1. Hogan A, Heppert VG, Suda AJ. Osteomyelitis. Arch Orthop Trauma Surg. 2013;133(9):1183–1196. doi:10.1007/s00402-013-1785-7 - DOI - PubMed
    1. Cobb LH, McCabe EM, Priddy LB. Therapeutics and delivery vehicles for local treatment of osteomyelitis. J Orthop Res. 2020;38(10):2091–2103. doi:10.1002/jor.24689 - DOI - PMC - PubMed
    1. Fraimow HS. Systemic antimicrobial therapy in osteomyelitis. Semin Plast Surg. 2009;23(2):90–99. doi:10.1055/s-0029-1214161 - DOI - PMC - PubMed