

High expression of cytoplasmic FOXO3 protein associated with poor prognosis of rectal cancer patients: A study from Swedish clinical trial of preoperative radiotherapy to big database analysis
- PMID: 37131452
- PMCID: PMC10149220
- DOI: 10.1016/j.heliyon.2023.e15342
High expression of cytoplasmic FOXO3 protein associated with poor prognosis of rectal cancer patients: A study from Swedish clinical trial of preoperative radiotherapy to big database analysis
Abstract
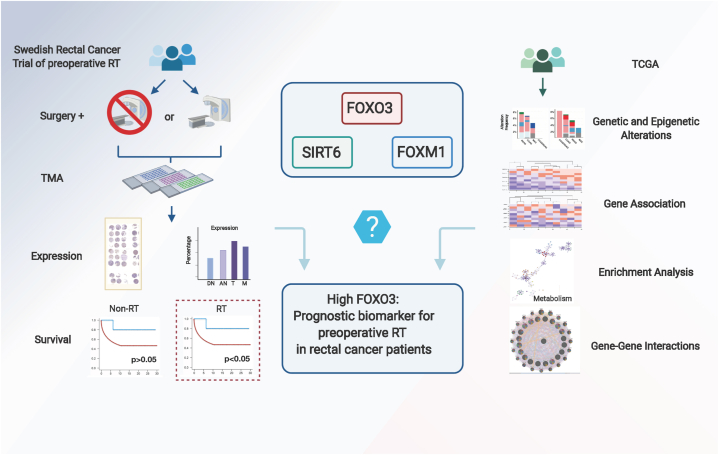
Introduction: Accumulating evidence has implicated a pivotal role for FOXO3, FOXM1 and SIRT6 in cancer progression. The majority of researches focused on the functions of these proteins in drug resistance, but their relationships with radiotherapy (RT) response remain unclear. In this study, we examined protein expression of FOXO3, FOXM1 and SIRT6 and their clinical significance in a Swedish rectal cancer trial of preoperative RT.
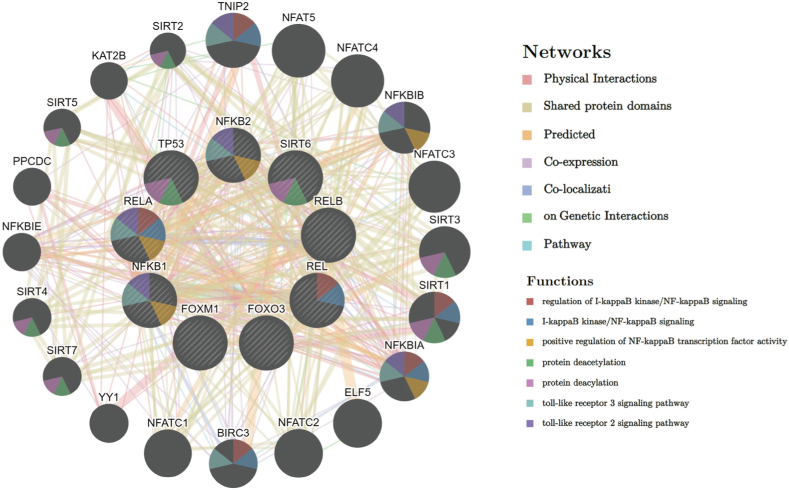
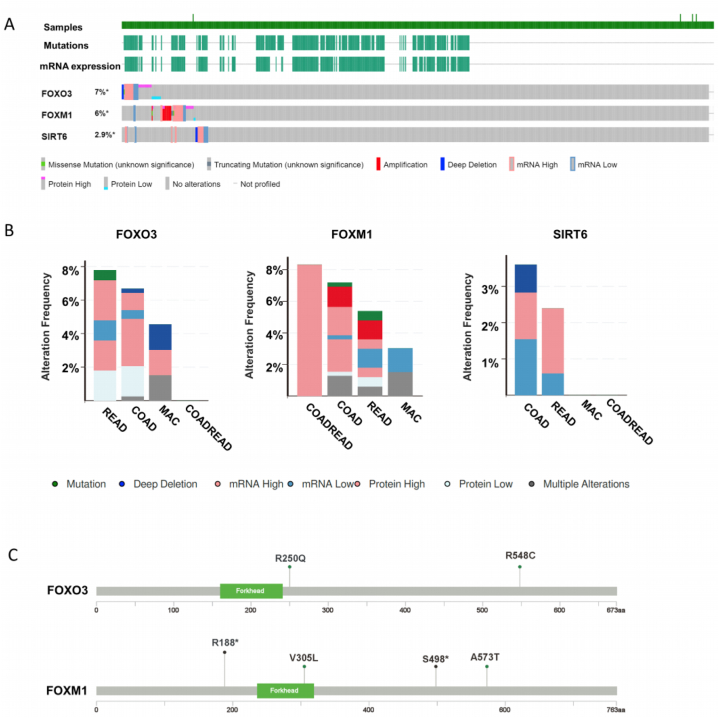
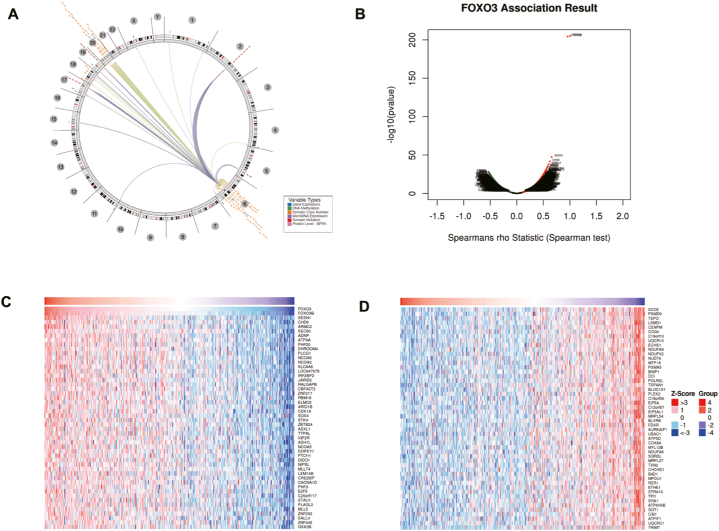
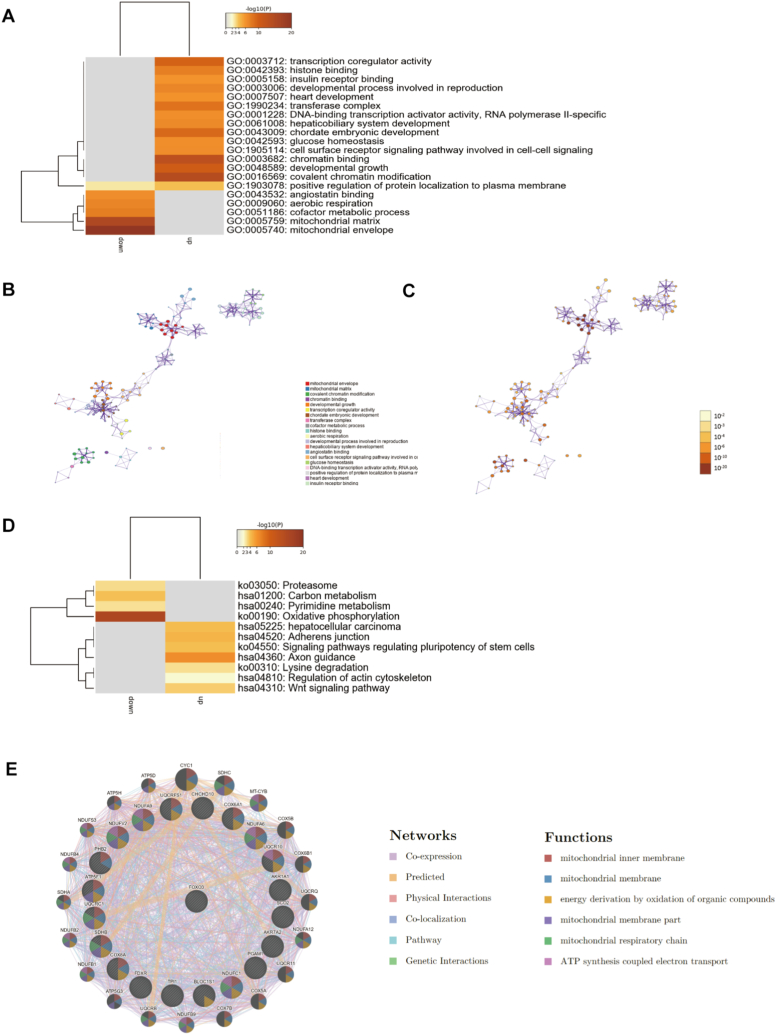
Methods: Expression of FOXO3, FOXM1 and SIRT6 protein was examined by immunohistochemistry in patient samples. Genetic analysis of FOXO3, FOXM1 and SIRT6 were performed by cBioportal and MEXPRESS database. Gene-gene network analysis was conducted using GeneMANIA. Functional enrichment analysis was performed based on LinkedOmics and Metascape online software.
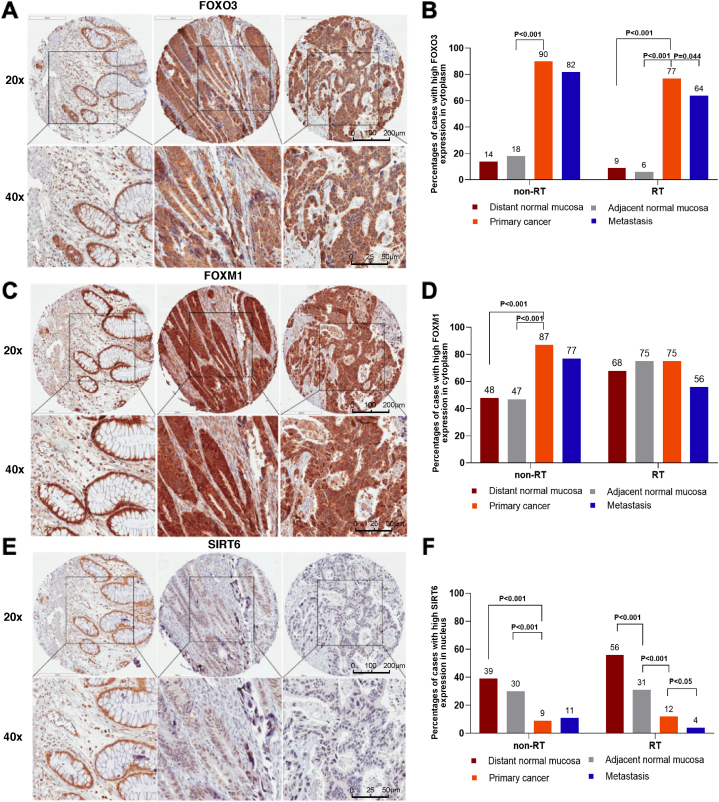
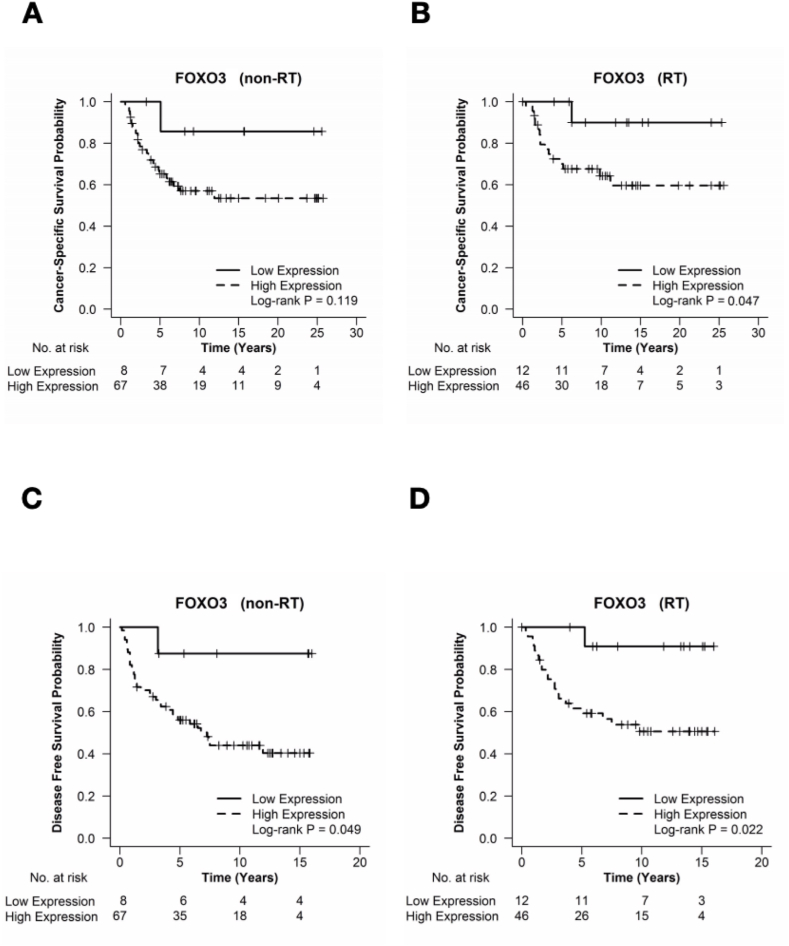
Results: FOXO3 and FOXM1were mainly expressed in the cytoplasm in both normal and tumour tissues, and SIRT6 in both the cytoplasm and nucleus in normal and tumour tissues. FOXO3 and FOXM1 expression increased from normal mucosa to primary cancer (P < 0.001), while SIRT6 expression decreased from normal mucosa to primary cancer (P < 0.001). High FOXO3 expression correlated with late TNM stage (P = 0.040), distant metastasis (P = 0.032) and independently with disease free survival (DFS) in the RT patients (HR = 7.948; P = 0.049; 95% CI = 1.002-63.032) but not in non-RT patients (P > 0.05). Genetic analysis indicated that DNA methylation status contributed to FOXO3 overexpression. Functional enrichment analysis demonstrated that FOXO3 was closely related to metabolism-related signalling pathway which in turn associated with cancer radioresistance. Moreover, there were strong gene-gene interactions between FOXO3 and metabolism-related signalling.
Conclusions: Our findings suggest that FOXO3 may be a prognostic factor in rectal cancer patients with RT.
Keywords: FOXM1; FOXO3; Prognosis; Radiotherapy; Rectal cancer patients; SIRT6.
© 2023 Published by Elsevier Ltd.
Figures
Similar articles
-
Expressions of miR-302a, miR-105, and miR-888 Play Critical Roles in Pathogenesis, Radiotherapy, and Prognosis on Rectal Cancer Patients: A Study From Rectal Cancer Patients in a Swedish Rectal Cancer Trial of Preoperative Radiotherapy to Big Database Analyses.Front Oncol. 2020 Oct 6;10:567042. doi: 10.3389/fonc.2020.567042. eCollection 2020. Front Oncol. 2020. PMID: 33123477 Free PMC article.
-
Histone deacetylase SIRT6 regulates chemosensitivity in liver cancer cells via modulation of FOXO3 activity.Oncol Rep. 2018 Dec;40(6):3635-3644. doi: 10.3892/or.2018.6770. Epub 2018 Oct 8. Oncol Rep. 2018. PMID: 30542728 Free PMC article.
-
Expression of FOXM1 and related proteins in breast cancer molecular subtypes.Int J Exp Pathol. 2016 Apr;97(2):170-7. doi: 10.1111/iep.12187. Epub 2016 Jun 9. Int J Exp Pathol. 2016. PMID: 27277416 Free PMC article.
-
Clinicopathological and prognostic value of SIRT6 in patients with solid tumors: a meta-analysis and TCGA data review.Cancer Cell Int. 2022 Feb 16;22(1):84. doi: 10.1186/s12935-022-02511-3. Cancer Cell Int. 2022. PMID: 35172823 Free PMC article. Review.
-
Prognostic and clinicopathological value of FoxM1 expression in colorectal cancer: A systematic review and meta-analysis.Medicine (Baltimore). 2018 Dec;97(52):e13899. doi: 10.1097/MD.0000000000013899. Medicine (Baltimore). 2018. PMID: 30593202 Free PMC article.
References
-
- Moncharmont C., Levy A., Guy J.B., Falk A.T., Guilbert M., Trone J.C., Alphonse G., Gilormini M., Ardail D., Toillon R.A., Rodriguez-Lafrasse C., Magne N. Radiation-enhanced cell migration/invasion process: a review. Crit. Rev. Oncol.-Hematol. 2014;92:133–142. doi: 10.1016/j.critrevonc.2014.05.006. - DOI - PubMed
LinkOut - more resources
Full Text Sources
Research Materials
Miscellaneous
