

Citizen engagement in public services in low- and middle-income countries: A mixed-methods systematic review of participation, inclusion, transparency and accountability (PITA) initiatives
- PMID: 37131473
- PMCID: PMC8356537
- DOI: 10.1002/cl2.1025
Citizen engagement in public services in low- and middle-income countries: A mixed-methods systematic review of participation, inclusion, transparency and accountability (PITA) initiatives
Abstract
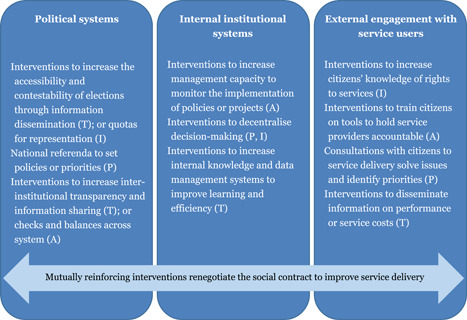
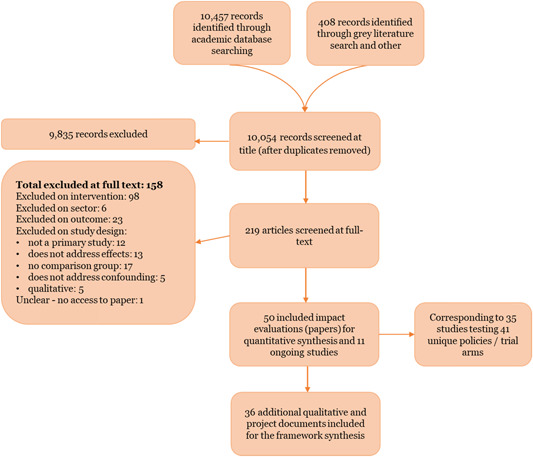
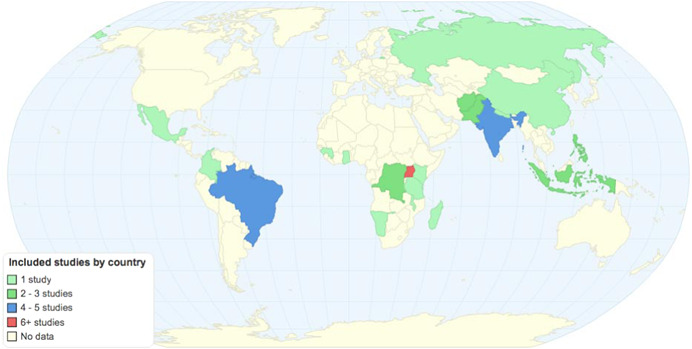
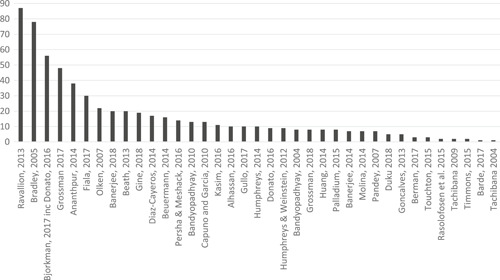
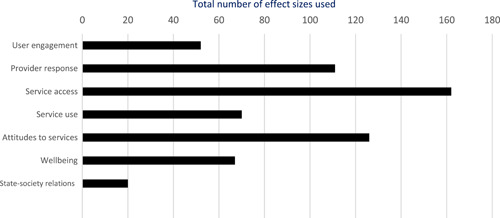
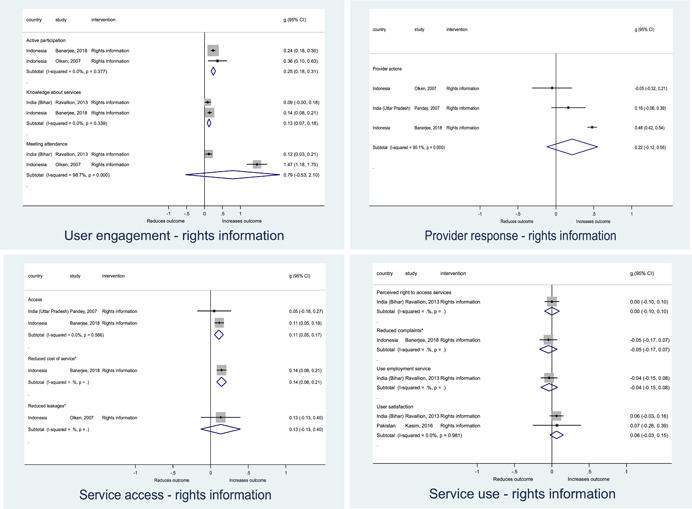
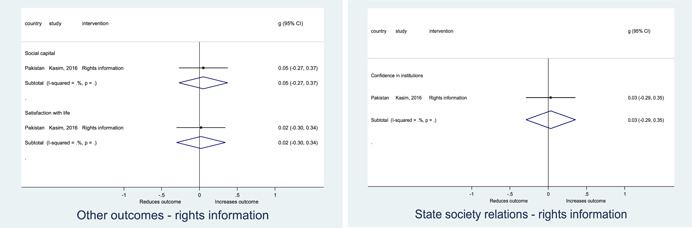
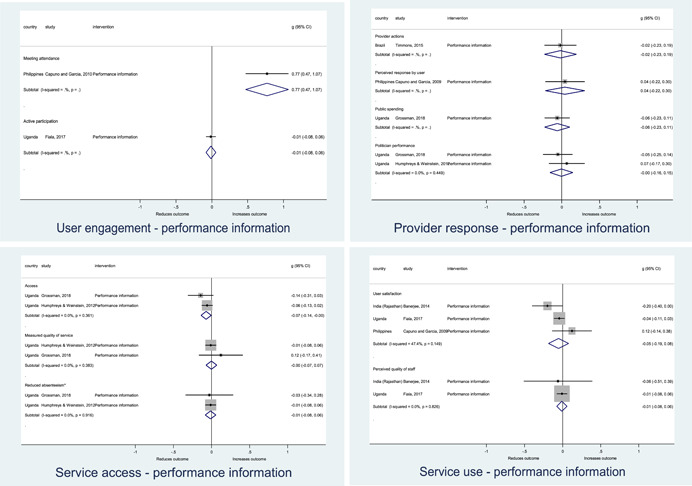
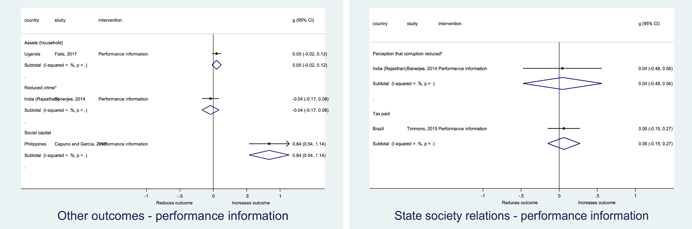
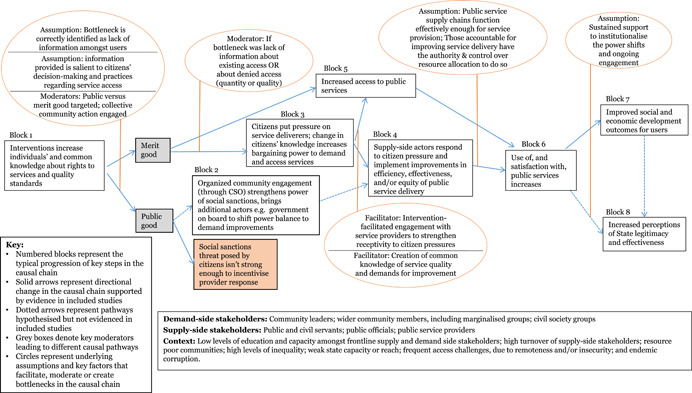
Background: How do governance interventions that engage citizens in public service delivery planning, management and oversight impact the quality of and access to services and citizens' quality of life? This systematic review examined high quality evidence from 35 citizen engagement programmes in low- and middle-income countries that promote the engagement of citizens in service delivery through four routes: participation (participatory priority setting); inclusion of marginalised groups; transparency (information on rights and public service performance), and/or citizen efforts to ensure public service accountability (citizen feedback and monitoring); collectively, PITA mechanisms. We collected quantitative and qualitative data from the included studies and used statistical meta-analysis and realist-informed framework synthesis to analyse the findings.
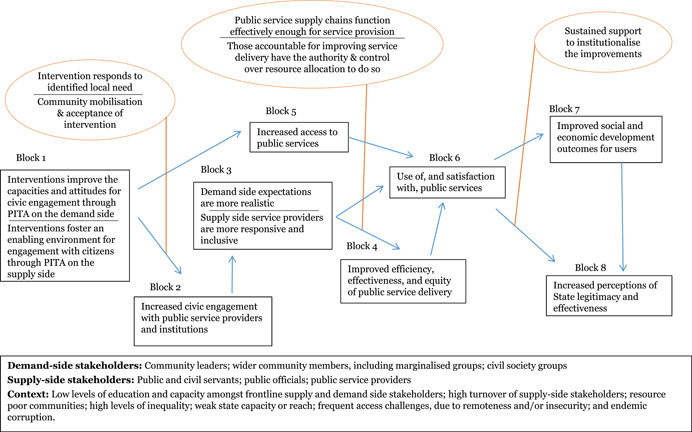
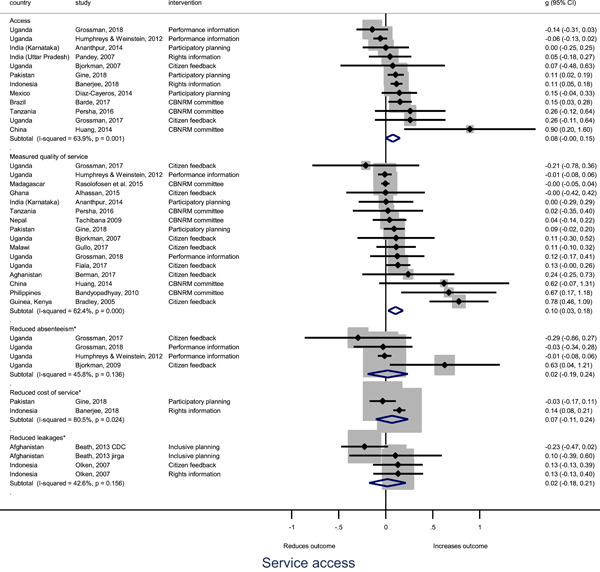
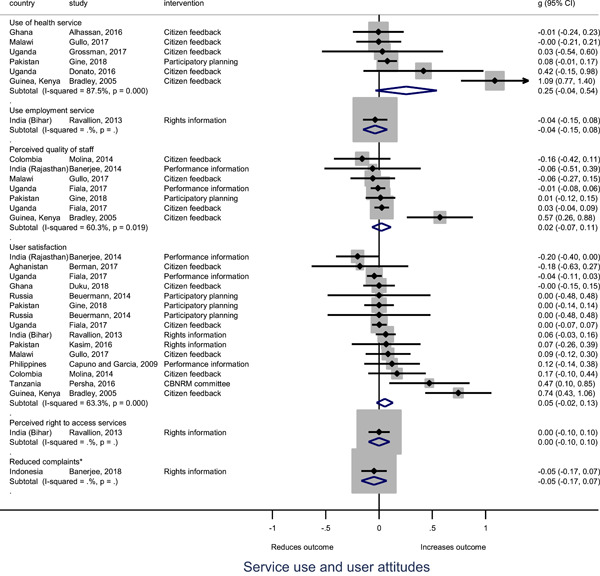
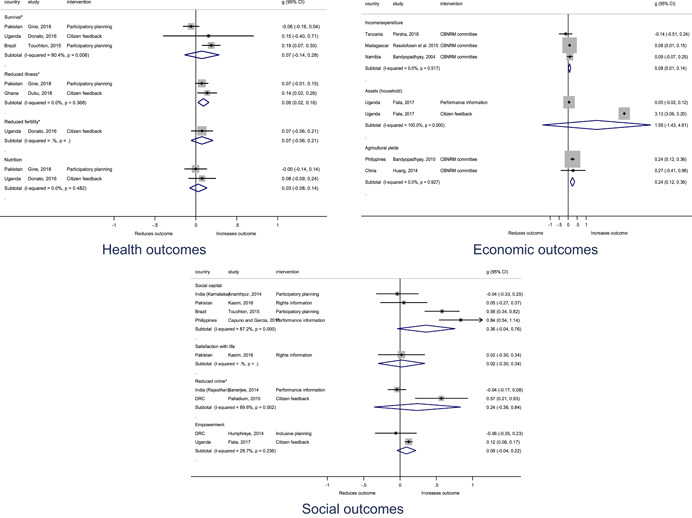
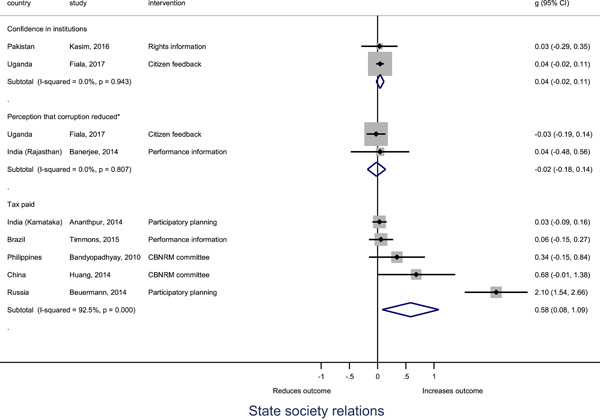
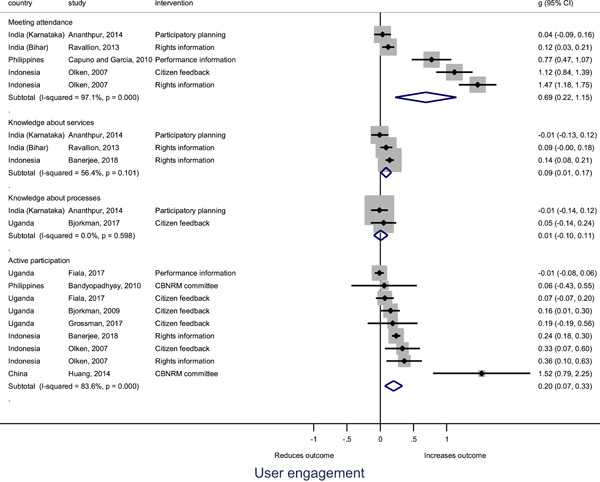
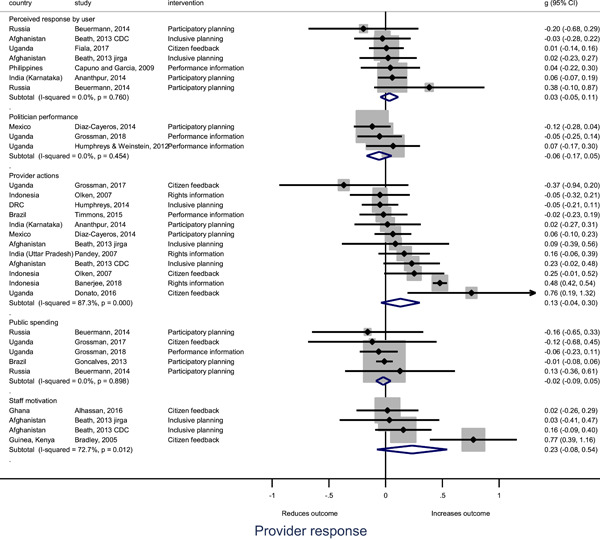
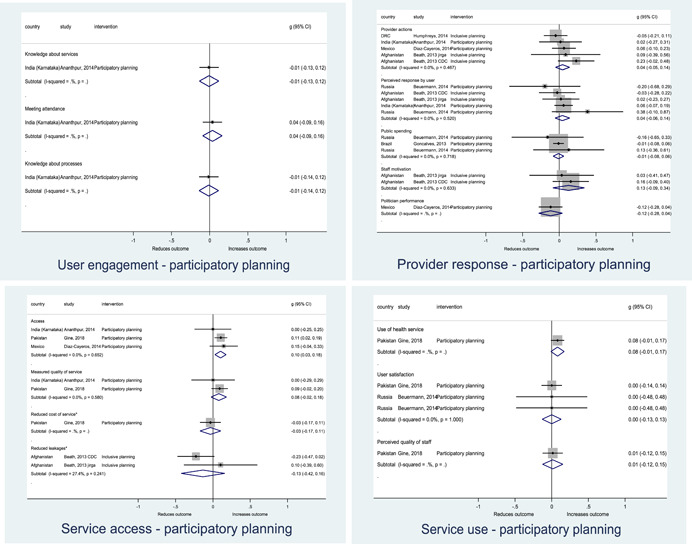
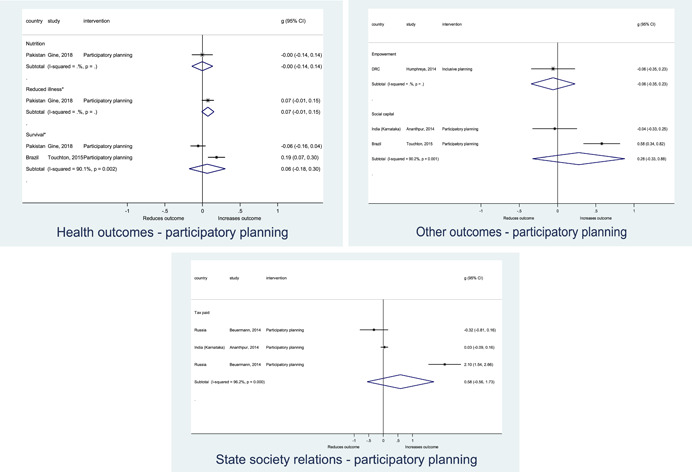
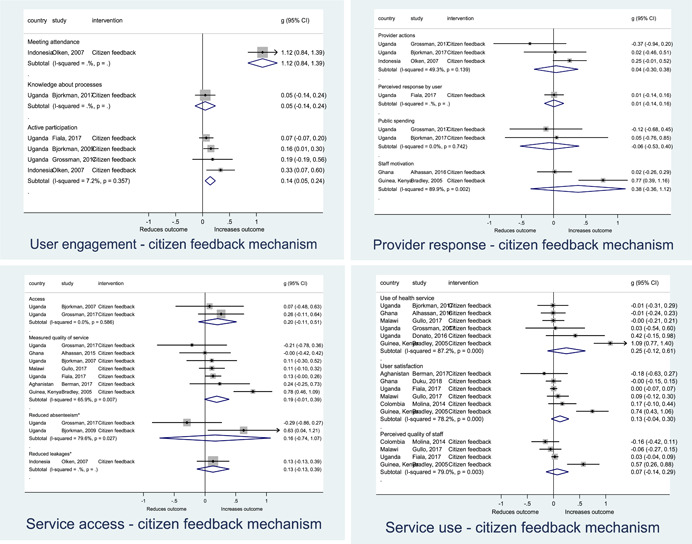
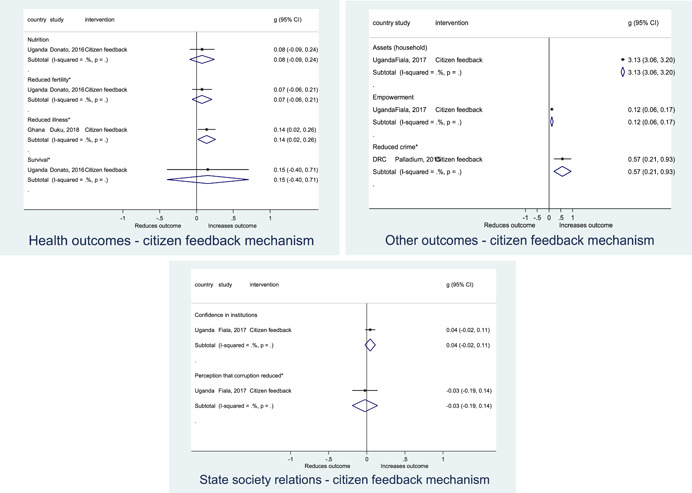
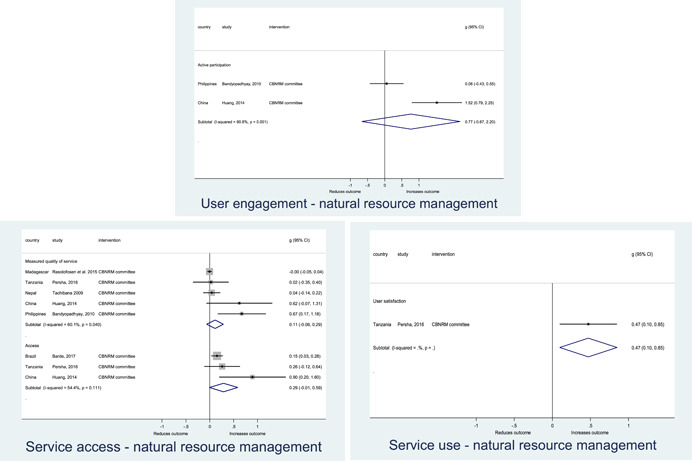
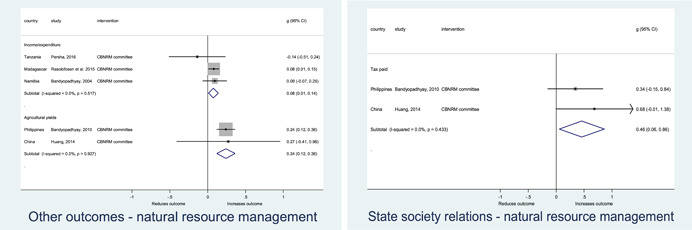
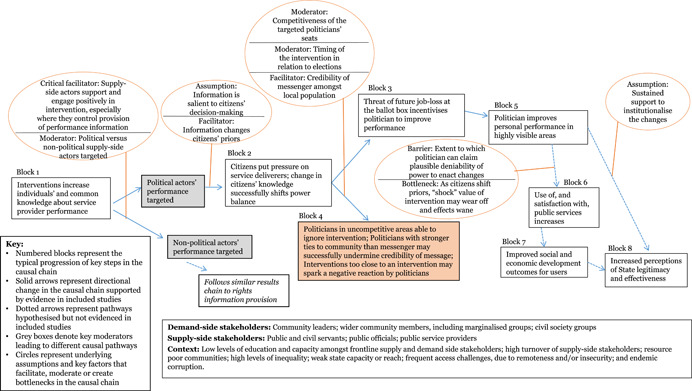
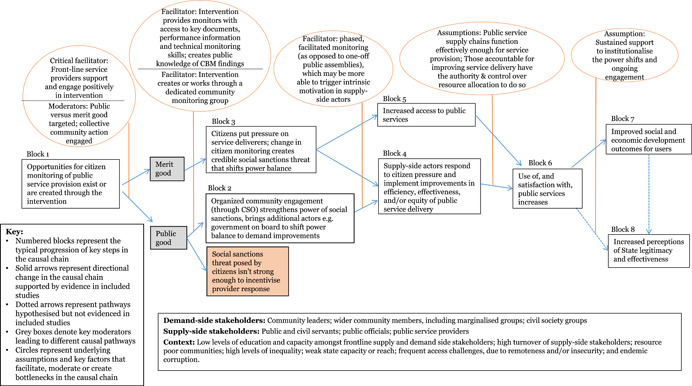
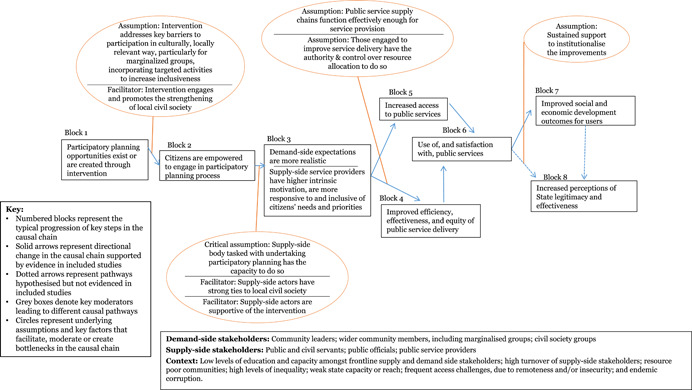
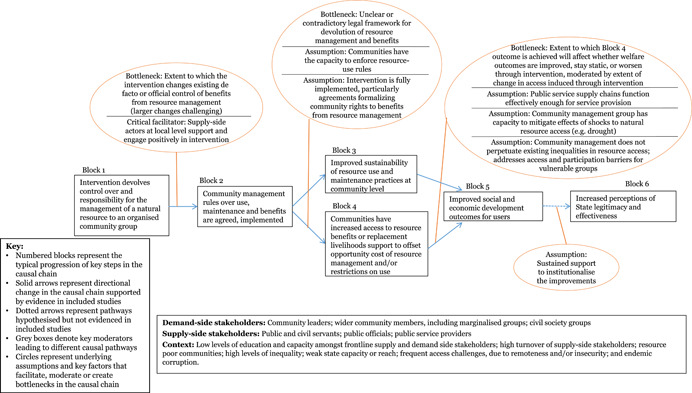
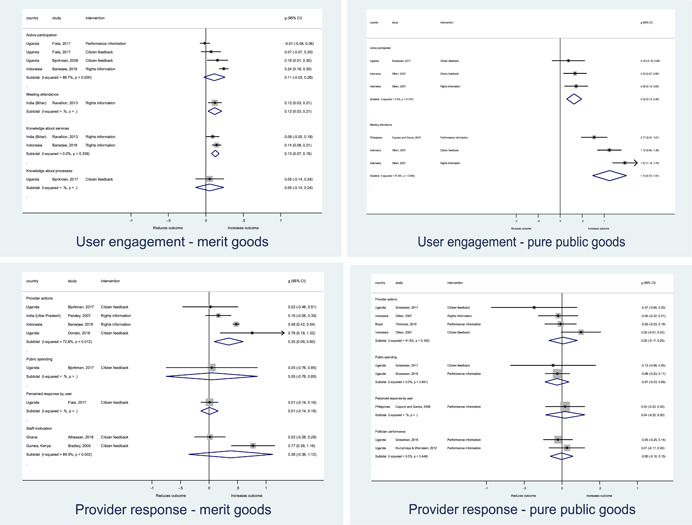
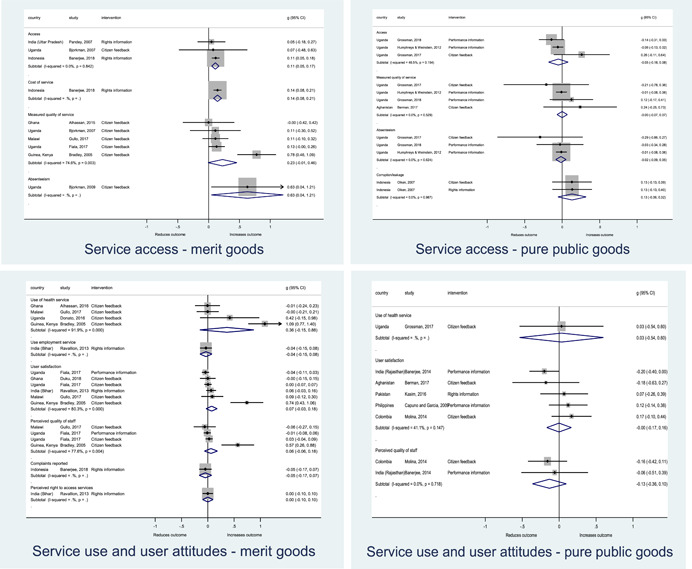
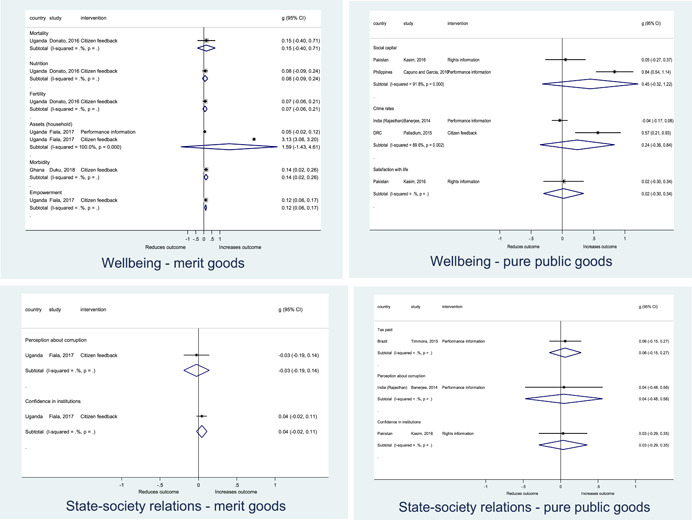
Results: The findings suggest that interventions promoting citizen engagement by improving direct engagement between service users and service providers, are often effective in stimulating active citizen engagement in service delivery and realising improvements in access to services and quality of service provision, particularly for services that involve direct interaction between citizens and providers. However, in the absence of complementary interventions to address bottlenecks around service provider supply chains and service use, citizen engagement interventions alone may not improve key wellbeing outcomes for target communities or state-society relations. In addition, interventions promoting citizen engagement by increasing citizen pressures on politicians to hold providers to account, are not usually able to influence service delivery.
Conclusions: The citizen engagement interventions studied were more likely to be successful: (1) where the programme targeted a service that citizens access directly from front-line staff, such as healthcare, as opposed to services accessed independently of service provider staff, such as roads; (2) where implementers were able to generate active support and buy-in for the intervention from both citizens and front-line public service staff and officials; and (3) where the implementation approach drew on and/or stimulated local capacity for collective action. From a research perspective, the review found few studies that investigated the impact of these interventions on women or other vulnerable groups within communities, and that rigorous impact evaluations often lack adequately transparent reporting, particularly of information on what interventions actually did and how conditions compared to those in comparison communities.
© 2019 The Authors. Campbell Systematic Reviews published by John Wiley & Sons Ltd on behalf of The Campbell Collaboration.
Figures
Similar articles
-
Beyond the black stump: rapid reviews of health research issues affecting regional, rural and remote Australia.Med J Aust. 2020 Dec;213 Suppl 11:S3-S32.e1. doi: 10.5694/mja2.50881. Med J Aust. 2020. PMID: 33314144
-
Health provider responsiveness to social accountability initiatives in low- and middle-income countries: a realist review.Health Policy Plan. 2017 Feb;32(1):125-140. doi: 10.1093/heapol/czw089. Epub 2016 Jul 3. Health Policy Plan. 2017. PMID: 27375128 Review.
-
Impact of summer programmes on the outcomes of disadvantaged or 'at risk' young people: A systematic review.Campbell Syst Rev. 2024 Jun 13;20(2):e1406. doi: 10.1002/cl2.1406. eCollection 2024 Jun. Campbell Syst Rev. 2024. PMID: 38873396 Free PMC article. Review.
-
Citizen science to improve patient and public involvement in GUideline Implementation in oral health and DEntistry (the GUIDE platform).Health Expect. 2024 Feb;27(1):e13921. doi: 10.1111/hex.13921. Epub 2023 Nov 28. Health Expect. 2024. PMID: 38014917 Free PMC article.
-
A scoping review of methods to measure and evaluate citizen engagement in health research.Res Involv Engagem. 2022 Dec 10;8(1):72. doi: 10.1186/s40900-022-00405-2. Res Involv Engagem. 2022. PMID: 36496455 Free PMC article.
Cited by
-
PROTOCOL: Interventions promoting resilience through climate-smart agricultural practices for women farmers: A systematic review.Campbell Syst Rev. 2022 Sep 5;18(3):e1274. doi: 10.1002/cl2.1274. eCollection 2022 Sep. Campbell Syst Rev. 2022. Update in: Campbell Syst Rev. 2024 Aug 27;20(3):e1426. doi: 10.1002/cl2.1426. PMID: 36909889 Free PMC article. Updated.
-
Transparency interventions to improve health system outcomes in low and middle-income countries: a narrative systematic review.BMJ Open. 2024 Jun 6;14(6):e081152. doi: 10.1136/bmjopen-2023-081152. BMJ Open. 2024. PMID: 38844391 Free PMC article.
-
Quality Measurement in Shanghai From a Global Perspective; A Response to Recent Commentaries.Int J Health Policy Manag. 2024;13:8491. doi: 10.34172/ijhpm.2024.8491. Epub 2024 Apr 28. Int J Health Policy Manag. 2024. PMID: 39099497 Free PMC article. No abstract available.
-
Interventions promoting resilience through climate smart agricultural practices for women farmers: A systematic review.Campbell Syst Rev. 2024 Aug 27;20(3):e1426. doi: 10.1002/cl2.1426. eCollection 2024 Sep. Campbell Syst Rev. 2024. PMID: 39193393 Free PMC article. Review.
-
PROTOCOL: Gender transformative approaches in agriculture for women's empowerment: A systematic review.Campbell Syst Rev. 2022 Jul 9;18(3):e1265. doi: 10.1002/cl2.1265. eCollection 2022 Sep. Campbell Syst Rev. 2022. PMID: 36909888 Free PMC article.
References
References to included studies
-
- Alhassan, R. K. , Nketiah‐Amponsah, E. , Spieker, N. , Arhinful, D. K. , & Rinke de wit, T. F. (2016). Assessing the Impact of Community Engagement Interventions on Health Worker Motivation and Experiences with Clients in Primary Health Facilities in Ghana: A Randomized Cluster Trial. PLoS One, 11(7), e0158541. - PMC - PubMed
-
- Alhassan, R. K. , Nketiah‐Amponsah, E. , Spieker, N. , Arhinful, D. K. , Ogink, A. , Van Ostenberg, P. , & Rinke de wit, T. F. (2015). Effect of community engagement interventions on patient safety and risk reduction efforts in primary health facilities: Evidence from Ghana. PLoS One, 10. - PMC - PubMed
-
- Ananthpur, K , Malik, K , & Rao, V. (2014). The Anatomy of Failure: An Ethnography of a Randomized Trial to Deepen Democracy in Rural India. The World Bank, Development Research Group, Poverty and Inequality Team.
-
- Rao, V. , Ananthpur, K. , & Malik, K. (2017). The Anatomy of Failure: An Ethnography of a Randomized Trial to Deepen Democracy in Rural India. World development, 99, 481–497.
-
- Bandyopadhyay, S. , Shyamsundar, P. , & Xie, M. (2010). Transferring irrigation management to farmer's associations: Evidence from the Philippines. Water Policy, 12, 444–460.
References to ongoing studies
-
- Taylor, B ., & Hidalgo, F. D. ONGOING: Accountability and Incumbent Performance in the Brazilian Northeast.
-
- Nassul, K. , Mogues, T ., van Campenhout, B ., & Sseguya, H. ONGOING: Impact Evaluation of Community Advocacy Forums (Barazas) in Uganda.
-
- Khwaja, A ., Acemoglu, D ., & Cheema, A. ONGOING: Trust in State Authority and Non‐State Actors.
-
- Horacio, L ., Lucas, C ., & Marshall, J. ONGOING: When do Media Stations Support Political Accountability? A Field Experiment in Mexico. J‐PAL ongoing.
-
- Laudati, A ., Mvukiyehe, E ., & van der Windt, P. (2016). Participatory Development in Fragile and Conflict‐affected Contexts: An Impact Evaluation of the Tuungane Programme Pre‐Analysis Plan.
References to studies awaiting classification
-
- Tohari, A. , Parsons, C. , & Rammohan, A. (2017). Does Information Empower the Poor? Evidence from Indonesia's Social Security Card (No. 11137). IZA Discussion Papers.
Additional references
-
- Asthana, A. (2012). “Decentralisation and Corruption Revisited: Evidence from a Natural Experiment.” Public Administration and Development, 2012(32), 27–37.
-
- Azulai, M. , Bandiera, O. , Blum, F. , Kleven, H. , La Ferrara, E. , Padro, G. , & Tejada, C. (2014). State Effectiveness, Growth and Development, IGC Evidence Paper. London: International Growth Center. Available at. https://www.theigc.org/wp‐content/uploads/2014/09/IGCEvidencePaperState.pdf
-
- Baldwin, K. , & Raffler, P. (2016). Traditional Leaders, Service Delivery and Electoral Accountability, New Haven: Yale University.
-
- Banerjee, A. , Duflo, E. , Imbert, C. , Mathew, S. , & Pande, R. (2017). E‐Governance, Accountability, and Leakage in Public Programs: Experimental Evidence from a Financial Management Reform in India. MIT Department of Economics Working Paper No. 16‐09. Available at SSRN: https://papers.ssrn.com/sol3/papers.cfm?abstract_id=2867669
-
- Banerjee, A. , Hannah, R. , Kyle, J. , Olken, B. , & Sumarto, S. (2015). “Tangible Information and Citizen Empowerment: Identification Cards and Food Subsidy Programs in Indonesia. NBER Working Paper No. 20923. Available at: http://www.nber.org/papers/w20923
LinkOut - more resources
Full Text Sources