

Antifouling potential of enzymes applied to reverse osmosis membranes
- PMID: 37131492
- PMCID: PMC10149195
- DOI: 10.1016/j.bioflm.2023.100119
Antifouling potential of enzymes applied to reverse osmosis membranes
Abstract
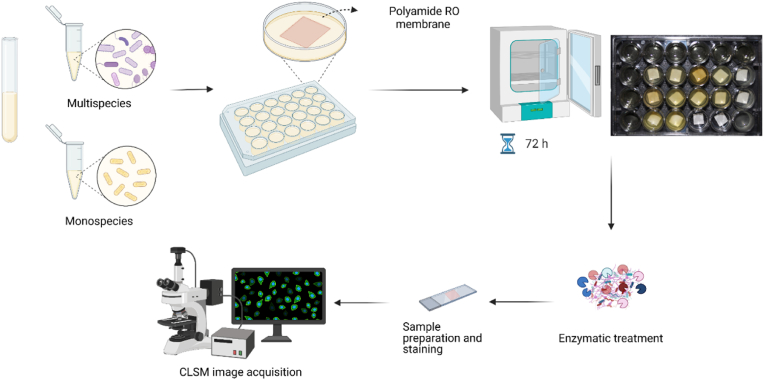
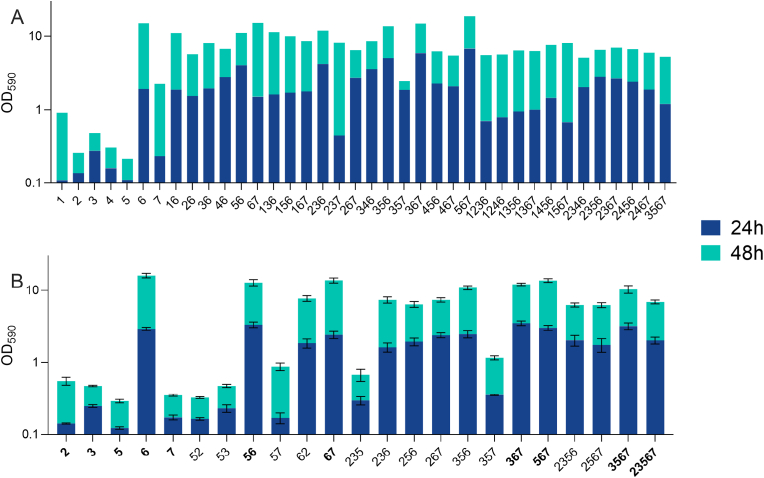
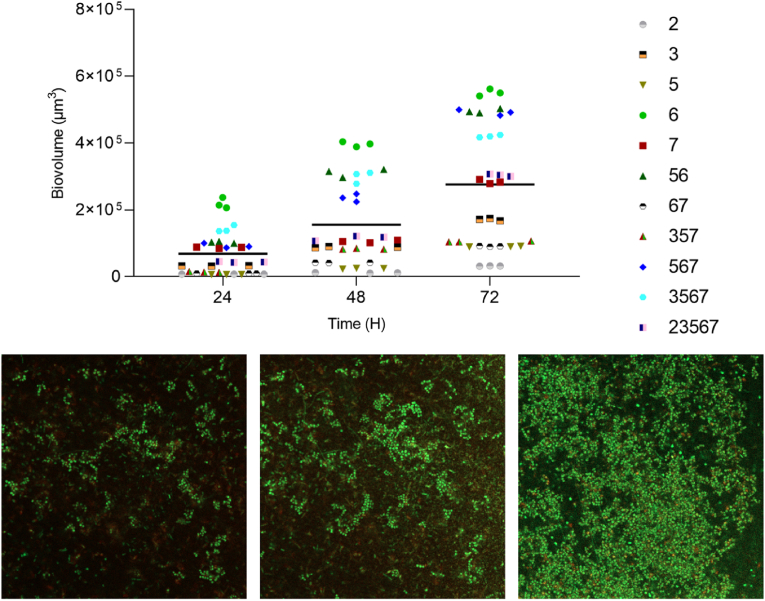
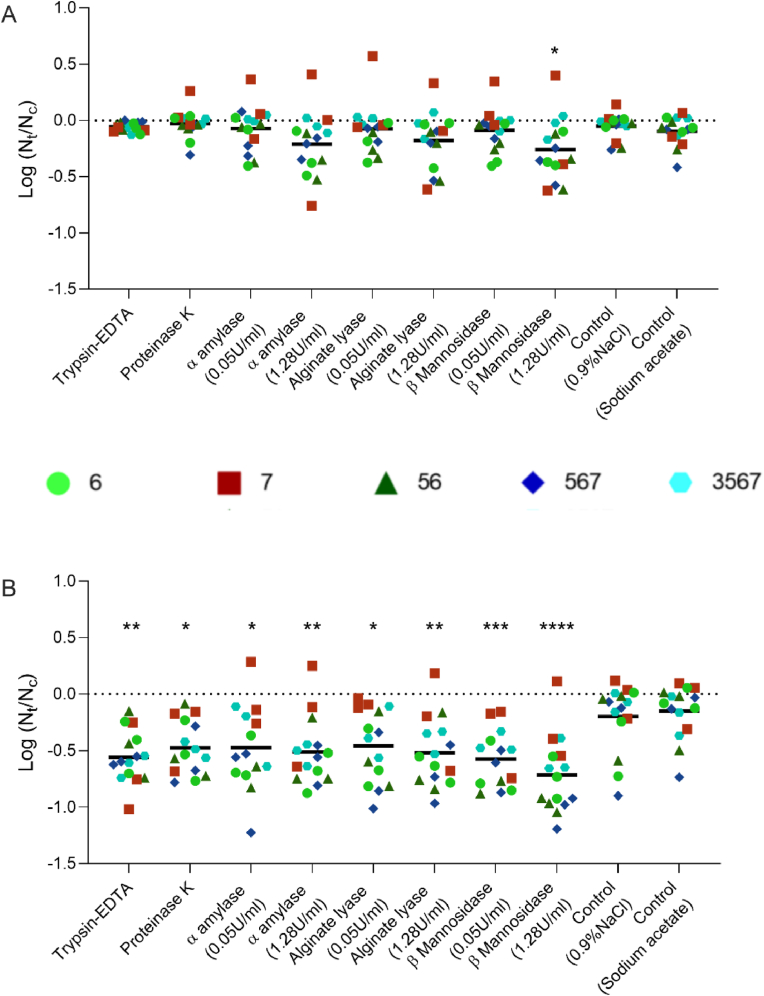
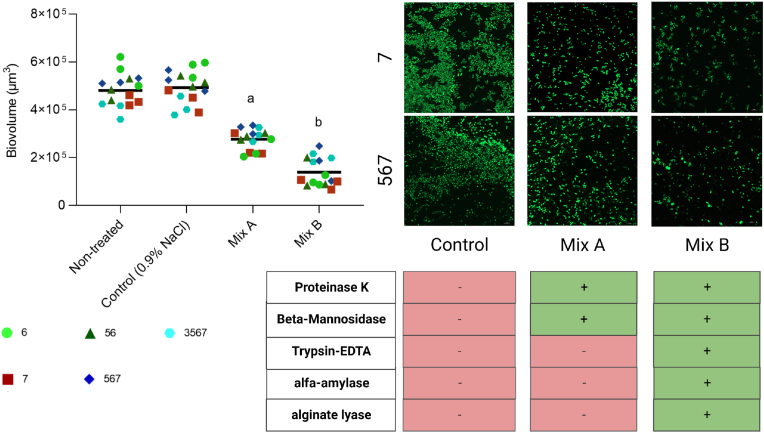
Many companies in the food industry apply reverse osmosis (RO) membranes to ensure high-quality reuse of water. Biofouling is however, a common, recalcitrant and recurring problem that blocks transport over membranes and decreases the water recovery. Microorganisms adhering to membranes may form biofilm and produce an extracellular matrix, which protects against external stress and ensures continuous attachment. Thus, various agents are tested for their ability to degrade and disperse biofilms. Here, we identified industrially relevant bacterial model communities that form biofilms on RO membranes used for treating process water before reuse. There was a marked difference in the biofilm forming capabilities of bacteria isolated from contaminated RO membranes. One species, Raoultella ornithinolytica, was particularly capable of forming biofilm and was included in most communities. The potential of different enzymes (Trypsin-EDTA, Proteinase K, α-Amylase, β-Mannosidase and Alginate lyase) as biofouling dispersing agents was evaluated at different concentrations (0.05 U/ml and 1.28 U/ml). Among the tested enzymes, β-Mannosidase was the only enzyme able to reduce biofilm formation significantly within 4 h of exposure at 25 °C (0.284 log reduction), and only at the high concentration. Longer exposure duration, however, resulted in significant biofilm reduction by all enzymes tested (0.459-0.717 log reduction) at both low and high concentrations. Using confocal laser scanning microscopy, we quantified the biovolume on RO membranes after treatment with two different enzyme mixtures. The application of proteinase K and β-Mannosidase significantly reduced the amount of attached biomass (43% reduction), and the combination of all five enzymes showed even stronger reducing effect (71% reduction). Overall, this study demonstrates a potential treatment strategy, using matrix-degrading enzymes for biofouled RO membranes in food processing water treatment streams. Future studies on optimization of buffer systems, temperature and other factors could facilitate cleaning operations based on enzymatic treatment extending the lifespan of membranes with a continuous flux.
Keywords: Biofilm formation; Biofouling; Confocal laser scanning microscopy; Enzymes; Reverse Osmosis Membrane; Water recovery.
© 2023 The Authors.
Conflict of interest statement
The authors declare that they have no known competing financial interests or personal relationships that could have appeared to influence the work reported in this paper.
Figures
Similar articles
-
Cleaning efficacy of hydroxypropyl-beta-cyclodextrin for biofouling reduction on reverse osmosis membranes.Biofouling. 2016;32(4):359-70. doi: 10.1080/08927014.2016.1151008. Biofouling. 2016. PMID: 26923225
-
Enzymatic cleaning of biofouled thin-film composite reverse osmosis (RO) membrane operated in a biofilm membrane reactor.Biofouling. 2014 Feb;30(2):153-67. doi: 10.1080/08927014.2013.852540. Epub 2013 Dec 11. Biofouling. 2014. PMID: 24329165
-
Multispecies biofilms on reverse osmosis membrane dictate the function and characteristics of the bacterial communities rather than their structure.Environ Res. 2023 Aug 15;231(Pt 1):115999. doi: 10.1016/j.envres.2023.115999. Epub 2023 Apr 25. Environ Res. 2023. PMID: 37105294
-
Review - Bacteria and their extracellular polymeric substances causing biofouling on seawater reverse osmosis desalination membranes.J Environ Manage. 2018 Oct 1;223:586-599. doi: 10.1016/j.jenvman.2018.05.088. Epub 2018 Jun 30. J Environ Manage. 2018. PMID: 29975885 Review.
-
Do biological-based strategies hold promise to biofouling control in MBRs?Water Res. 2013 Oct 1;47(15):5447-63. doi: 10.1016/j.watres.2013.06.033. Epub 2013 Jun 27. Water Res. 2013. PMID: 23863390 Review.
Cited by
-
Microbial enzymes as powerful natural anti-biofilm candidates.Microb Cell Fact. 2024 Dec 23;23(1):343. doi: 10.1186/s12934-024-02610-y. Microb Cell Fact. 2024. PMID: 39710670 Free PMC article. Review.
-
Interpenetrating polymer networks for desalination and water remediation: a comprehensive review of research trends and prospects.RSC Adv. 2023 Feb 20;13(9):6087-6107. doi: 10.1039/d2ra07843k. eCollection 2023 Feb 14. RSC Adv. 2023. PMID: 36814875 Free PMC article. Review.
-
Use of Alteromonas sp. Ni1-LEM Supernatant as a Cleaning Agent for Reverse-Osmosis Membranes (ROMs) from a Desalination Plant in Northern Chile Affected by Biofouling.Membranes (Basel). 2023 Apr 22;13(5):454. doi: 10.3390/membranes13050454. Membranes (Basel). 2023. PMID: 37233515 Free PMC article.
-
Antifouling activities of proteinase K and α-amylase enzymes: Laboratory bioassays and in silico analysis.Heliyon. 2024 May 22;10(11):e31683. doi: 10.1016/j.heliyon.2024.e31683. eCollection 2024 Jun 15. Heliyon. 2024. PMID: 38828329 Free PMC article.
References
-
- Sterling T., van den Berg S. Dutch government declares water shortage due to drought. https://www.reuters.com/world/europe/dutch-government-declares-water-sho...
-
- Nash D. Is eastern Africa's drought the worst in recent history? And are worse yet to come? The Conversation. 2022 https://theconversation.com/is-eastern-africas-drought-the-worst-in-rece... [Internet] Jun 26.
-
- Held I.M., Soden B.J. Robust responses of the hydrological cycle to global warming. J Clim. 2006;19(21):5686–5699. http://journals.ametsoc.org/doi/10.1175/JCLI3990.1 [Internet] Nov 1. - DOI
-
- Trenberth K.E. Changes in precipitation with climate change. Clim Res. 2011 Mar 31;47(1–2):123–138.
LinkOut - more resources
Full Text Sources
Research Materials
