[Preprint]. 2023 Apr 21:2023.04.21.537819.
doi: 10.1101/2023.04.21.537819.

DNA damage-induced interaction between a lineage addiction oncogenic transcription factor and the MRN complex shapes a tissue-specific DNA Damage Response and cancer predisposition

Affiliations

DNA damage-induced interaction between a lineage addiction oncogenic transcription factor and the MRN complex shapes a tissue-specific DNA Damage Response and cancer predisposition

Romuald Binet et al. bioRxiv. .

Abstract

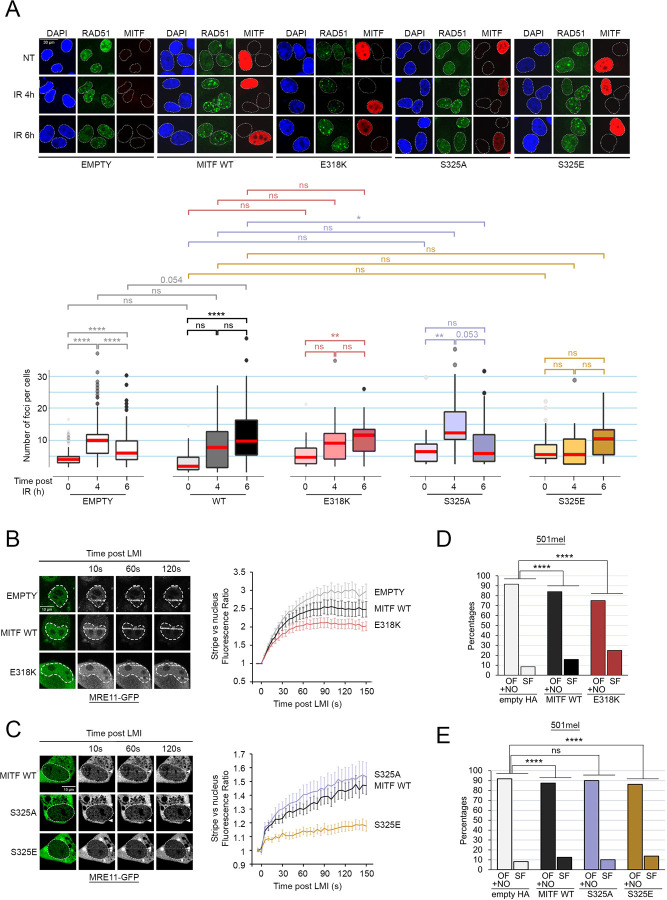
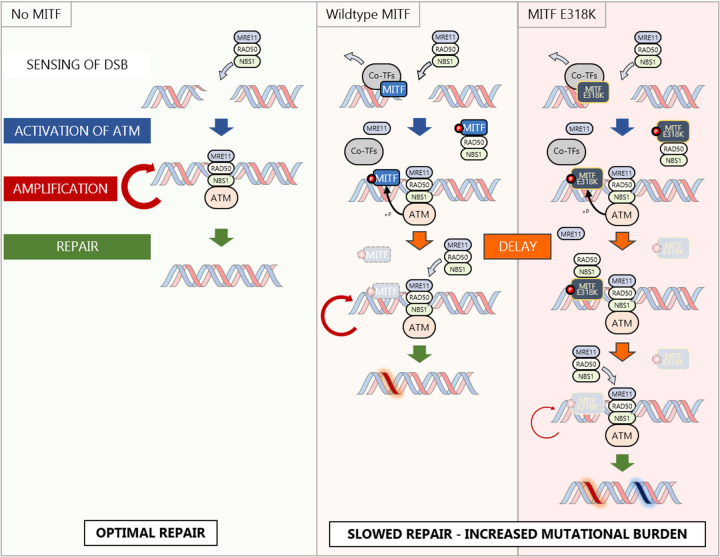
Since genome instability can drive cancer initiation and progression, cells have evolved highly effective and ubiquitous DNA Damage Response (DDR) programs. However, some cells, in skin for example, are normally exposed to high levels of DNA damaging agents. Whether such high-risk cells possess lineage-specific mechanisms that tailor DNA repair to the tissue remains largely unknown. Here we show, using melanoma as a model, that the microphthalmia-associated transcription factor MITF, a lineage addition oncogene that coordinates many aspects of melanocyte and melanoma biology, plays a non-transcriptional role in shaping the DDR. On exposure to DNA damaging agents, MITF is phosphorylated by ATM/DNA-PKcs, and unexpectedly its interactome is dramatically remodelled; most transcription (co)factors dissociate, and instead MITF interacts with the MRE11-RAD50-NBS1 (MRN) complex. Consequently, cells with high MITF levels accumulate stalled replication forks, and display defects in homologous recombination-mediated repair associated with impaired MRN recruitment to DNA damage. In agreement, high MITF levels are associated with increased SNV burden in melanoma. Significantly, the SUMOylation-defective MITF-E318K melanoma predisposition mutation recapitulates the effects of ATM/DNA-PKcs-phosphorylated MITF. Our data suggest that a non-transcriptional function of a lineage-restricted transcription factor contributes to a tissue-specialised modulation of the DDR that can impact cancer initiation.

Keywords: DNA Damage repair; DNA Replication; E318K; Homologous Recombination; MITF; Melanoma; NBS1; Replication Stress; SUMOylation.


Conflict of interest statement

Competing Interest Statement The authors declare no competing interests.

Figures

Figure 1.
Figure 1.
MITF associates with mutational burden and replication stress. (A) Boxplot showing the distribution of single nucleotide variants (SNVs) per sample, from 428 melanoma samples from ICGC, plotted after log-transformation computed as log10(0.1+SNV) in five bins by their MITF expression value. The p-value was computed using the paired Wilcoxon Rank Sum test. The medians are indicated in red. (B) Total copy number log-ratio (logR) of melanoblasts (top) and melanocytes (bottom). Orange horizontal line indicates the inferred diploid state and red lines show copy number segments along each chromosome. Melanoblasts displayed a flat profile indicating no copy number alterations whereas melanocytes showed copy number alterations on chromosomes 1,7 and 10. (C - Left) Timeline of the DNA fibre experiment. Cells were transfected for 48h before being treated sequentially 30 min with BrdU and 30min with EdU, before DNA extraction. (C - Right) Examples of patterns used to quantify the percentage of stalled forks, ongoing forks, and new origins in the DNA fibre assay. BrdU-containing fibres are stained in red, EdU-containing fibres are stained in green. (D) Graph expressing the percentage of ongoing forks (OF)/new origins (NO) and stalled replication forks (SF) in 501mel cells transfected with siMITF (black) or the non-targeting siRNA (grey). The p-value was determined using Fisher’s exact test. p(siMITF)= 9.453417e-06. (E) Immunofluorescence analysis of the accumulation of ssDNA in 501mel cells transfected with siMITF (grey) of the non-targeting siRNA (black). Cells incorporated BrdU for 24 h and were treated with 10 µM camptothecin (CPT) for 1 h. ssDNA foci were detected using an anti-BrdU antibody. Left: Beeswarm plots representing the quantification of the number of BrdU foci. The p-value was computed using the Wilcoxon Rank Sum test. p(siMITF)= 1.442e-06. The medians are indicated in red. Right: Representative images of ssDNA staining. (F) Immunofluorescence analysis of the accumulation of ssDNA after CPT treatment in HEK293 and 501mel transfected with HA-MITF or the corresponding empty vector. All cells had incorporated BrdU for 24 h and were treated with 10 µM camptothecin (CPT) for 1 h. ssDNA foci were made visible using an anti-BrdU antibody. Left: Beeswarm plots representing the quantification of the number of BrdU foci. The p-values were computed using the Wilcoxon Rank Sum test. p(HEK293)=0.002372; p(501mel)=6.014e-06. The medians are indicated in red. Right: Representative images of ssDNA staining in HEK293 (top right panel) and 501mel (bottom right panel). (G) Graph expressing the percentage of ongoing forks (OF)/new origins (NO) and stalled replication forks (SF) in HEK293 cells overexpressing MITF WT (black) or the corresponding empty vector (grey). P-values were determined using Fisher’s exact test. p(MITF WT)= 0.0109008. (H) Graph expressing the percentage of ongoing forks (OF)/new origins (NO) and stalled replication forks (SF) in 501mel cells overexpressing MITF WT (black), ΔR217 (blue) or the corresponding empty vector (grey). P-values were determined using Fisher’s exact test. p(MITF WT)= 2.461506e-06; p(del217)= 1.960337e-19. (I) Diagram depicting the position of the basic domain of MITF and the ΔR217 deletion.
Figure 2.
Figure 2.
MITF positive cells are sensitive to different types of DNA damage. (A) Immunofluorescence analysis of γH2AX activation in HEK293 cells transfected with HA-MITF (black) or the corresponding empty vector (grey). Cells were exposed to 24 J/m2 UV, or treated for 2 h with 10 µM camptothecin (CPT) or 300 g/mL cisplatin (CisPt). Beeswarm plots representing the distribution of γH2AX intensities per cells. The p-values were computed using the Wilcoxon Rank Sum test. ****: p<0.0001. The medians are indicated in red. (B) Immunofluorescence analysis of γH2AX activation over time after UV irradiation (24 J/m2). HEK293 cells were transfected with HA-MITF (black) or the corresponding empty vector (grey). Left: representative images. Right: Boxplots representing the distribution of γH2AX intensities per cells. The p-values were computed using the Wilcoxon Rank Sum test. ***: p<0.001; ****: p<0.0001. The medians are indicated in red. (C) Immunofluorescence analysis of γH2AX activation over time after UV irradiation (24 J/m2). HEK293 cells were transfected with HA-MITF (black), the ΔR217 mutant (blue) or the corresponding empty vector (grey). Left: representative images. Right: Boxplots representing the distribution of γH2AX intensities per cells. The p-values were computed using the Wilcoxon Rank Sum test. **: p<0.01; ***: p<0.001; ****: p<0.0001. The medians are indicated in red. (D) Western blot of HEK293 cells transfected with HA-tagged MITF WT, the ΔR217 mutant or the control vector and exposed to UV (100 J/m2). GAPDH was used a loading control. (E) Western blot of melanoma cell lines expose to UV (100 J/m2)and harvested at the indicated times. Phospho-ATM was used as DDR activation control, GAPDH was used a loading control. (F) Immunofluorescence analysis of the formation of RAD51 foci after IR (X-rays, 2 Gy) in U2-OS cells transfected with HA-MITF or the corresponding empty vector. Cells were fixed and processed at the indicated times after IR. Left: representative images. Right: Boxplots representing the distribution of the number of RAD51 foci per cell. The p-values were computed using the Wilcoxon Rank Sum test. ****: p<0.0001. The medians are indicated in red. (G) Immunofluorescence analysis of the formation of 53BP1 foci after IR (X-rays, 2 Gy) in U2-OS cells transfected with HA-MITF or the corresponding empty vector. Cells were fixed and processed at the indicated times after IR. Left: representative images. Right: Boxplots representing the distribution of the number of 53BP1 foci per cell. The p-values were computed using the Wilcoxon Rank Sum test. ***: p<0.001; ****: p<0.0001. The medians are indicated in red. (H) Cartoon depicting the principle of the U2-OS-DR-GFP reporter system. (I - left) Graph showing the relative efficiency of homologous recombination using the U2-OS-DR-GFP reporter system. Data represent the mean (±SEM) from three independent experiments and are normalised against the I-SceI only samples. The p-values were computed using the Wilcoxon Rank Sum test. ns: non-significant; **: p<0.01. (I - right): Western blot of U2-OS-DR-GFP reporter cells transfected with MITF WT, the ΔR217 mutant or the control vector. GAPDH was used a loading control. (J) Western blot of FLAG-MITF induction with doxycycline. GAPDH was used a loading control. (K) Timeline of the experiment. Cells were induced with doxycycline for 4 h before being exposed to UV (24 J/m2). Immunofluorescence analysis was performed after 24 h. (L) Immunofluorescence analysis of the persistence of 53BP1 foci (red) in FLAG-MITF expressing cells (green). Violin plot representing the distribution of the number of 53BP1 foci per cells in inducible HEK293 cells expressing FLAG-MITF (grey) or the corresponding empty-FLAG (white) 24 h after being exposed to UV. The p-values were computed using the Wilcoxon Rank Sum test. ns: non-significant; ****: p<0.0001. The medians are indicated in red.
Figure 3.
Figure 3.
MITF interactome is remodelled by DNA damage. (A) Dot plot of BioID data showing the significant proximity partners of MITF in non-treated versus CPT-treated HEK293 cells. The colour of the dots represents the average spectral count. The size of the dots represents the relative abundance between conditions. The grey intensity of the line encircling the dots represents the Bayesian False Discovery Rate (BDFR) cut off. Association to either of the six categories: DNA replication and recombination, RNA processing, Ubiquitin system, Chromatin, Transcription and Membrane trafficking is depicted by the coloured lines to the right of each box. Components of the MRN complex are indicated in red. (B) Diagram representing the BioID results according to the effect of CPT on MITF interaction. Where possible, proteins from Fig. 3A were classified using the KEGG BRITE database (www.kegg.jp) and information from UNIPROT (www.uniprot.org) into six categories: transcription regulation; chromatin regulators; RNA processing; ubiquitin system; membrane trafficking; and DNA replication and recombination and segregated into columns highlighting (from left to right) a decreased, unchanged or increased interaction with MITF after CPT treatment. Components of the MRN complex are indicated in red. (C) Cartoon depicting the nuclear tethering assay. (D - Top) Representative images and quantification of the nuclear tethering assay showing interaction between MITF and NBS1, RAD50 or MRE11. The left panels show the localization of mCherry-LacR-NLS or mCherry-LacR-MITF dots in the nuclei of U2OS-LacO#13 cells, and the right panels show GFP-NBS1, GFP-RAD50 or GFP-MRE11 respectively. (D - Bottom) The quantification is expressed as the ratio between the GFP fluorescence measured inside the area delimited by the mCherry dot and in the rest of the nucleus. The p-values were computed using the Wilcoxon Rank Sum test. ns: non-significant; ***: p<0.001. The medians are indicated in red. (E - top) Still images of MRE11-GFP, RAD50-GFP and NBS1-GFP LMI. Nuclei are delimited using the pre-irradiation images. The positions of the irradiated lines are indicated with an arrow. (E - bottom) Quantification of MRE11-GFP, RAD50-GFP and NBS1-GFP recruitment in U2-OS cells after LMI when co-transfected with an empty vector or HA-MITF. The graphs represent the mean +/− SEM stripe/nucleus ratio over time. Values are normalized against the pre-LMI measurements. The baselines are indicated with red dotted lines.
Figure 4.
Figure 4.
MITF recruitment to DNA damage sites. (A) Immunofluorescence of stable 501HA-MITF cells after UV-LMI. The irradiated area is identified using an anti-γH2AX antibody (red channel). MITF is detected with an anti-HA antibody (green channel). (B) Immunofluorescence of stable 501HA-MITF cells after NIR-LMI. The irradiated area is identified using an anti-γH2AX antibody (red channel). MITF is detected with an anti-HA antibody (green channel). DAPI was used to stain the nuclei. (C) Still images and quantification of live video-microscopy showing recruitment of MITF in 501mel cells stably expressing GFP-MITF after NIR-LMI. Cells were treated with DNA-PK (NU7441 – 1 µM) or PARP (Olaparib – 10 µM) inhibitors for 24 h before irradiation. The graphs represent the mean +/− SEM stripe/nucleus ratio over time. Values are normalized against the pre-LMI measurements. For clarity, each individual graph represents the same control curve (black) against only one type of inhibitor (DNAPKi in turquoise and PARPi in pink). The baselines are indicated with red dotted lines. (D - top) Diagram depicting the position of the bHLH-LZ domain of MITF and the position of the SUMOylation sites K182 and K316 (green), the phosphorylation site S325 (red) and the familial mutation E318K (pink). (D - bottom) Sequence of the 314–333 peptide showing residues K316, E318 and S325 are conserved from Human to Zebrafish. (E) Western blot of HEK293 cells transiently transfected with various mutants of HA-MITF or the corresponding empty vector. Phosphorylation of MITF on Serine 325 was detected by a phospho-specific antibody. GAPDH was used a loading control. (F) In vitro kinase assay performed on a peptide array. Peptide-bound anti-pS325 antibodies were detected using chemiluminescence. The size and intensity of the dots are proportional to the amount of bound antibodies. The kinases used are indicated above. (G) Western blot of HEK293 cells transiently transfected with HA-MITF. Cells were UV-irradiated and harvested at different time points to measure phosphorylation of S325. The ATM inhibitors KU55933 was used to confirm the role of the kinase. GAPDH was used a loading control. (H - Left) Still images of GFP-MITF recruitment in stable 501GFP-MITF WT, S325 and E318 mutants cell lines after LMI. Nuclei are delimited using the pre-irradiation images. The positions of the irradiated lines are indicated with an arrow. (H - Right) Quantification. The graph represents the mean +/− SEM stripe/nucleus ratio over time. Values are normalized against the pre-LMI measurements. The baseline is indicated with a red dotted line. (I) Details of GFP-MITF behaviour in stable 501GFP-MITF WT, S325 and E318 mutants cell lines after LMI. Quantification of GFP intensities at (stripes) and away from the LMI sites (nuclei). The graph represents the mean +/− SEM GFP fluorescence over time. Values are normalized against the pre-LMI measurements. The dotted lines represent the key values as described in (J). The baselines are indicated with red dotted lines. (J) Key values extracted from the quantification in (I). Stripe – time at/above 100% intensity represents the time GFP fluorescent remained equal or above 1 after LMI; stripe – time to decrease to 80% intensity represents the time required to see the GFP intensity at the stripe drop to 80% of the pre-LMI value from the time of irradiation; stripe – from 100% to 80% represents the time required to see the GFP intensity at the stripe drop to 80% of the pre-LMI value after it started to decrease; nucleus – time to decrease to 70% intensity represents the time required to see the GFP intensity away from the stripe drop to 70% of the pre-LMI value. (K) Still images of GFP-MITF behaviour in stable 501GFP-MITF wild type, S325 and E318 mutants cell lines after LMI as quantified in i. Nuclei are delimited using the pre-irradiation images.
Figure 5.
Figure 5.
Effects of S325 and E318 mutations on MITF-mediated genome instability. (A) Immunofluorescence images (top) and quantification (bottom) of the formation of RAD51 foci after IR (X-rays, 2 Gy) in U2-OS cells transfected with HA-MITF WT (grey/black), S325A (purple), S235E (gold), or E318K (red) or the corresponding empty vector (white). Cells were fixed and processed at the indicated times after IR. The p-values were computed using the paired Wilcoxon Rank Sum test. ns: non-significant; *: p<0.05; **: p<0.01; ****: p<0.0001. The medians are indicated in red. (B - left) Still images of MRE11-GFP LMI in the presence of MITF WT, E318K mutants or the corresponding empty vector. Nuclei are delimited using the pre-irradiation images. The positions of the irradiated lines are indicated with an arrow. (B - right) Quantification MRE11-GFP recruitment. The graph represents the mean +/− SEM stripe/nucleus ratio over time. Values are normalized against the pre-LMI measurements. The baseline is indicated with a red dotted line. (C - left) Still images of MRE11-GFP LMI in the presence of MITF WT, S325A or S325E mutants. Nuclei are delimited using the pre-irradiation images. The positions of the irradiated lines are indicated with an arrow. (C - right) Quantification MRE11-GFP recruitment. The graph represents the mean +/− SEM stripe/nucleus ratio over time. Values are normalized against the pre-LMI measurements. The baseline is indicated with a red dotted line. (D) Graph expressing the percentage of ongoing forks (OF)/new origins (NO) and stalled replication forks (SF) in 501mel cells overexpressing MITF WT (black), E318K (red) or the corresponding empty vector (grey). P-values were determined using Fisher’s exact test. p(MITF WT)= 2.461506e-06; p(E318K)= 1.605343e-20. EMPTY HA and MITF WT are the same as in Fig. 1H. (E) Graph expressing the percentage of ongoing forks (OF)/new origins (NO) and stalled replication forks (SF) in 501mel cells overexpressing MITF WT (black), S325A (purple), S325E (gold) or the corresponding empty vector (grey). P-values were determined using Fisher’s exact test. p(MITF WT)= 6.942773e-07; p(S325A)= 6.332160e-02; p(S325E)= 2.172679e-07.
Figure 6.
Figure 6.
The impact of MITF expression on HR-mediated repair. In cells that do not express MITF (left panel), the MRN complex senses DNA damage, binds to DSBs, and then activates ATM to amplify the DDR and trigger repair by HRR. In melanocytes and melanoma cells (middle panel), the initial recruitment of MRN coincides with the detachment of MITF transcription co-factors. MITF is phosphorylated by ATM and DNA-PK and interacts with NBS1-RAD50 but not MRE11, destabilising the MRN complex. As a result, the rate of MRN recruitment is decreased, slowing down the DDR amplification step and the subsequent HR-mediated repair. Later, MITF is degraded, and the MRN complex is restored. The delay in MRN recruitment is emphasized in cells expressing the mutated MITF-E318K (right panel) because the resulting protein is more stable and more slowly degraded. The overall consequence of a delayed HRR is an increased risk of genome instability and mutational burden.

References

    1. Ahrabi S, Sarkar S, Pfister SX, Pirovano G, Higgins GS, Porter AC, Humphrey TC. 2016. A role for human homologous recombination factors in suppressing microhomology-mediated end joining. Nucleic Acids Res 44: 5743–5757. - PMC - PubMed
    1. Baggiolini A, Callahan SJ, Montal E, Weiss JM, Trieu T, Tagore MM, Tischfield SE, Walsh RM, Suresh S, Fan Y et al. 2021. Developmental chromatin programs determine oncogenic competence in melanoma. Science 373: eabc1048. - PMC - PubMed
    1. Beck M, Schmidt A, Malmstroem J, Claassen M, Ori A, Szymborska A, Herzog F, Rinner O, Ellenberg J, Aebersold R. 2011. The quantitative proteome of a human cell line. Mol Syst Biol 7: 549. - PMC - PubMed
    1. Beishline K, Kelly CM, Olofsson BA, Koduri S, Emrich J, Greenberg RA, Azizkhan-Clifford J. 2012. Sp1 facilitates DNA double-strand break repair through a nontranscriptional mechanism. Mol Cell Biol 32: 3790–3799. - PMC - PubMed
    1. Bekes M, Prudden J, Srikumar T, Raught B, Boddy MN, Salvesen GS. 2011. The dynamics and mechanism of SUMO chain deconjugation by SUMO-specific proteases. J Biol Chem 286: 10238–10247. - PMC - PubMed

Publication types