[Preprint]. 2023 May 15:2023.04.17.537251.
doi: 10.1101/2023.04.17.537251.

"Metformin Impairs Intestinal Fructose Metabolism"

Affiliations

"Metformin Impairs Intestinal Fructose Metabolism"

Wenxin Tong et al. bioRxiv. .

Abstract

Objective: To investigate the effects of metformin on intestinal carbohydrate metabolism in vivo.

Method: Male mice preconditioned with a high-fat, high-sucrose diet were treated orally with metformin or a control solution for two weeks. Fructose metabolism, glucose production from fructose, and production of other fructose-derived metabolites were assessed using stably labeled fructose as a tracer.

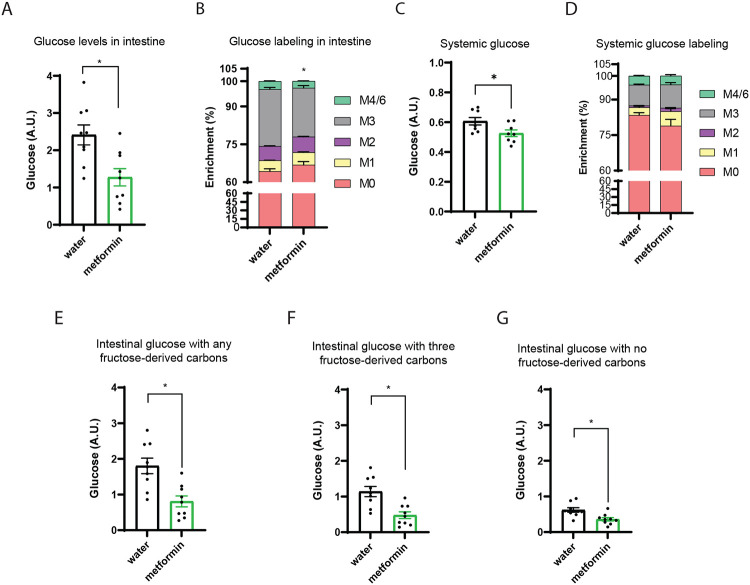
Results: Metformin treatment decreased intestinal glucose levels and reduced incorporation of fructose-derived metabolites into glucose. This was associated with decreased intestinal fructose metabolism as indicated by decreased enterocyte F1P levels and diminished labeling of fructose-derived metabolites. Metformin also reduced fructose delivery to the liver. Proteomic analysis revealed that metformin coordinately down-regulated proteins involved carbohydrate metabolism including those involved in fructolysis and glucose production within intestinal tissue.

Conclusion: Metformin reduces intestinal fructose metabolism, and this is associated with broad-based changes in intestinal enzyme and protein levels involved in sugar metabolism indicating that metformin's effects on sugar metabolism are pleiotropic.

Keywords: Metformin; fructose metabolism; glucose production; isotope-tracing metabolomics; proteomics.


Figures

Figure 1.
Figure 1.. Short-term metformin treatment improves glucose tolerance without reducing body weight and fasting glycemia levels.
(A) Body weight before and after metformin versus water treatment. (B) Fasting glycemia levels after 2 weeks of treatment. (C - D) Intraperitoneal glucose tolerance test after 2 weeks of treatment. Data represent means ± SEM. n=9 per group * p<0.05; ** p<0.01; *** p<0.001. Analysis performed via paired student-t test.
Figure 2.
Figure 2.. Short-term metformin treatment is sufficient to decrease fructose catabolism in the intestinal tissue and fructose delivery to the liver.
(A) Diagram showing the fructose catabolism pathways within enterocytes. (B) Relative quantity of fructose 1-phosphate, and enrichment of (C) glyceraldehyde 3-phosphate, and (D) glycerate in the intestinal tissue 30 minutes after fructose gavage in mice treated with water versus metformin for 2 weeks. (E) Absolute fructose levels measured in the portal blood. (F) Relative quantification of fructose 1-phosphate and (G) glyceraldehyde 3-phosphate in the liver tissue after fructose gavage. 0.1 nmol M6-Fructose 6-phosphate and 4 nmol M2-fructose were used as internal standard for the measurement of fructose 1-phosphate and fructose respectively. Norvaline was used as the internal standard for the measurement of glyceraldehyde 3-phosphate, and glycerate. Data represent means ± SEM. * p<0.05; ** p<0.01; *** p<0.001. Analysis performed via paired student-t test.
Figure 3.
Figure 3.. Short-term metformin treatment reduces glucose production from fructose in intestinal tissue.
(A) Relative glucose levels and (B) the enrichment of glucose with labeled fructose tracer in intestinal tissue. (C) Relative circulating glucose and (D) enrichment of glucose measured in tail vein plasma. The levels of glucose with (E) any, (F) three, and (G) no carbons derived from fructose in intestinal tissue. 2 nmol 2-Deoxu-D-glucose (2DG) was used as internal standard for the measurement of glucose. Data represent means ± SEM. * p<0.05; ** p<0.01; *** p<0.001. Analysis performed via paired student-t test.
Figure 4.
Figure 4.. Short-term metformin treatment reduces production of intestinal TCA cycle intermediates from fructose.
The enrichment of (A) succinate, (B) malate, and (C) citrate in intestinal tissue 30 minutes after fructose gavage in mice treated with water versus metformin for 2 weeks. The enrichment of (D) succinate, (E) malate, and (F) citrate in the portal plasma after fructose gavage. Relative quantification of TCA cycle metabolites in the (G) intestinal tissue, and (H) portal circulation. Norvaline was used as the internal standard for these measurements. Data represent means ± SEM. * p<0.05; ** p<0.01; *** p<0.001. Analysis performed via paired student-t test.
Figure 5.
Figure 5.. Proteomics demonstrates down-regulation of proteins involved in carbohydrate metabolism in intestinal tissue.
(A) Principal component analysis of quantitative proteomics data generated from the intestinal tissue samples of mice treated with water versus metformin. (B) Volcano plot and (C) K-means clustering of differentially abundant proteins in the intestinal tissue samples from water versus metformin groups. (D) Pathway analysis using proteins that are significantly down-regulated in the intestinal tissue samples of metformin versus water group. (E) Significantly altered protein levels in the gluconeogenesis pathway as well as key hexose transporters and fructolytic enzymes. Analysis performed in R using data generated from Proteome Discoverer.
Figure 6.
Figure 6.. Short-term metformin treatment impacts mitochondrial components and activates AMPK signaling.
(A) Metformin reduces protein levels of components of the electron transport chain in intestinal tissue. (B) Principal component analysis using proteins annotated in the AMPK signaling pathway (KEGG: mmu04152). (C-D) Intestinal protein abundance in AMPK signaling pathway in water versus metformin group. (E-F) Western blot and quantification of the expression levels of AMPKα and phospho-AMPKα T172. Analysis within panel A and B was performed with R using data generated from Proteome Discoverer. Data in panel F represent as means ± SEM and paired student-t test was used for statistical analysis. * p<0.05; ** p<0.01; *** p<0.001.

References

    1. Sanchez-Rangel E., Inzucchi S.E., 2017. Metformin: clinical use in type 2 diabetes. Diabetologia 60(9):1586–1593. - PubMed
    1. Yerevanian A., Soukas A.A., 2019. Metformin: Mechanisms in Human Obesity and Weight Loss. Curr Obes Rep 8(2):156–164. - PMC - PubMed
    1. Lin H.Z., Yang S.Q., Chuckaree C., Kuhajda F., Ronnet G., Diehl A.M., 2000. Metformin reverses fatty liver disease in obese, leptin-deficient mice. Nat Med 6(9):998–1003. - PubMed
    1. Farr S.A., Roesler E., Niehoff M.L., Roby D.A., McKee A., Morley J.E., 2019. Metformin Improves Learning and Memory in the SAMP8 Mouse Model of Alzheimer's Disease. J Alzheimers Dis 68(4):1699–1710. - PubMed
    1. Cerezo M., Tichet M., Abbe P., Ohanna M., Lehraiki A., Rouaud F., et al., 2013. Metformin blocks melanoma invasion and metastasis development in AMPK/p53-dependent manner. Mol Cancer Ther 12(8):1605–1615. - PubMed

Publication types