[Preprint]. 2023 Apr 19:2023.04.16.23288531.
doi: 10.1101/2023.04.16.23288531.

Distinct baseline immune characteristics associated with responses to conjugated and unconjugated pneumococcal polysaccharide vaccines in older adults

Affiliations

Distinct baseline immune characteristics associated with responses to conjugated and unconjugated pneumococcal polysaccharide vaccines in older adults

Sathyabaarathi Ravichandran et al. medRxiv. .

Update in

Abstract

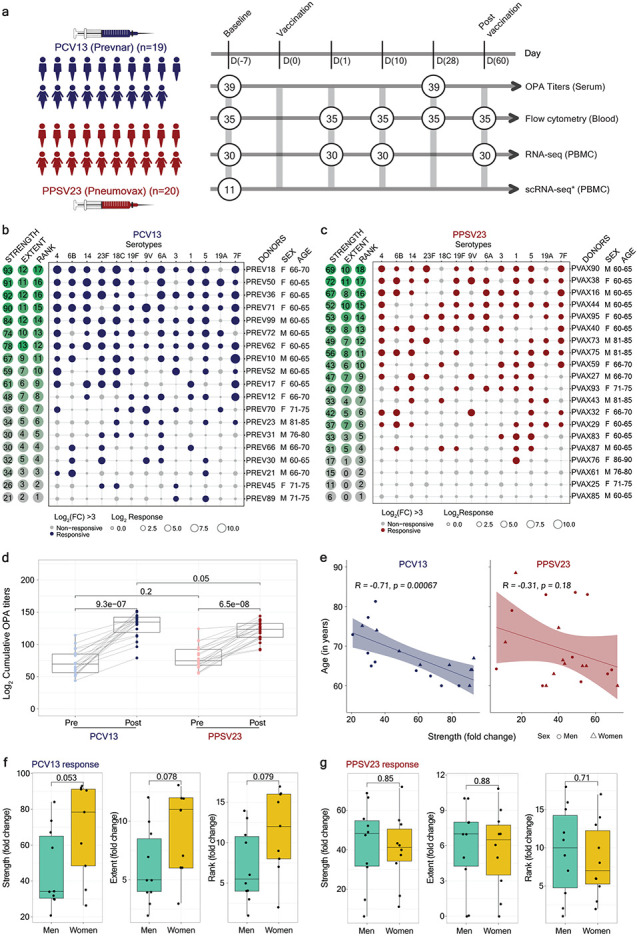
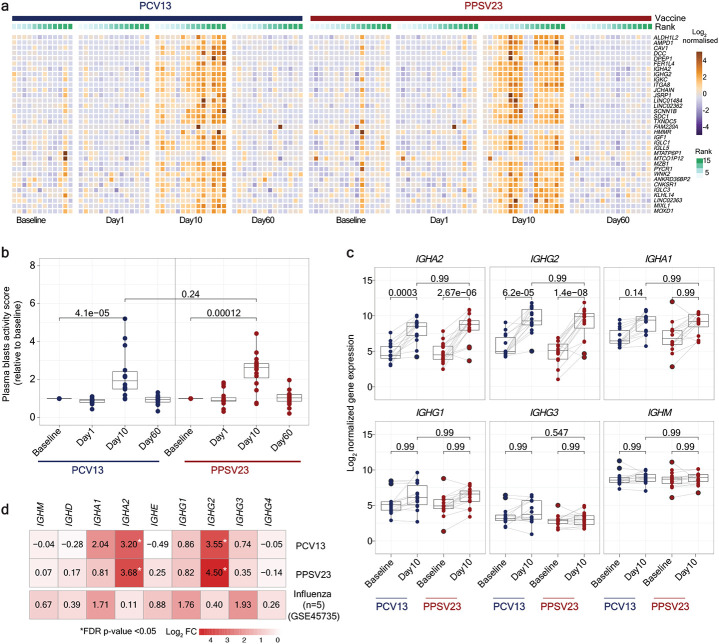
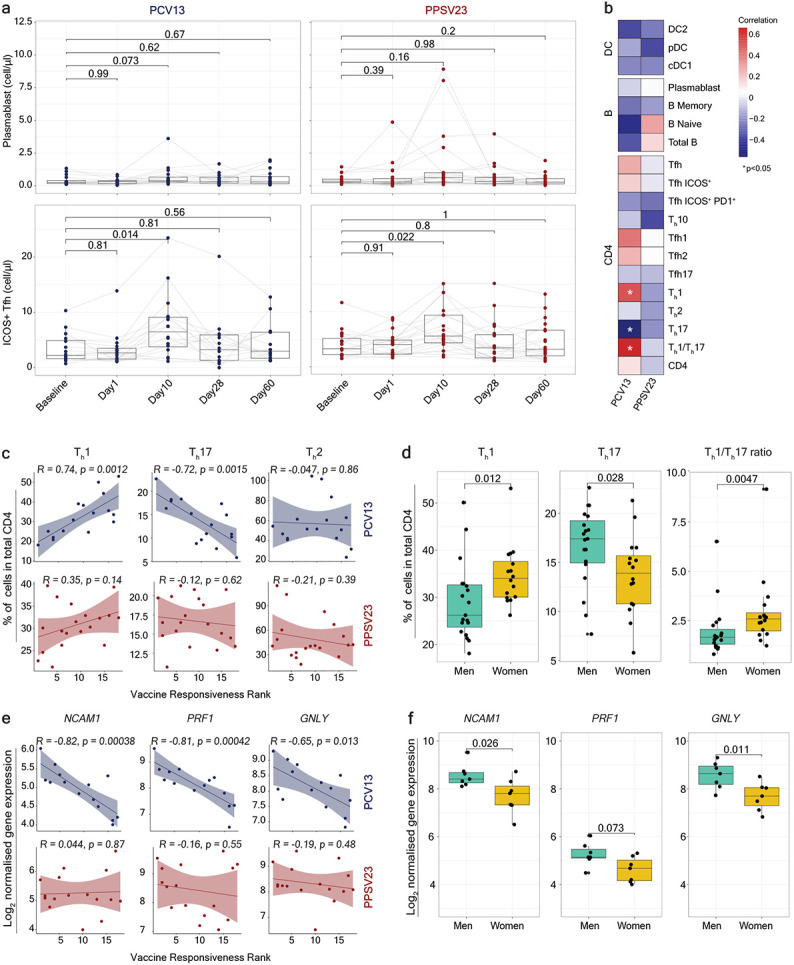
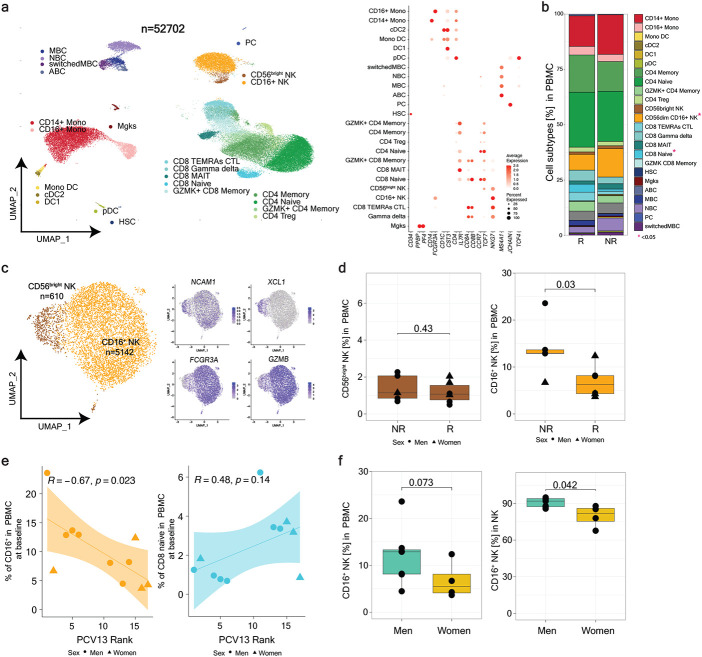
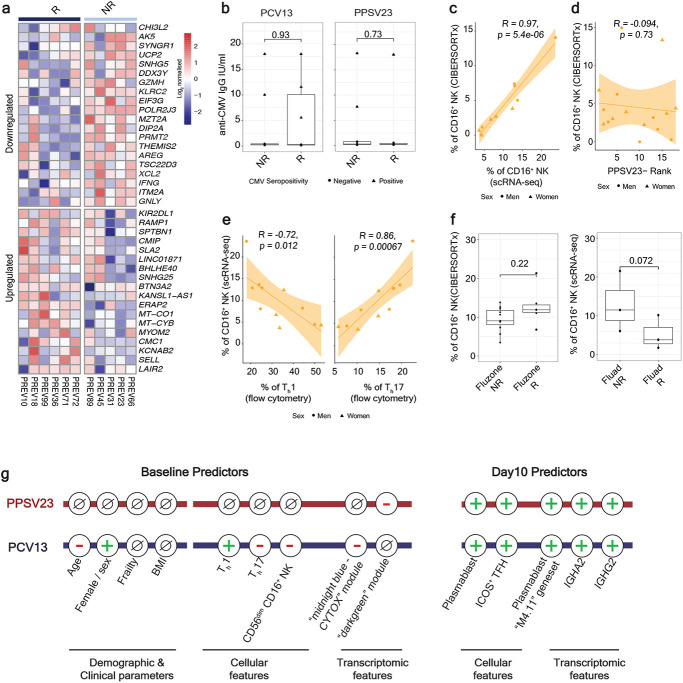
Pneumococcal infections cause serious illness and death among older adults. A capsular polysaccharide vaccine PPSV23 (Pneumovax®) and a conjugated polysaccharide vaccine PCV13 (Prevnar®) are used to prevent these infections, yet underlying responses, and baseline predictors remain unknown. We recruited and vaccinated 39 older adults (>60 years) with PPSV23 or PCV13. Both vaccines induced strong antibody responses at day 28 and similar plasmablast transcriptional signatures at day 10, however, their baseline predictors were distinct. Analyses of baseline flow cytometry and RNA-seq data (bulk and single cell) revealed a novel baseline phenotype that is specifically associated with weaker PCV13 responses, characterized by i) increased expression of cytotoxicity-associated genes and increased CD16+ NK frequency; ii) increased Th17 and decreased Th1 cell frequency. Men were more likely to display this cytotoxic phenotype and mounted weaker responses to PCV13 than women. Baseline expression levels of a distinct gene set was predictive of PPSV23 responses. This first precision vaccinology study for pneumococcal vaccine responses of older adults uncovered novel and distinct baseline predictors that might transform vaccination strategies and initiate novel interventions.


Figures

Figure 1:
Figure 1:. Functional antibody response to PCV13 and PPSV23 in older adults.
a) Schematic representation of the study design. 9 women and 10 men received PCV13 vaccine, and 10 women and 10 men received PPSV23. OPA titers for the 13 serotypes were assessed from serum samples obtained 7 days prior to vaccination (baseline), and 28 days post-vaccination, for both vaccines. Anticoagulated blood samples were used for flow cytometric analysis of whole blood cell populations. PBMCs (Peripheral Blood Mononuclear Cells) were isolated for bulk RNA-seq. Pre-vaccination PBMCs from 4 women and 7 men who received PCV13 were isolated for scRNA-sequencing. Numbers in circles represent total number of samples processed for the indicated assay at the indicated time. b) Bubble plot of fold change (FC) in antibody titers for individual serotypes in response to PCV13. c) Bubble plot of FC in antibody titers for individual serotypes in response to PPSV23. Size of the dots represent the FC value, and color indicates significant response (Log2 FC is > 3), with blue for PCV13 and red for PPSV23. Donors are ordered from top to bottom according to the vaccine response Rank. On the left side, the Strength (Log2 Sum FC), the Extent of the response (number of serotypes out of 13 to which an individual mounted significant response) and Rank are presented. d) Pre-vaccination and post-vaccination cumulative OPA titers (expressed as sum Log2). e) Correlation analysis between the cumulative FC (Sum Log2 FC) and age (in years). Sex-specific differences in the Strength, Extent and Rank in donors who received PCV13 (f) and PPSV23 (g). The Wilcoxon matched-pairs signed-rank test was used in (d) to compare Pre- and Post-vaccination titers in PCV13 and PPSV23. Wilcoxon Rank sum test was used to compare the Strength, Extent and Rank between men and women in PCV13 and PPSV23. The Pearson correlation metric was used to perform correlation analysis between Strength and age (e).
Figure 2:
Figure 2:. Plasmablasts response elicited upon vaccination at Day 10 in PBMCs.
a) Heatmap of differentially expressed genes between Day 10 and baseline, using normalized gene expression values. b) Boxplot of plasmablasts activity scores at baseline, Day 1, Day 10, and Day 60, calculated using a published gene set (M4.11) , and scaled with reference to baseline. c) Boxplots of normalized expression of genes coding for the constant region of immunoglobulin heavy chain structure. d) Heatmap showing differential expression of genes coding for the constant region of immunoglobulin heavy chain structure at Day 10 in response to PCV13, PPSV23, and Day 7 in response to Fluzone (GSE45735 - Influenza vaccine). Genes with a fold change >1.5-fold difference and FDR corrected p-value <0.05 are marked with a star. The Wilcoxon Rank sum test was used to compare plasma cell activity scores between baseline and Day 1, Day 10, and Day 60 (b). The Wilcoxon matched-pairs signed-rank test was used to compare the expression of immunoglobulin genes at baseline and Day 10 for PCV13 and PPSV23. FDR corrected p-value is shown (c).
Figure 3:
Figure 3:. Baseline Th1/Th17 cell ratio and cytotoxic gene expression are predictive of PCV13 vaccine responsiveness Rank.
a) Longitudinal analysis of the absolute number of plasmablasts(cells/ul) (top panel) and ICOS+ Tfh(cells/ul) cells (bottom panel) among the memory CD4+ T cell population in response to PCV13 and PPSV23. b) Correlation analysis between the absolute number of the different cell types (DCs, B and CD4 subsets) analyzed in whole blood and Ranks. c) Correlation analysis between Ranks and frequency of Th1, Th17, and Th1/Th17 ratio evaluated at baseline. d) Sex differences in the frequency of Th1, Th17 and Th1/Th17 at baseline. Th1 and Th17 cell frequency were calculated relative to the total CD4 Tcell count. e) Correlation analysis between baseline expression of cytotoxic genes (NCAM1, GNLY, and PRF1) and PCV13 vaccine responsiveness Rank (top panel). Correlation analysis between baseline expression of cytotoxic genes (NCAM1, GNLY, and PRF1) and PPSV23 vaccine responsiveness Rank (bottom panel). f) Sex differences in the expression of NCAM1, PRF1 and GNLY at baseline. The Wilcoxon matched-pairs signed-rank test was used to compare the absolute numbers of plasmablasts and ICOS+ Tfh longitudinally (a). Correlation analysis was performed using the Pearson correlation metric (b,c,e).
Figure 4:
Figure 4:. CD16+ NK cell frequency in PBMCs is negatively associated with PCV13 vaccine responses.
a) Uniform manifold approximation and projection (UMAP) of PBMCs from 11 PCV13 donors (responders (R)=6 and non-responders (NR)= 5) showing 24 clusters from 52,702 cells, colored by immune cell type. Immune subsets were identified in a supervised manner. Lineage markers are shown in the dot plot. b) Stacked bar plot of immune cell frequency in R and NR. The cell types with significant differences in their frequency between R and NR are marked with a red star (p-value < 0.05). c) UMAP of NK subsets with feature plot showing the expression NCAM1, XCL1, FCGR3A and GZMB in blue, highlighting the two NK populations: CD56dim CD16+ NK and CD56bright NK. d) Boxplots of CD16+ NK and CD56bright NK frequency in R and NR. e) Correlation analysis between PCV13 Rank and pre-vaccination frequency of CD16+ NK and CD8+ Naïve T cells. f) Sex differences in the pre-vaccination percentages CD16+ NK in total PBMC and in total NK. The Wilcoxon Rank sum test was used to compare cell percentages between R and NR (b, d), and CD16+ NK percentages between men and women (f). Correlation was computed using the Pearson correlation metric (e).
Figure 5:
Figure 5:. Increased cytotoxicity in the CD16+ NK cells of PCV13 non-responders.
a) Heatmap of the differentially expressed genes in the CD16+ NK cells of PCV13 responders (R) and non-responders (NR) at baseline, using the normalized expression values from the scRNA-seq pseudobulk analysis. b) Boxplots comparing anti-CMV IgG titers between R and NR for PCV13 (left) and PPSV23 (right). c) Correlation analysis of pre-vaccination CD16+ NK percentages estimated by scRNA-seq and CIBERSORTx. d) Correlation analysis of CIBERSORTx based estimates of CD16+ NK and PPSV23-Rank (n=16) at baseline. e) Correlation analysis CD16+ NK percentages determined by scRNA-seq, and Th1 and Th17 percentages determined using flow cytometric analysis, at baseline. f) Boxplots of pre-vaccination CD16+ NK percentages in FluAd-R(n=3) and NR(n=3), and Fluzone TIV R(n=5) and NR(n=11). g) Summary schema showing the demographic, clinical, cellular and transcriptomic parameters associated with PCV13 and PPSV23 vaccine responsiveness at baseline and Day 10. The Wilcoxon Rank sum test was used to compare the mean of anti-CMV IgG titers between R and NR of PCV13 and PPSV13 donors (b), pre-vaccination CD16+ NK percentages in FluAd-R and NR, and Fluzone R and NR (f). Correlation analysis was computed using Pearson correlation metric (c, d, e).

Similar articles

References

    1. Novak R, Tuomanen E. Pathogenesis of pneumococcal pneumonia. Semin Respir Infect. 1999;14(3):209–17. Epub 1999/09/29. - PubMed
    1. Huang SS, Johnson KM, Ray GT, Wroe P, Lieu TA, Moore MR, Zell ER, Linder JA, Grijalva CG, Metlay JP, Finkelstein JA. Healthcare utilization and cost of pneumococcal disease in the United States. Vaccine. 2011;29(18):3398–412. Epub 2011/03/15. doi:10.1016/j.vaccine.2011.02.088. - DOI - PubMed
    1. Robinson KA, Baughman W, Rothrock G, Barrett NL, Pass M, Lexau C, Damaske B, Stefonek K, Barnes B, Patterson J, Zell ER, Schuchat A, Whitney CG, Active Bacterial Core Surveillance/Emerging Infections Program N. Epidemiology of invasive Streptococcus pneumoniae infections in the United States, 1995-1998: Opportunities for prevention in the conjugate vaccine era. JAMA. 2001;285(13):1729–35. Epub 2001/04/13. doi:10.1001/jama.285.13.1729. - DOI - PubMed
    1. McCool TL, Harding CV, Greenspan NS, Schreiber JR. B-and T-cell immune responses to pneumococcal conjugate vaccines: divergence between carrier-and polysaccharide-specific immunogenicity. Infection and immunity. 1999;67(9):4862–9. - PMC - PubMed
    1. Mishra RP, Yadav RS, Jones C, Nocadello S, Minasov G, Shuvalova LA, Anderson WF, Goel A. Structural and immunological characterization of E. coli derived recombinant CRM197 protein used as carrier in conjugate vaccines. Bioscience reports. 2018;38(5). - PMC - PubMed

Publication types