

This is a preprint.
Design principles of Cdr2 node patterns in fission yeast cells
- PMID: 37131752
- PMCID: PMC10153186
- DOI: 10.1101/2023.04.19.537536
Design principles of Cdr2 node patterns in fission yeast cells
Update in
-
Design principles of Cdr2 node patterns in fission yeast cells.Mol Biol Cell. 2023 Oct 1;34(11):br18. doi: 10.1091/mbc.E23-04-0135. Epub 2023 Aug 23. Mol Biol Cell. 2023. PMID: 37610834 Free PMC article.
Abstract
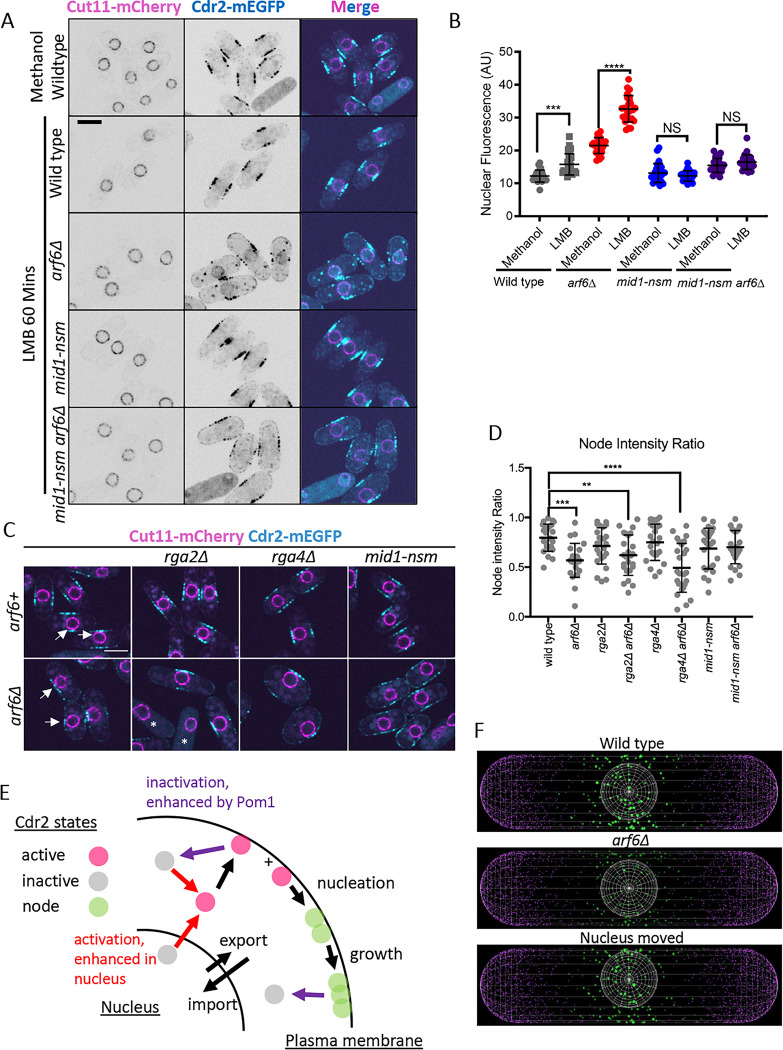
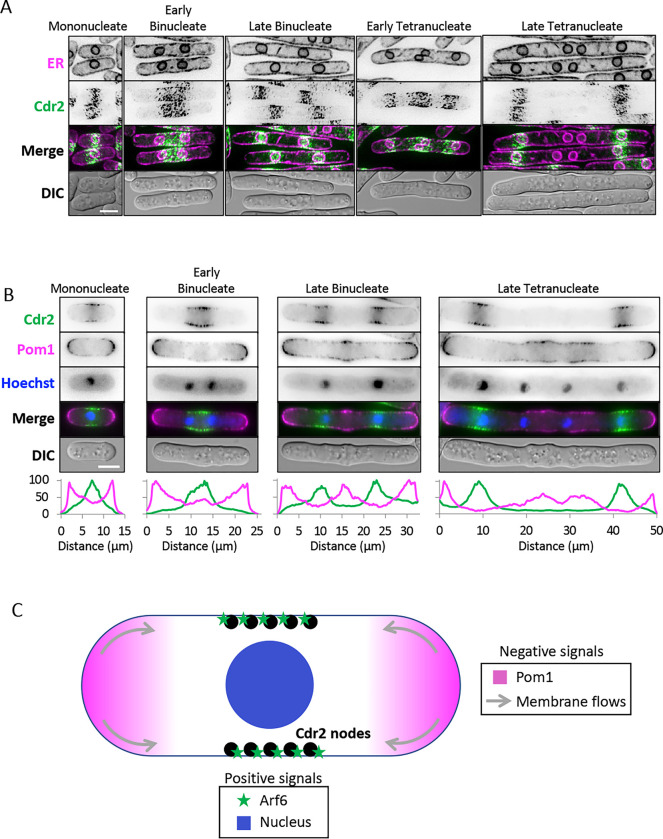
Pattern forming networks have diverse roles in cell biology. Rod-shaped fission yeast cells use pattern formation to control the localization of mitotic signaling proteins and the cytokinetic ring. During interphase, the kinase Cdr2 forms membrane-bound multiprotein complexes termed nodes, which are positioned in the cell middle due in part to the node inhibitor Pom1 enriched at cell tips. Node positioning is important for timely cell cycle progression and positioning of the cytokinetic ring. Here, we combined experimental and modeling approaches to investigate pattern formation by the Pom1-Cdr2 system. We found that Cdr2 nodes accumulate near the nucleus, and Cdr2 undergoes nucleocytoplasmic shuttling when cortical anchoring is reduced. We generated particle-based simulations based on tip inhibition, nuclear positioning, and cortical anchoring. We tested model predictions by investigating Pom1-Cdr2 localization patterns after perturbing each positioning mechanism, including in both anucleate and multinucleated cells. Experiments show that tip inhibition and cortical anchoring alone are sufficient for the assembly and positioning of nodes in the absence of the nucleus, but that the nucleus and Pom1 facilitate the formation of unexpected node patterns in multinucleated cells. These findings have implications for spatial control of cytokinesis by nodes and for spatial patterning in other biological systems.
Figures


Similar articles
-
Design principles of Cdr2 node patterns in fission yeast cells.Mol Biol Cell. 2023 Oct 1;34(11):br18. doi: 10.1091/mbc.E23-04-0135. Epub 2023 Aug 23. Mol Biol Cell. 2023. PMID: 37610834 Free PMC article.
-
Pom1 regulates the assembly of Cdr2-Mid1 cortical nodes for robust spatial control of cytokinesis.J Cell Biol. 2014 Jul 7;206(1):61-77. doi: 10.1083/jcb.201311097. Epub 2014 Jun 30. J Cell Biol. 2014. PMID: 24982431 Free PMC article.
-
Distinct levels in Pom1 gradients limit Cdr2 activity and localization to time and position division.Cell Cycle. 2014;13(4):538-52. doi: 10.4161/cc.27411. Epub 2013 Dec 6. Cell Cycle. 2014. PMID: 24316795
-
Mid1/anillin and the spatial regulation of cytokinesis in fission yeast.Cytoskeleton (Hoboken). 2012 Oct;69(10):764-77. doi: 10.1002/cm.21056. Epub 2012 Aug 20. Cytoskeleton (Hoboken). 2012. PMID: 22888038 Review.
-
Contractile-ring assembly in fission yeast cytokinesis: Recent advances and new perspectives.Cytoskeleton (Hoboken). 2012 Oct;69(10):751-63. doi: 10.1002/cm.21052. Epub 2012 Aug 23. Cytoskeleton (Hoboken). 2012. PMID: 22887981 Free PMC article. Review.
References
-
- Almonacid M, Moseley JB, Janvore J, Mayeux A, Fraisier V, Nurse P, and Paoletti A (2009). Spatial control of cytokinesis by Cdr2 kinase and Mid1/anillin nuclear export. Curr Biol 19, 961–966. - PubMed
-
- Andrews SS (2017). Smoldyn: particle-based simulation with rule-based modeling, improved molecular interaction and a library interface. Bioinformatics 33, 710–717. - PubMed
-
- Bähler J, Wu JQ, Longtine MS, Shah NG, McKenzie A, Steever AB, Wach A, Philippsen P, and Pringle JR (1998). Heterologous modules for efficient and versatile PCR-based gene targeting in Schizosaccharomyces pombe. Yeast 14, 943–951. - PubMed
Publication types
Grants and funding
LinkOut - more resources
Full Text Sources