[Preprint]. 2023 Apr 21:2023.04.20.537752.
doi: 10.1101/2023.04.20.537752.

The Promise and Pitfalls of Prophages

Affiliations

The Promise and Pitfalls of Prophages

Jody C McKerral et al. bioRxiv. .

Abstract

Phages dominate every ecosystem on the planet. While virulent phages sculpt the microbiome by killing their bacterial hosts, temperate phages provide unique growth advantages to their hosts through lysogenic conversion. Many prophages benefit their host, and prophages are responsible for genotypic and phenotypic differences that separate individual microbial strains. However, the microbes also endure a cost to maintain those phages: additional DNA to replicate and proteins to transcribe and translate. We have never quantified those benefits and costs. Here, we analysed over two and a half million prophages from over half a million bacterial genome assemblies. Analysis of the whole dataset and a representative subset of taxonomically diverse bacterial genomes demonstrated that the normalised prophage density was uniform across all bacterial genomes above 2 Mbp. We identified a constant carrying capacity of phage DNA per bacterial DNA. We estimated that each prophage provides cellular services equivalent to approximately 2.4 % of the cell's energy or 0.9 ATP per bp per hour. We demonstrate analytical, taxonomic, geographic, and temporal disparities in identifying prophages in bacterial genomes that provide novel targets for identifying new phages. We anticipate that the benefits bacteria accrue from the presence of prophages balance the energetics involved in supporting prophages. Furthermore, our data will provide a new framework for identifying phages in environmental datasets, diverse bacterial phyla, and from different locations.


Figures

Figure 1:
Figure 1:
(a) Joint distribution for the prophage and bacterial genome lengths across all 574,609 complete genomes in GenBank. (b) Imbalances in size and the number of genomes isolated (c) Joint distribution for the prophage and bacterial genome sizes per lysogen across taxonomically balanced genomes.
Figure 2:
Figure 2:
(a) Prophage concentration against base pairs of bacteria, showing the total number of prophages (solid line) or density of base pairs of prophage (dashed) amongst lysogens in a taxonomically dereplicated genome set. (b) The size distribution of individual prophages across the dereplicated GTDB genomes as a histogram (blue bars) and a KDE distribution (red line). (c) KDE distributions for individual prophage sizes across the top 5 most abundant species in the database: from top to bottom in the legend Salmonella Enterica, Campylobacter jejuni, Listeria monocytogenes, Listeria monocytogenes_B, Streptococcus pneumoniae. (d) KDE distributions of individual prophage sizes from 80,000 Salmonella enterica genomes.
Figure 3:
Figure 3:
Time trends in prophages. Dates indicate when a genome was isolated or sequenced (for MAGs). (a) Scatterplot of the number of prophages in each genome against the isolation date. (b) Joint KDE for the density of prophages in each genome over time. (c) The total number of genomes that are non-lysogens found over time. (d) A plot of the average density of prophages in a phylum’s genomes compared to the first discovery of an organism from that phylum. (e) Scatterplot of the proportion of DNA with positive hits to the VOG database against the number of base pairs in a genome identified as possible prophage by the machine learning step in PhiSpy. The size and colour of each point correspond to the year the phylum was first isolated, whereby small, light points denote recent events, and large, dark circles denote older events.
Figure 4:
Figure 4:
Country and taxonomic signatures for sampling effort. The heatmap shows the top 26 sampled phyla under the GTDB taxonomy and the top 15 contributing countries to Genbank across the 76,070 genomes containing country metadata. The colour scale (log) indicates the number of genome assemblies processed.
Figure 5:
Figure 5:
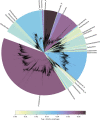
Average prophage density per phylum, visualised across the entire phylogenetic tree from the GTDB taxonomy (Parks et al. 2020, 2022), showing the substantial variation in viral DNA genome content across different phylogenetic groups. The standard deviation of the densities is approximately proportional to the mean density (Fig. S6).

References

    1. Akhter Sajia, Aziz Ramy K., and Edwards Robert A. 2012. “PhiSpy: A Novel Algorithm for Finding Prophages in Bacterial Genomes That Combines Similarity- and Composition-Based Strategies.” Nucleic Acids Research 40 (16): e126. - PMC - PubMed
    1. Aziz Ramy K., Breitbart Mya, and Edwards Robert A. 2010. “Transposases Are the Most Abundant, Most Ubiquitous Genes in Nature.” Nucleic Acids Research 38 (13): 4207–17. - PMC - PubMed
    1. Beattie D., Lachnit T., and Dinsdale E. 2017. “Novel SsDNA Viruses Detected in the Virome of Bleached, Habitat-Forming Kelp Ecklonia Radiata.” Frontiers in Marine 4: 441.
    1. Bobay Louis-Marie, and Ochman Howard. 2017. “The Evolution of Bacterial Genome Architecture.” Frontiers in Genetics 8 (May): 72. - PMC - PubMed
    1. Bobay Louis-Marie, Touchon Marie, and Rocha Eduardo P. C. 2014. “Pervasive Domestication of Defective Prophages by Bacteria.” Proceedings of the National Academy of Sciences of the United States of America 111 (33): 12127–32. - PMC - PubMed

Publication types