. 2023 Feb 16;3(3):100288.
doi: 10.1016/j.xops.2023.100288. eCollection 2023 Sep.

Genome-wide Association Studies of Retinal Vessel Tortuosity Identify Numerous Novel Loci Revealing Genes and Pathways Associated With Ocular and Cardiometabolic Diseases

Affiliations

Genome-wide Association Studies of Retinal Vessel Tortuosity Identify Numerous Novel Loci Revealing Genes and Pathways Associated With Ocular and Cardiometabolic Diseases

Mattia Tomasoni et al. Ophthalmol Sci. .

Abstract

Purpose: To identify novel susceptibility loci for retinal vascular tortuosity, to better understand the molecular mechanisms modulating this trait, and reveal causal relationships with diseases and their risk factors.

Design: Genome-wide Association Studies (GWAS) of vascular tortuosity of retinal arteries and veins followed by replication meta-analysis and Mendelian randomization (MR).

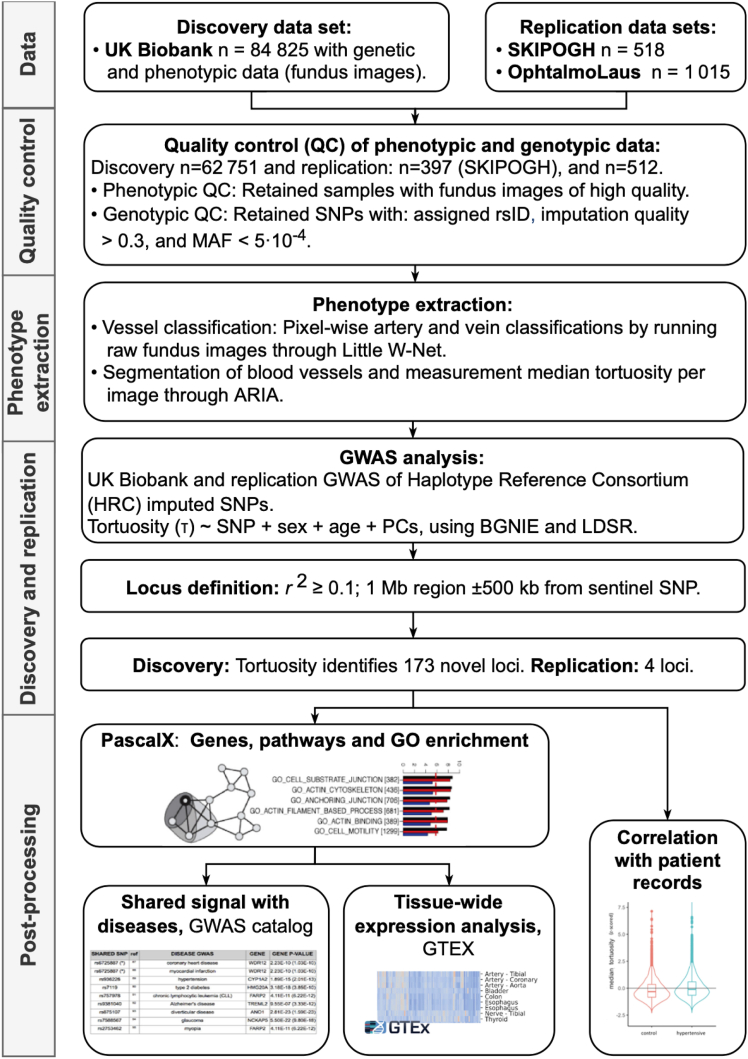
Participants: We analyzed 116 639 fundus images of suitable quality from 63 662 participants from 3 cohorts, namely the UK Biobank (n = 62 751), the Swiss Kidney Project on Genes in Hypertension (n = 397), and OphtalmoLaus (n = 512).

Methods: Using a fully automated retina image processing pipeline to annotate vessels and a deep learning algorithm to determine the vessel type, we computed the median arterial, venous and combined vessel tortuosity measured by the distance factor (the length of a vessel segment over its chord length), as well as by 6 alternative measures that integrate over vessel curvature. We then performed the largest GWAS of these traits to date and assessed gene set enrichment using the novel high-precision statistical method PascalX.

Main outcome measure: We evaluated the genetic association of retinal tortuosity, measured by the distance factor.

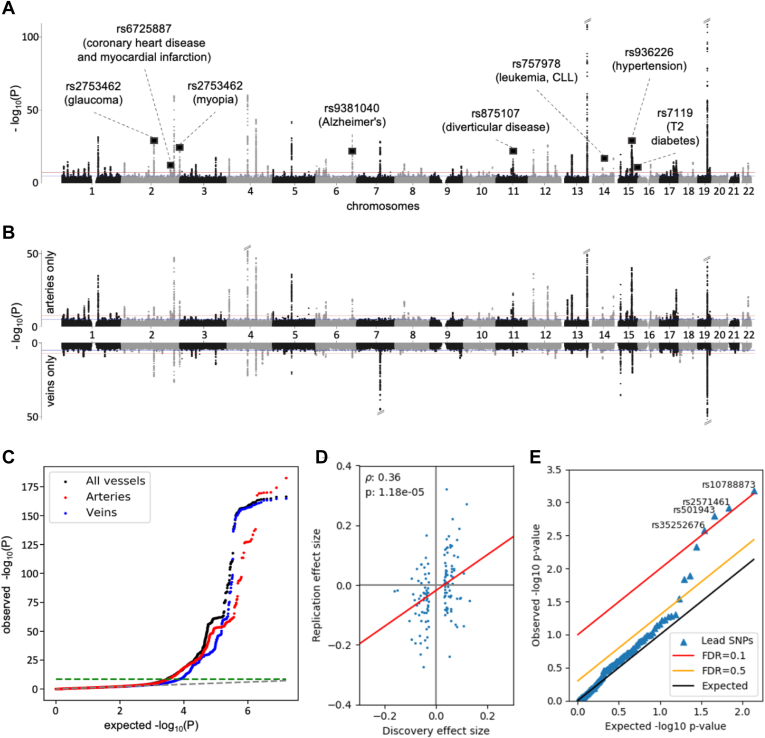
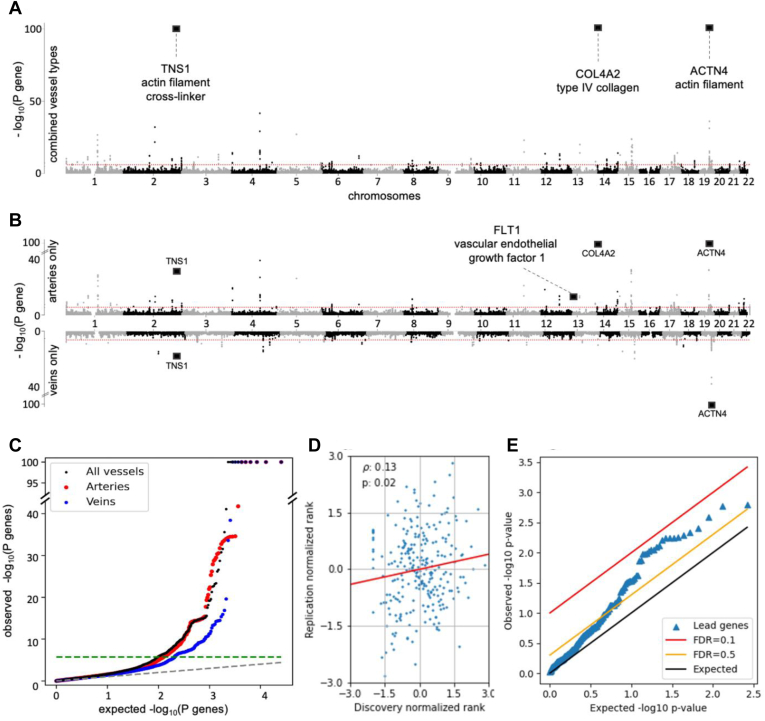
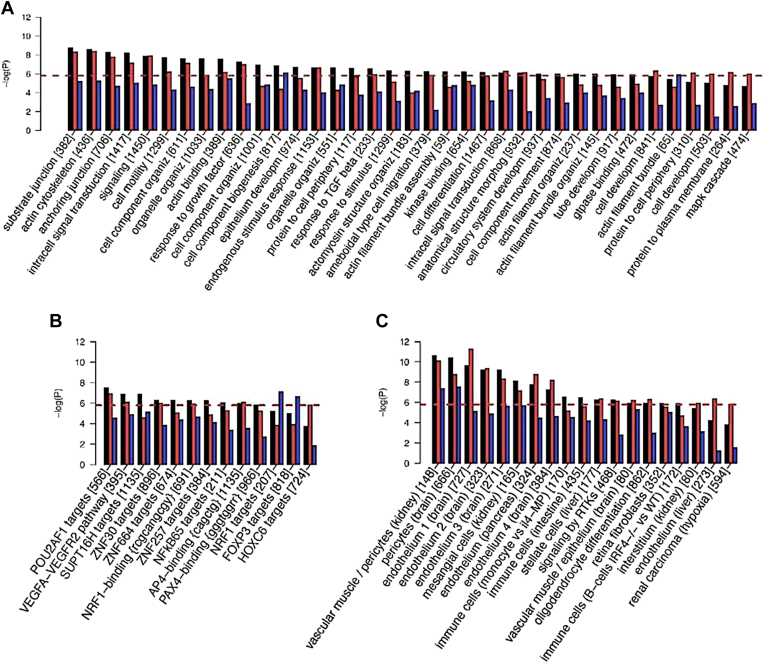
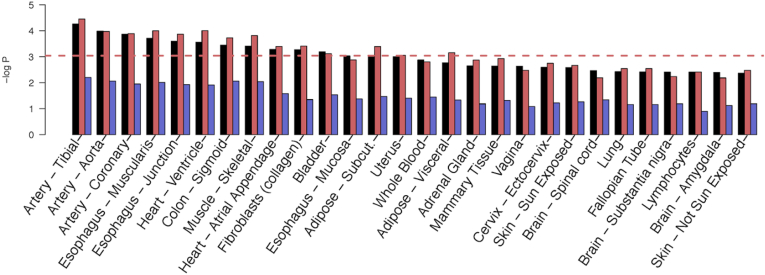
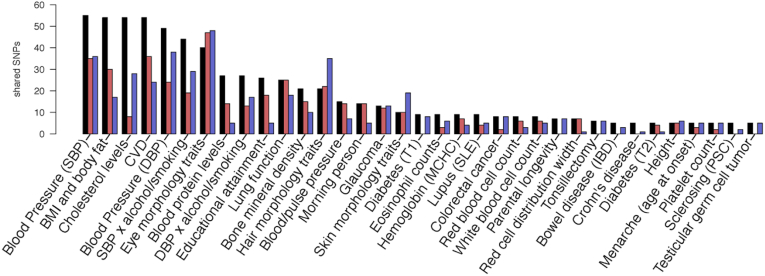
Results: Higher retinal tortuosity was significantly associated with higher incidence of angina, myocardial infarction, stroke, deep vein thrombosis, and hypertension. We identified 175 significantly associated genetic loci in the UK Biobank; 173 of these were novel and 4 replicated in our second, much smaller, metacohort. We estimated heritability at ∼25% using linkage disequilibrium score regression. Vessel type specific GWAS revealed 116 loci for arteries and 63 for veins. Genes with significant association signals included COL4A2, ACTN4, LGALS4, LGALS7, LGALS7B, TNS1, MAP4K1, EIF3K, CAPN12, ECH1, and SYNPO2. These tortuosity genes were overexpressed in arteries and heart muscle and linked to pathways related to the structural properties of the vasculature. We demonstrated that retinal tortuosity loci served pleiotropic functions as cardiometabolic disease variants and risk factors. Concordantly, MR revealed causal effects between tortuosity, body mass index, and low-density lipoprotein.

Conclusions: Several alleles associated with retinal vessel tortuosity suggest a common genetic architecture of this trait with ocular diseases (glaucoma, myopia), cardiovascular diseases, and metabolic syndrome. Our results shed new light on the genetics of vascular diseases and their pathomechanisms and highlight how GWASs and heritability can be used to improve phenotype extraction from high-dimensional data, such as images.

Financial disclosures: The author(s) have no proprietary or commercial interest in any materials discussed in this article.

Keywords: GWAS; Mendelian randomization; Microvasculature; Retina; Tortuosity.


Figures

Figure 1
Figure 1
Pipeline and results. Relevant phenotypes, genotypes, and fundus images were collected from the UK Biobank, OphtalmoLaus, and the Swiss Kidney Project on Genes in Hypertension (SKIPOGH). After quality control, the images were processed by deep learning, classifying arteries and veins. A range of tortuosity measures were then calculated which provided the phenotypes for the genome-wide association studies (GWASs). The primary results were 173 novel genetic trait loci. These associations include signals which were shared between retinal tortuosity and several diseases (metabolic syndrome and cardiovascular diseases). Their aggregation on annotated gene-sets identified relevant pathways and gene ontology (GO) terms. Tissue-wide expression analysis revealed expression in the arteries and heart. Correlation analysis revealed associations between retinal tortuosity and cardiometabolic diseases. LDSR = linkage disequilibrium score regression; MAF = minor allele frequency; PC = principle component; SNPs = single nucleotide polymorphisms.
Figure 2
Figure 2
Single nucleotide polymorphism (SNP) P-values and effects. A, Manhattan plot of Genome-Wide Association Study (GWAS) of retinal vessel tortuosity, combining all vessel types (both arteries and veins). The red line indicates the genome-wide significance level after Bonferroni correction (P = 5 × 10−8). Oblique dashes on top of peaks mark extremely significant P-values that have been cropped. Squares mark the position of disease SNPs (Table 4). The trait was corrected for phenotypic variables which showed a statistically significant association, i.e.: age, sex, and a subset of principal components of genotypes. B, Manhattan plots of the vessels-specific GWAS (artery-specific on top, vein-specific at the bottom). Confounder correction, significance level and cropping of extremely significant P-values as in the (A). C, GWAS q-q plot: arteries in red, veins in blue, combined-vessels signal in black; the genome-wide significance level is represented as a green dashed line. D, Statistically significant correlation between the measured effect sizes in the discovery cohort (UK Biobank [UKBB], n = 62 751) and replication metacohort (the Swiss Kidney Project on Genes in Hypertension plus OphtalmoLaus, n = 911). We considered all lead (independent) SNPs in the UKBB. We tested all 136 SNPs with matching rsIDs in the replication metacohort except 1 censored outlier (rs187691758), 89 of which had the same sign of their effect size estimate in the UKBB. The resulting Pearson correlation is r = 0.36; P = 1.18 × 10−5. E, Benjamini-Hochberg procedure on discovery lead SNPs from the UKBB yields 4 hits in the replication cohort using false discovery rate (FDR) = 0.2.
Figure 3
Figure 3
Gene P-values and replication scores. A, Gene-based Manhattan plot of retinal vessel tortuosity, combining all vessel types (both arteries and veins). Two hundred three genes were significant in arteries, 123 in genes, and 265 when combining the vessel types. Gene-based tests were computed by PascalX. The red line indicates the genome-wide significance level after Bonferroni correction (P = 5 × 10−8). Squares mark the position of particularly relevant genes (see corresponding Results section). B, Gene-based Manhattan plots of the vessels-specific genome-wide association study (artery-specific on top, vein-specific at the bottom). C, q-q plot of gene P-values: arteries in red, veins in blue, combined-vessel signal in black; the genome-wide significance level is represented as a green dashed line. D, Statistically significant correlation between q-q normalized genes’ P-values in the discovery (UK Biobank) and in the replication metacohort (the Swiss Kidney Project on Genes in Hypertension + OphtalmoLaus). Only genes that were significant in the discovery cohort were considered. The resulting Pearson correlation is r = 0.13 (P = 0.02). E, Benjamini-Hochberg procedure replicates 58 hits at false discovery rate (FDR) = 0.5 in the replication metacohort. We used a candidate approach, meaning only genes that were significant in the discovery cohort were considered.
Figure 4
Figure 4
Enriched pathways and gene-sets. Arteries in red, veins in blue, combined-vessel signal in black: scores for 31 120 gene-sets in MSigDB (v7.2) were calculated by PascalX. Only gene-sets for which significance was reached by ≥ 1 genome-wide association study are shown. The red dashed line indicates Bonferroni-threshold (−log10P = 5.7). The number of genes in each set is indicated in squared brackets. Gene-set names have been shortened and some redundant gene ontology (GO) categories are not shown. For details, refer to the extended plot in Supplemental Text 13. A, Enrichment in GO categories. B, Enrichment in pathways referring to a particular molecule (typically a transcription factor) or binding motif. C, Enrichment in gene-set obtained from transcriptomic analysis of tissues of treated cell types. TGF = transforming growth factor.
Figure 5
Figure 5
Tissue expression results. Arteries in red, veins in blue, combined-vessel signal in black: tissue-specific gene expression analysis of GTEx (version 8) performed using PascalX. We defined sets based on the significant genes from each of the 3 genome-wide association studies we carried out and asked whether they were over-expressed in a particular tissue. Only top tissues are shown here, for full results refer to Fig S19.
Figure 6
Figure 6
Overlap in genetic signals with diseases and other complex traits. Arteries in red, veins in blue, combined-vessel signal in black: number of variants shared with other traits reported in the genome-wide association study Catalog (also considering single nucleotide polymorphisms [SNPs] in high linkage disequilibrium with the lead SNP, r2 > 0.8). Only traits with ≥ 5 shared associations are included (for a full list, including rsIDs, refer to the Supplemental Dataset 3). The traits with the highest number of shared SNPs belong to metabolic syndrome (blood pressure, body mass index [BMI], blood cholesterol levels) and cardiovascular disease (CVD). This analysis was generated using functional mapping and annotation of genetic associations (FUMA). DBP = diastolic blood pressure; IBD = inflammatory bowel disease; MCHC = mean corpuscular hemoglobin concentration; PSC = primary sclerosing cholangitis; SBP = systolic blood pressure; SLE = systemic lupus erythematosus; SNP = single nucleotide polymorphism; T1 = type 1; T2 = type 2.

References

    1. Wilkins E., Wilson L., Wickramasinghe K., et al. 2017. European cardiovascular disease statistics 2017.https://researchportal.bath.ac.uk/en/publications/european-cardiovascula...
    1. Federal Statistical Office . Bundesamt für Statistik (BFS); 2021. Cause of Death Statistics.
    1. Rana J.S., Khan S.S., Lloyd-Jones D.M., Sidney S. Changes in mortality in top 10 causes of death from 2011 to 2018. J Gen Intern Med. 2021;36:2517–2518. - PMC - PubMed
    1. Díaz-Coránguez M., Ramos C., Antonetti D.A. The inner blood-retinal barrier: cellular basis and development. Vis Res. 2017;139:123–137. - PMC - PubMed
    1. Klaassen I., Van Noorden C.J.F., Schlingemann R.O. Molecular basis of the inner blood-retinal barrier and its breakdown in diabetic macular edema and other pathological conditions. Prog Retin Eye Res. 2013;34:19–48. - PubMed

LinkOut - more resources