. 2023 May 10;290(1998):20230106.
doi: 10.1098/rspb.2023.0106. Epub 2023 May 3.

A 2200-year record of Andean Condor diet and nest site usage reflects natural and anthropogenic stressors

Affiliations

A 2200-year record of Andean Condor diet and nest site usage reflects natural and anthropogenic stressors

Matthew P Duda et al. Proc Biol Sci. .

Abstract

Understanding how animals respond to large-scale environmental changes is difficult to achieve because monitoring data are rarely available for more than the past few decades, if at all. Here, we demonstrate how a variety of palaeoecological proxies (e.g. isotopes, geochemistry and DNA) from an Andean Condor (Vultur gryphus) guano deposit from Argentina can be used to explore breeding site fidelity and the impacts of environmental changes on avian behaviour. We found that condors used the nesting site since at least approximately 2200 years ago, with an approximately 1000-year nesting frequency slowdown from ca 1650 to 650 years before the present (yr BP). We provide evidence that the nesting slowdown coincided with a period of increased volcanic activity in the nearby Southern Volcanic Zone, which resulted in decreased availability of carrion and deterred scavenging birds. After returning to the nest site ca 650 yr BP, condor diet shifted from the carrion of native species and beached marine animals to the carrion of livestock (e.g. sheep and cattle) and exotic herbivores (e.g. red deer and European hare) introduced by European settlers. Currently, Andean Condors have elevated lead concentrations in their guano compared to the past, which is associated with human persecution linked to the shift in diet.

Keywords: birds; condor; diet; nest; palaeoecology; volcano.


Conflict of interest statement

The authors declare there are no competing interests.

Figures

Figure 1.
Figure 1.
Map of the condor nesting site relative to major volcanoes, alongside photographs and photomicrographs of the Andean Condor deposit. (a) Map of South America, highlighting the Southern Volcanic Zone (SVZ) in red and the location of the Andean Condor deposit with a yellow star. (b) Locations of major, active volcanoes relative to the condor nesting site. Volcanoes in the P–C–C complex, Mocho-Choshuenco, Lanín, Quetrupillán and Villarrica. (c) Photograph of the Andean Condor nesting site, with a nestling condor (photo credit: Lorenzo Sympson, 16 June 2014). (d) Section of the deposit that was collected, about 25 cm in height. (e) Image showing the complex and irregular nature of hydrated phosphate layers forming the deposit walls. (f) Outline of the bone- and detrital grain-rich layers, which are lighter in colour and commonly deformed. (g) A magnified area of (f), illustrating the high concentration of bone fragments reflecting consumed carrion throughout the deposit.
Figure 2.
Figure 2.
Condor deposit dating profile, accumulation rate and proxies of nest buildup. (a) The modelled mean age–depth relationship, with 95% confidence intervals. (b) Changes in accumulation rate, with 95% confidence intervals. (c,d) Changes in the concentrations of Al and Ti, two conservative lithogenic elements. (e) Changes in the per cent relative abundance of the diatom Orthoseira spp., typically found on the rockfaces of caves. The grey bar indicates the period of inferred nesting frequency slowdown.
Figure 3.
Figure 3.
Proportions of the main sterol and stanol (expressed as relative percentages) and phosphorus concentrations (expressed as mg per gram dry weight) in the condor faeces and guano deposit. Zoosterols are represented in red and phytosterols are represented in green. Phosphorus, which is generally representative of nutrient inputs, is in grey. The horizontal grey bar indicates the period of inferred nesting frequency slowdown.
Figure 4.
Figure 4.
Volcano-related proxies and eruption history in the Southern Volcanic Zone (SVZ). (a–c) Geochemistry related to volcanic eruptions, including concentrations of sulfur, potassium and sodium. (d) A ratio of the diatoms Pinnularia borealis to Aulacoseria distans, representative of humidity around the nest site. (e) Known volcanic eruptions in the SVZ. The widths of the bars depict the Volcanic Explosivity Index (VEI) from the Smithsonian Institute [40]. The vertical grey bar indicates the period of inferred nesting frequency slowdown.
Figure 5.
Figure 5.
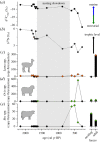
Temporal changes in proxies related to diet. (a,b) Shifts in the values of δ13Corg and δ15N, respectively. (c–e) Shifts in ddPCR-detected DNA presence (presented DNA copies per extraction) in the Condor guano deposit and faecal samples. Intervals that were measured but had no target species DNA are identified in black. Native fauna DNA (Lama spp.) are shown in orange and introduced fauna (Bos spp. and Ovis spp.) are in green. Faecal samples were collected near the nest and are thus shown independently from the rest of the deposit. The vertical grey bar indicates a potential volcano signal preserved in the deposit consistent in all proxies.
Figure 6.
Figure 6.
Temporal changes in potentially toxic metals. Intervals that were measured but were below the detection limit are identified in black. Faecal samples were collected near the nest and are thus shown independently from the rest of the deposit. The vertical grey bar indicates a potential volcano signal preserved in the deposit consistent in all proxies. The red line is the detection limit.

References

    1. Smol JP. 2019. Under the radar: long-term perspectives on ecological changes in lakes. Proc. R. Soc. B 286, 20190834. (10.1098/rspb.2019.0834) - DOI - PMC - PubMed
    1. Witmer GW. 2005. Wildlife population monitoring: some practical considerations. Wildl. Res. 32, 259-263. (10.1071/WR04003) - DOI
    1. Duda MP, Hargan KE, Michelutti N, Blais JM, Grooms C, Gilchrist HG, Mallory ML, Robertson GJ, Smol JP. 2021. Reconstructing long-term changes in avian populations using lake sediments: opening a window onto the past. Front. Ecol. Evol. 9, 698175. (10.3389/fevo.2021.698175) - DOI
    1. Latorre C, Betancourt JL, Rylander KA, Quade J. 2002. Vegetation invasions into absolute desert: a 45 000 yr rodent midden record from the Calama-Salar de Atacama basins, northern Chile (lat 22°–24°S). Bull. Geol. Soc. Am. 114, 349-366. (10.1130/0016-7606(2002)114<0349:VIIADA>2.0.CO;2) - DOI
    1. Selbie DT, Lewis BA, Smol JP, Finney BP. 2007. Long-term population dynamics of the endangered Snake River Sockeye Salmon: evidence of past influences on stock decline and impediments to recovery. Trans. Am. Fish Soc. 136, 800-821. (10.1577/T06-100.1) - DOI

Publication types

LinkOut - more resources