. 2023 Feb;23(2 Suppl 1):S379-S442.
doi: 10.1016/j.ajt.2023.02.009.

OPTN/SRTR 2021 Annual Data Report: Lung

Affiliations

OPTN/SRTR 2021 Annual Data Report: Lung

Maryam Valapour et al. Am J Transplant. 2023 Feb.

Abstract

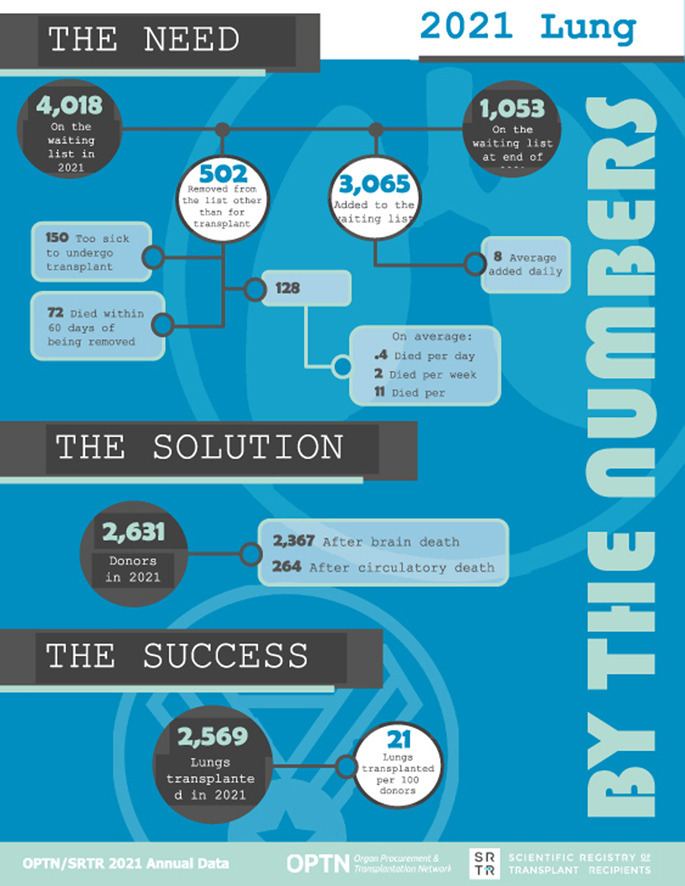
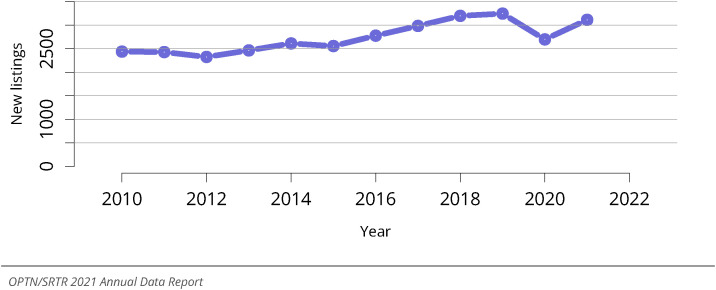
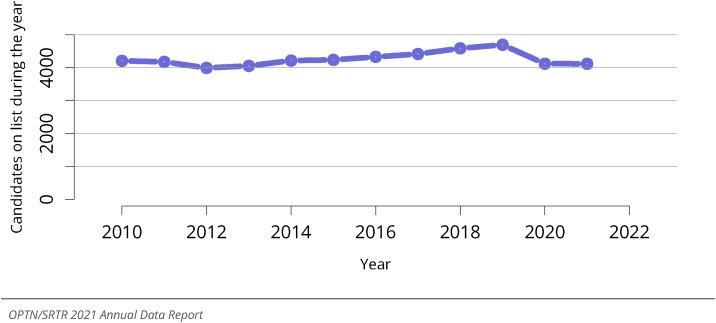
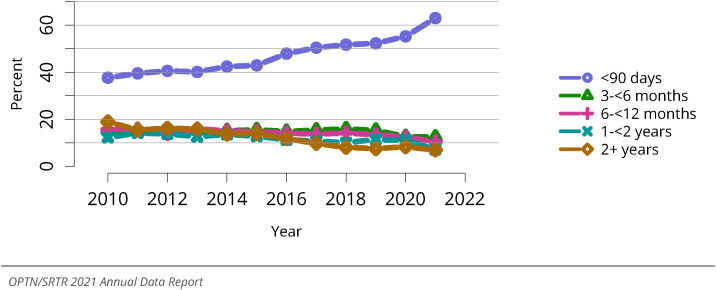
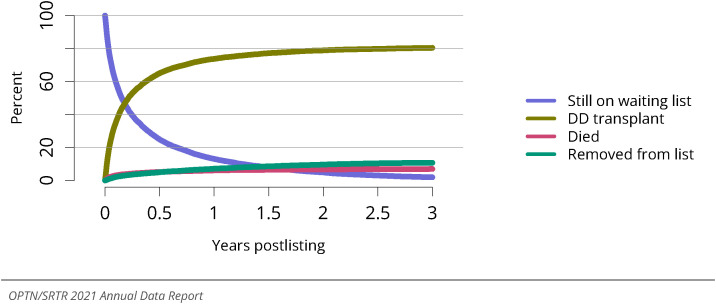
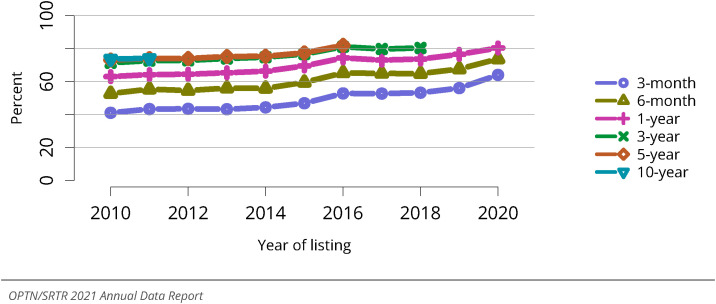
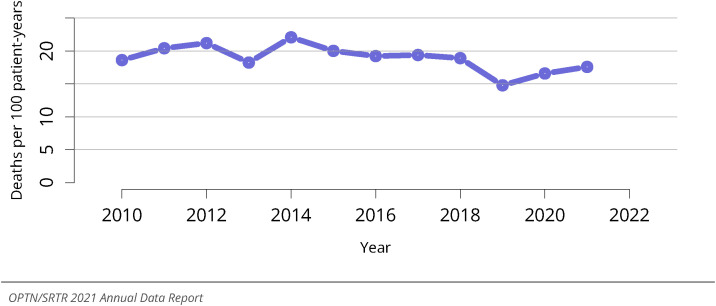
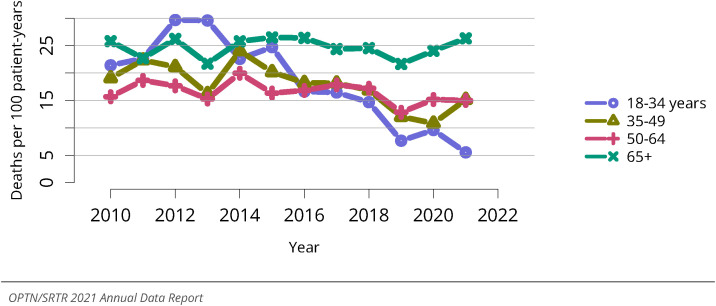
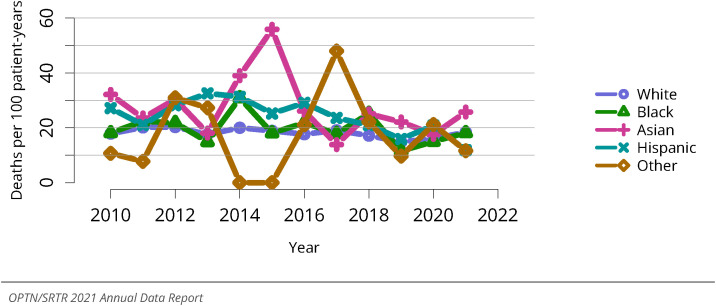
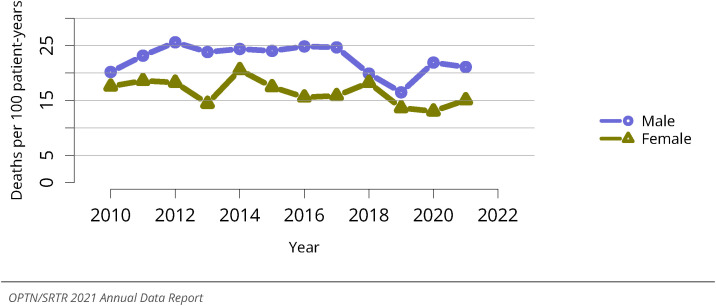
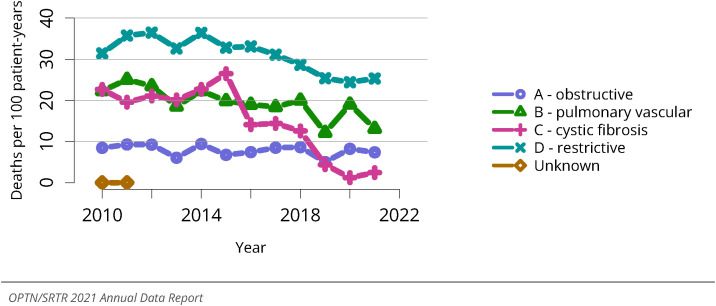
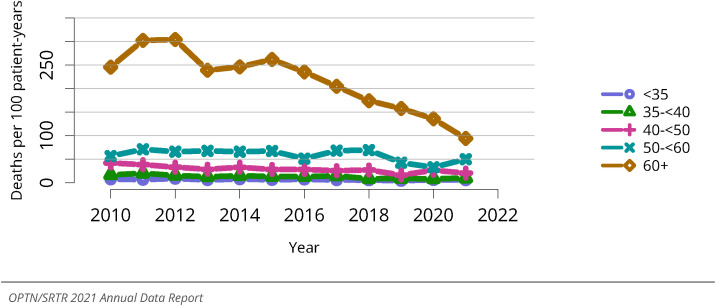
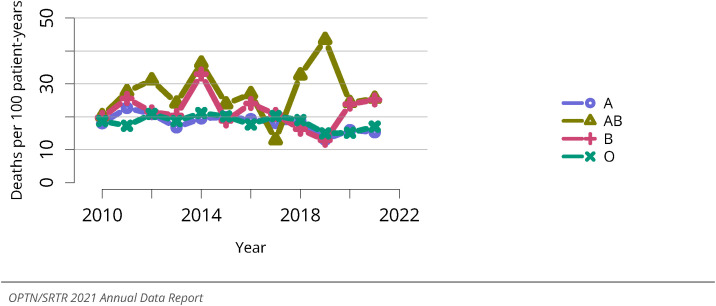
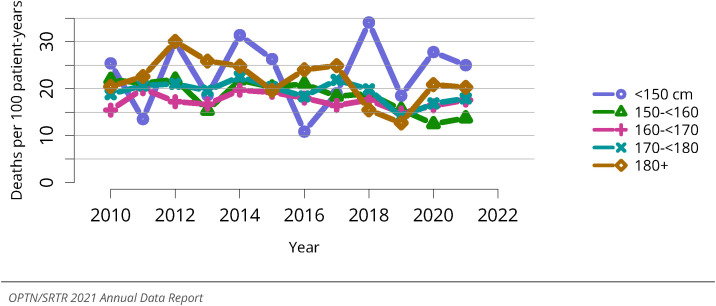
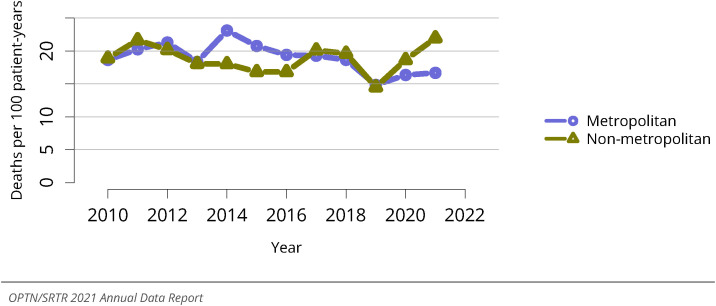
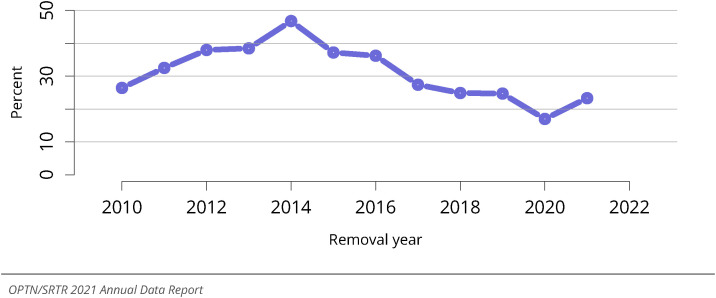
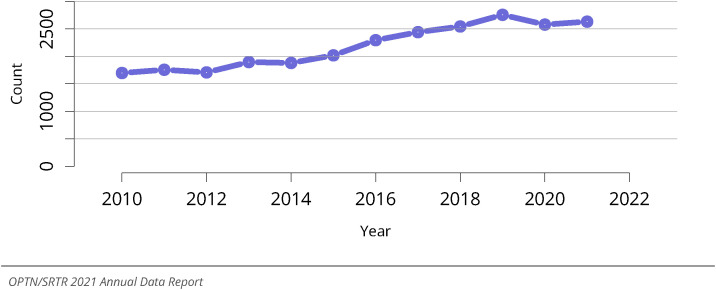
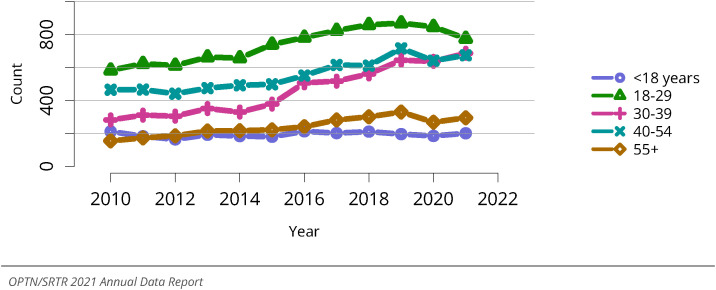
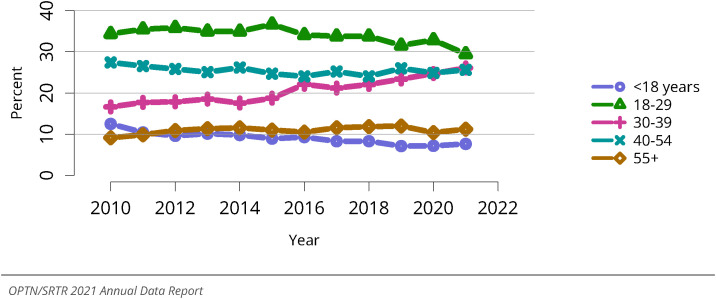
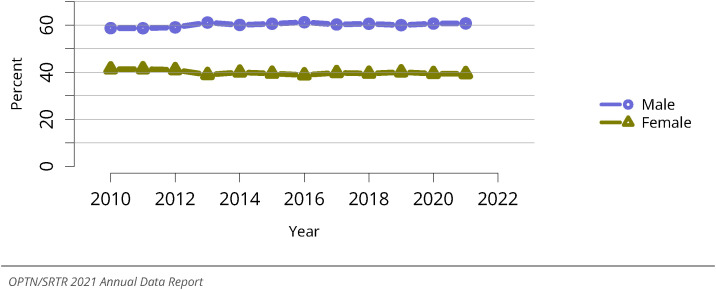
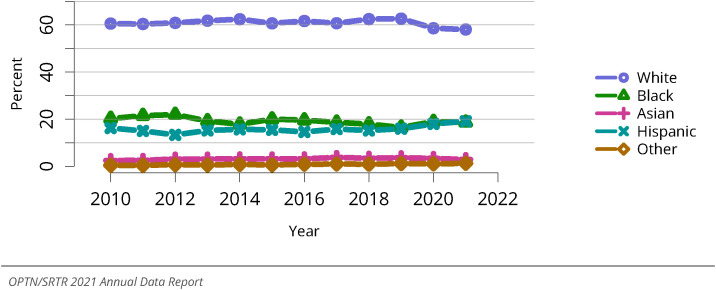
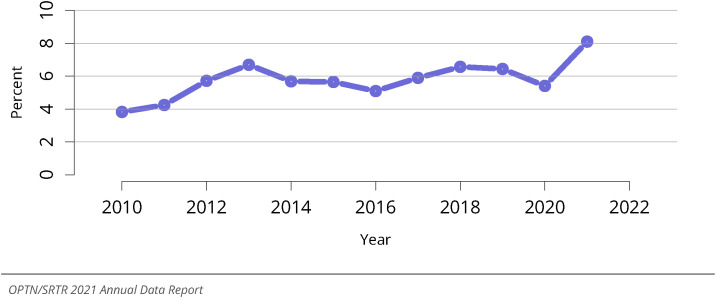
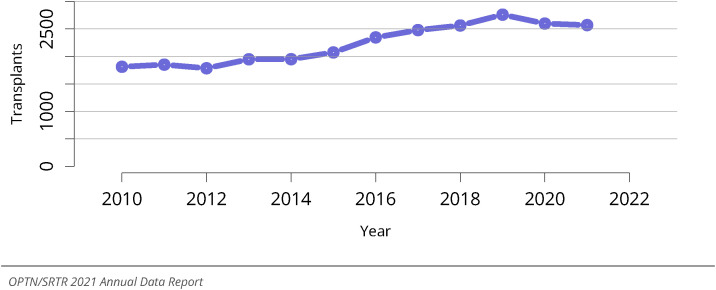
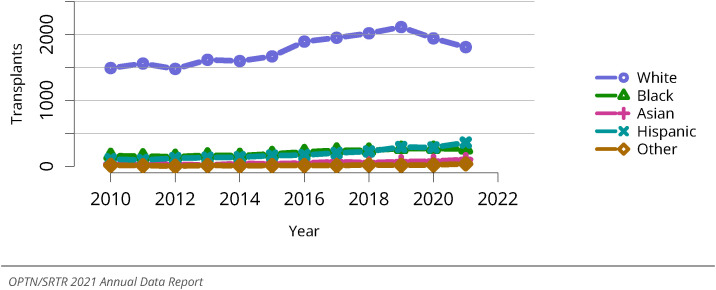
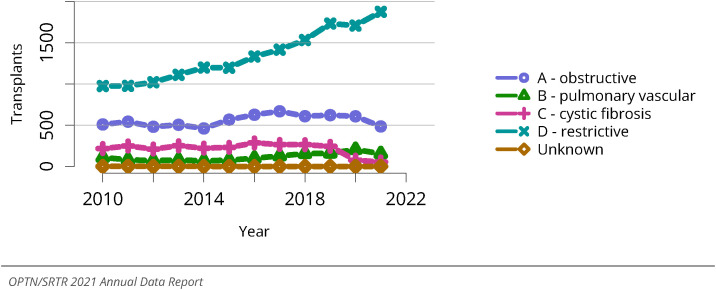
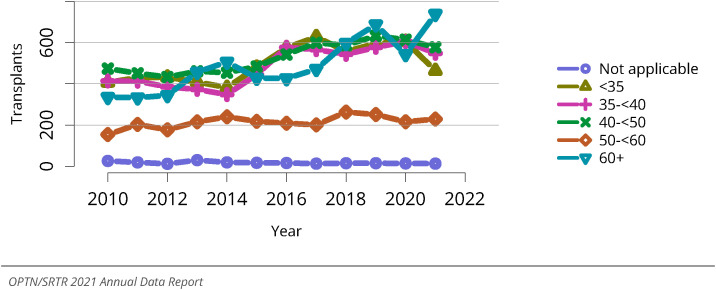
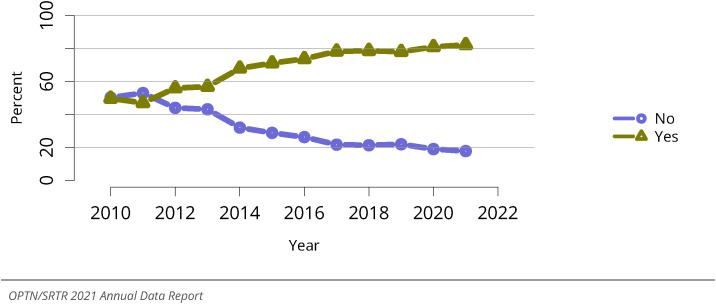
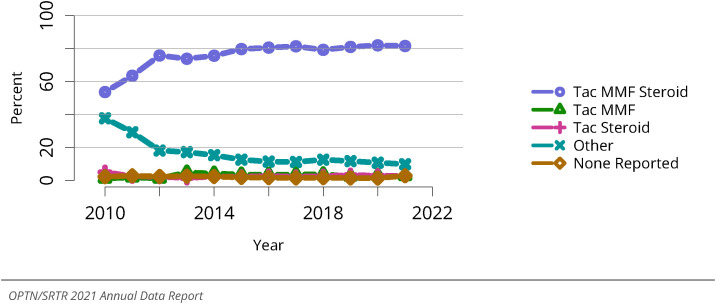
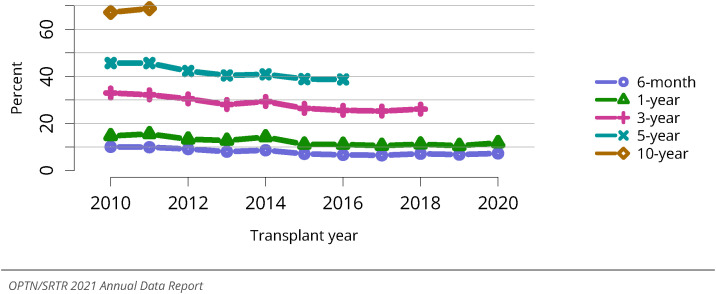
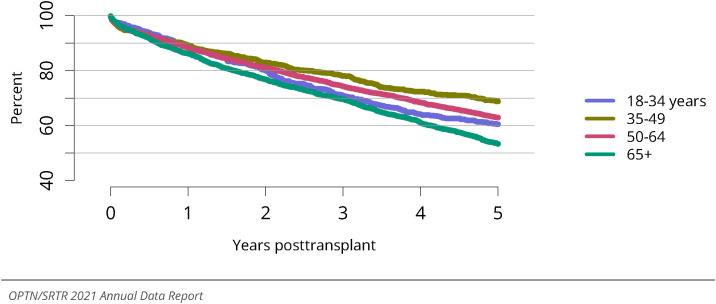
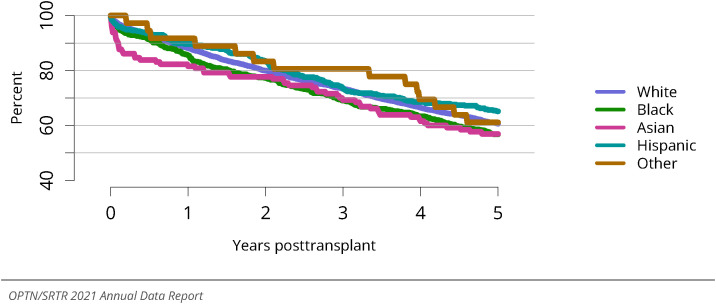
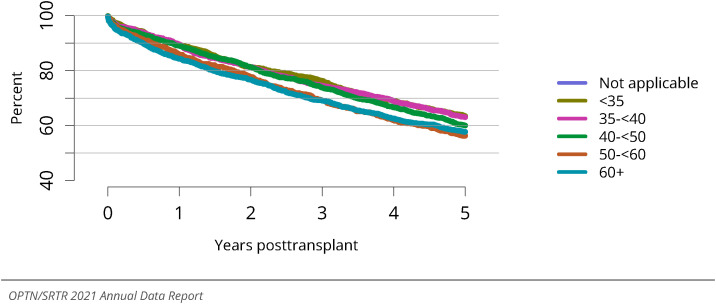
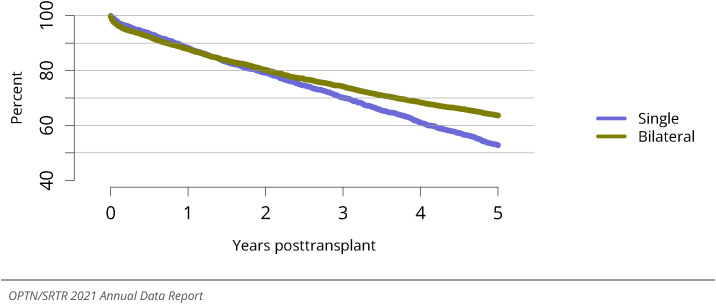
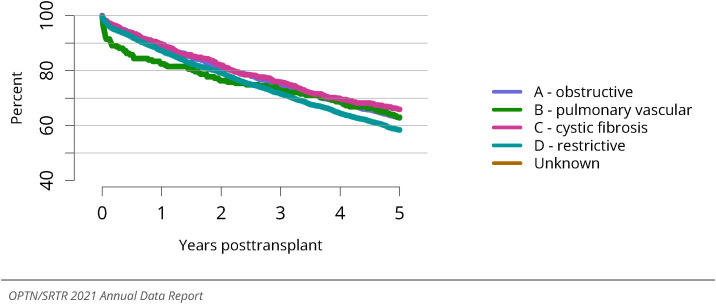
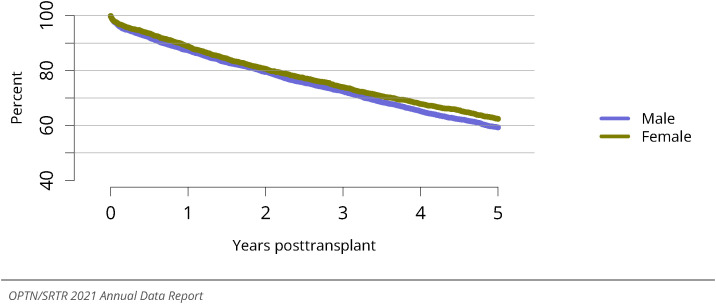
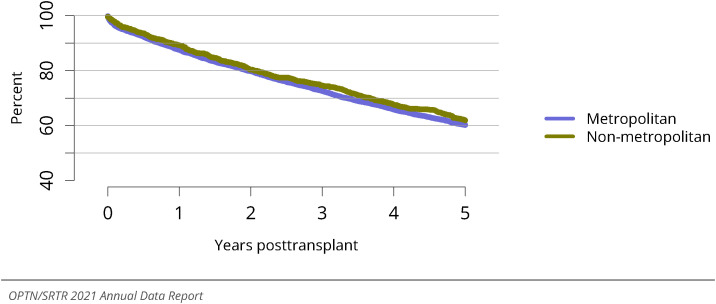
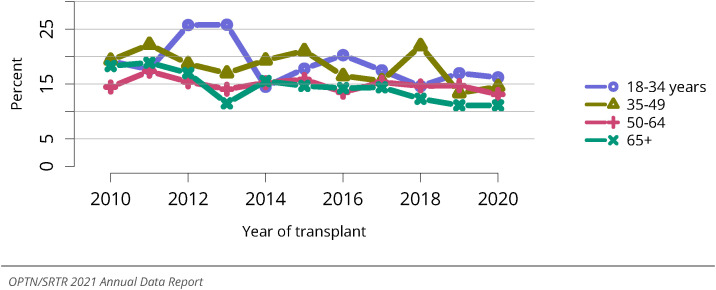
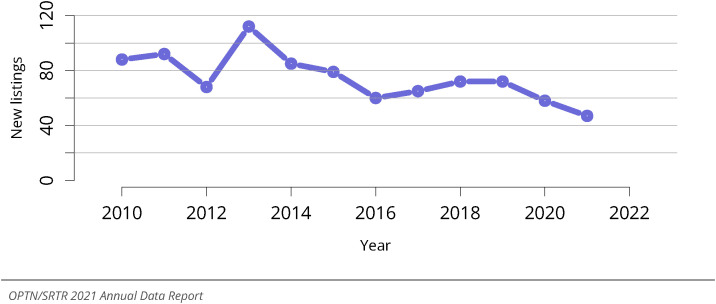
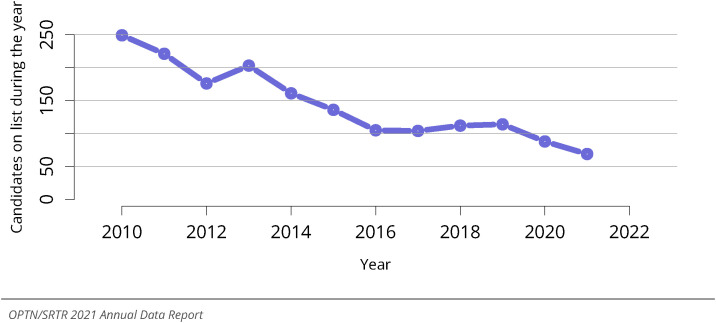
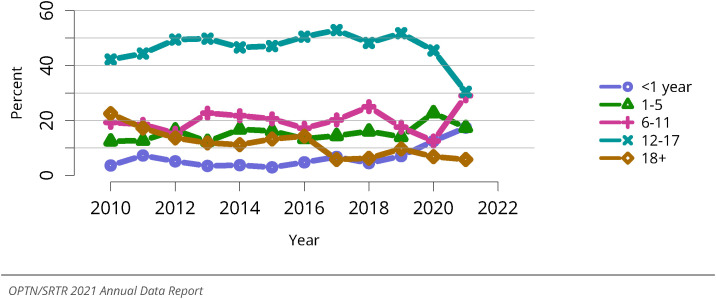
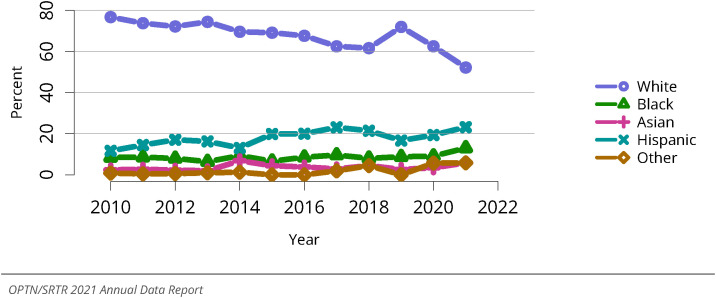
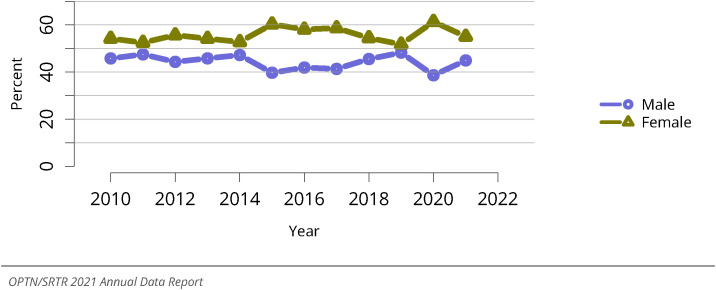
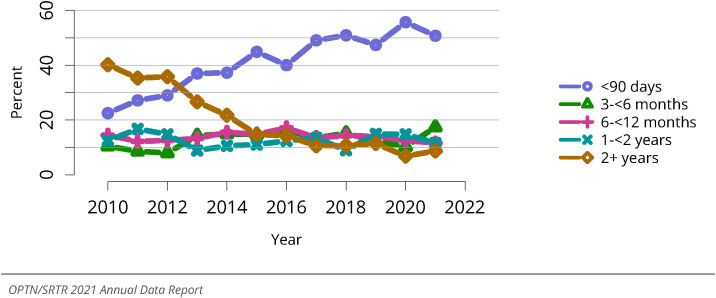
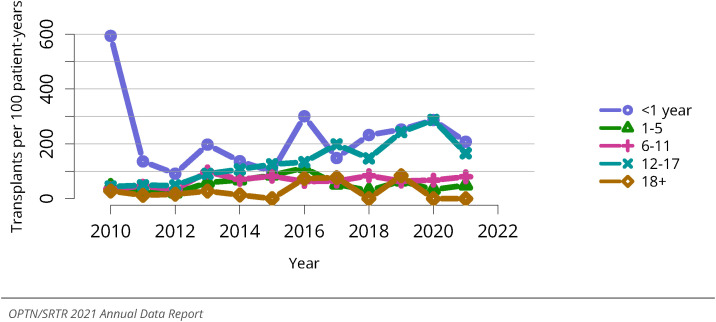
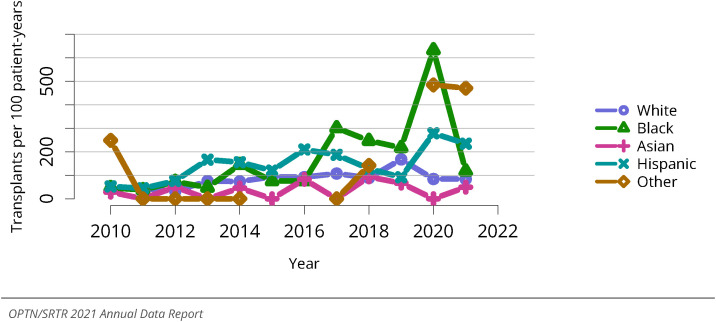
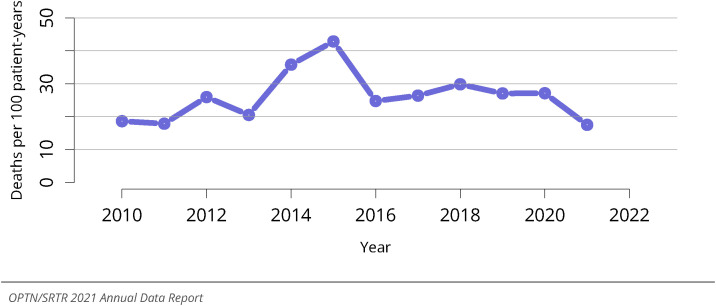
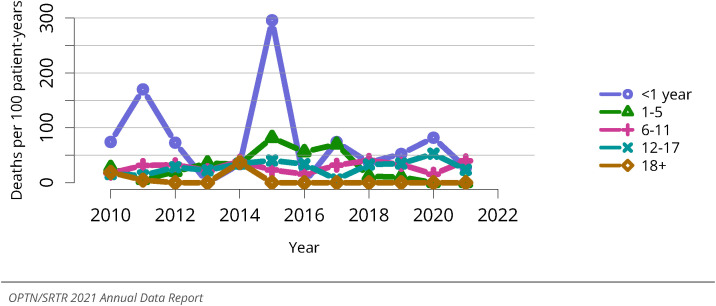
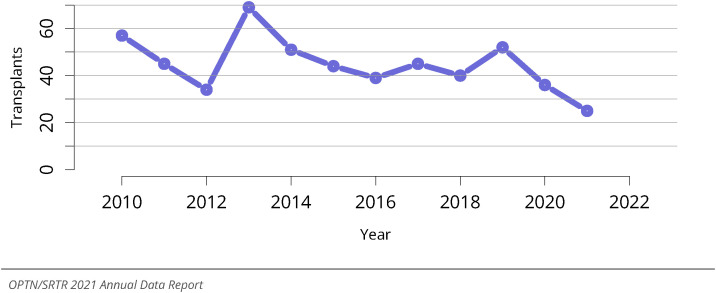
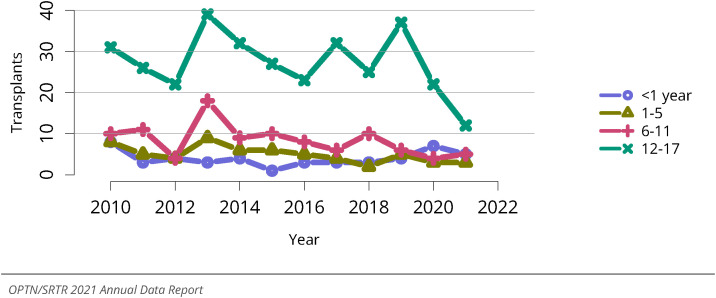
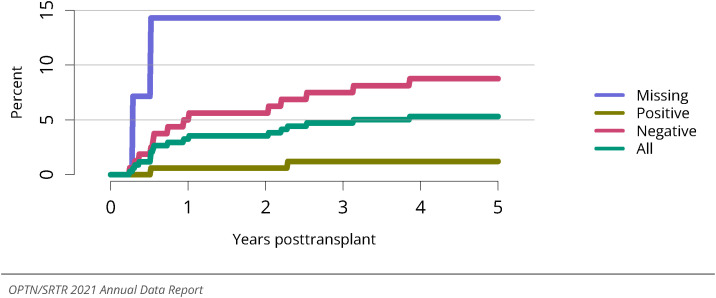
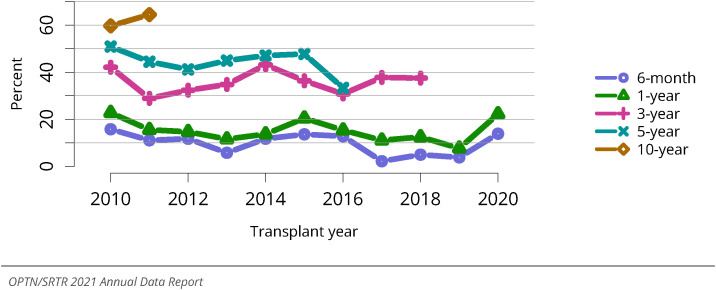
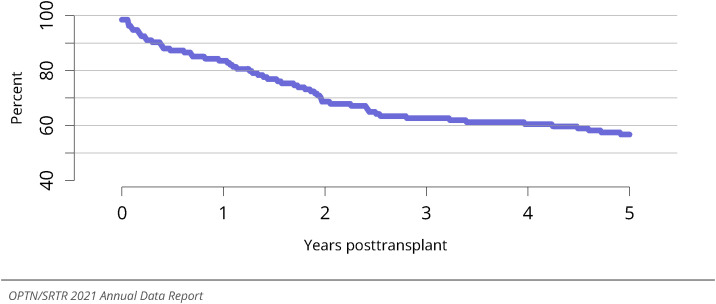
The number of lung transplants has continued to decline since 2020, a period that coincides with the onset of the COVID-19 pandemic. Lung allocation policy continues to undergo considerable change in preparation for adoption of the Composite Allocation Score system in 2023, beginning with multiple adaptations to the calculation of the Lung Allocation Score that occurred in 2021. The number of candidates added to the waiting list increased after a decline in 2020, while waitlist mortality has increased slightly with a decreased number of transplants. Time to transplant continues to improve, with 38.0% of candidates waiting fewer than 90 days for a transplant. Posttransplant survival remains stable, with 85.3% of transplant recipients surviving to 1 year; 67%, to 3 years; and 54.3%, to 5 years.

Keywords: End-stage lung disease; Lung Allocation Score; lung transplant; organ allocation; revised Lung Allocation Score; transplant outcomes.


Figures

Image 1
Graphical abstract
Figure LU 1
Figure LU 1
New adult candidates added to the lung transplant waiting list. A new adult candidate is one who first joined the list during the given year, without having been listed in a previous year. Previously listed candidates who underwent transplant and subsequently relisted are considered new. Active and inactive patients are included.
Figure LU 2
Figure LU 2
All adult candidates on the lung transplant waiting list. Adult candidates on the list at any time during the year. Candidates listed at more than one center are counted once per listing.
Figure LU 3
Figure LU 3
Distribution of adults waiting for lung transplant by age. Candidates waiting for transplant at any time in the given year. Candidates listed at more than one center are counted once per listing. Active and inactive candidates are included. Age is determined at the earliest of transplant, death, removal, or December 31 of the year.
Figure LU 4
Figure LU 4
Distribution of adults waiting for lung transplant by sex. Candidates waiting for transplant at any time in the given year. Candidates listed at more than one center are counted once per listing. Active and inactive patients are included.
Figure LU 5
Figure LU 5
Distribution of adults waiting for lung transplant by race. Candidates waiting for transplant at any time in the given year. Candidates listed at more than one center are counted once per listing. Active and inactive patients are included.
Figure LU 6
Figure LU 6
Distribution of adults waiting for lung transplant by diagnosis group. Candidates waiting for transplant at any time in the given year. Candidates listed at more than one center are counted once per listing. Active and inactive patients are included. The Other/unknown group includes a small number of heart-lung candidates prior to 2015 who did not have an A/B/C/D diagnosis group specified.
Figure LU 7
Figure LU 7
Distribution of adults waiting for lung transplant by waiting time. Candidates waiting for transplant at any time in the given year. Candidates listed at more than one center are counted once per listing. Time on the waiting list is determined at the earliest of transplant, death, removal, or December 31 of the year. Active and inactive candidates are included.
Figure LU 8
Figure LU 8
Distribution of adult candidates waiting for lung transplant by LAS. Candidates waiting for transplant at any time in the given year. Candidates listed at more than one center are counted once per listing. LAS, lung allocation score. LAS is determined at the earliest of transplant, death, removal, or December 31 of the year.
Figure LU 9
Figure LU 9
Distribution of adult candidates waiting for lung transplant by height. Candidates waiting for transplant at any time in the given year. Candidates listed at more than one center are counted once per listing. Active and inactive patients are included.
Figure LU 10
Figure LU 10
Distribution of adults waiting for lung transplant by blood type. Candidates waiting for transplant at any time in the given year. Candidates listed at more than one center are counted once per listing. Active and inactive patients are included.
Figure LU 11
Figure LU 11
Distribution of adults waiting for lung transplant by prior transplant status. Candidates waiting for transplant at any time in the given year. Candidates listed at more than one center are counted once per listing. Active and inactive patients are included.
Figure LU 12
Figure LU 12
Overall deceased donor lung transplant rates among adult waitlist candidates. Transplant rates are computed as the number of deceased donor transplants per 100 patient-years of wait time in a given year. Individual listings are counted separately.
Figure LU 13
Figure LU 13
Deceased donor lung transplant rates among adult waitlist candidates by age. Transplant rates are computed as the number of deceased donor transplants per 100 patient-years of wait time in a given year. Individual listings are counted separately. Age is determined at the later of listing date or January 1 of the given year.
Figure LU 14
Figure LU 14
Deceased donor lung transplant rates among adult waitlist candidates by race. Transplant rates are computed as the number of deceased donor transplants per 100 patient-years of wait time in a given year. Individual listings are counted separately.
Figure LU 15
Figure LU 15
Deceased donor lung transplant rates among adult waitlist candidates by diagnosis group. Transplant rates are computed as the number of deceased donor transplants per 100 patient-years of wait time in a given year. Individual listings are counted separately. The Other/unknown group includes a small number of heart-lung candidates prior to 2015 who did not have an A/B/C/D diagnosis group specified.
Figure LU 16
Figure LU 16
Deceased donor lung transplant rates among adult waitlist candidates by blood type. Transplant rates are computed as the number of deceased donor transplants per 100 patient-years of wait time in a given year. Individual listings are counted separately.
Figure LU 17
Figure LU 17
Deceased donor lung transplant rates among adult waitlist candidates by height. Transplant rates are computed as the number of deceased donor transplants per 100 patient-years of wait time in a given year. Individual listings are counted separately.
None
Figure LU 18: Deceased donor lung transplant rates among adult waitlist candidates by metropolitan vs. non-metropolitan residence. Transplant rates are computed as the number of deceased donor transplants per 100 patient-years of wait time in a given year. Individual listings are counted separately. Urban/rural determination is made using the RUCA (rural-urban commuting area) designation of the candidate’s permanent zip code.
Figure LU 19
Figure LU 19
Three-year outcomes for adults waiting for lung transplant, new listings in 2016-2018. Candidates listed at more than one center are counted once per listing. Removed from list includes all reasons except transplant and death. DD, deceased donor.
Figure LU 20
Figure LU 20
Percentage of adults who underwent deceased donor lung transplant within a given period of listing. Candidates listed at more than one center are counted once per listing.
Figure LU 21
Figure LU 21
Overall pretransplant mortality rates among adults waitlisted for lung transplant. Mortality rates are computed as the number of deaths per 100 patient-years of waiting in the given year. Waiting time is censored at transplant, death, transfer to another program, removal because of improved condition, or end of cohort. Individual listings are counted separately.
Figure LU 22
Figure LU 22
Pretransplant mortality rates among adults waitlisted for lung transplant by age. Mortality rates are computed as the number of deaths per 100 patient-years of waiting in the given year. Waiting time is censored at transplant, death, transfer to another program, removal because of improved condition, or end of cohort. Individual listings are counted separately. Age is determined at the later of listing date or January 1 of the given year.
Figure LU 23
Figure LU 23
Pretransplant mortality rates among adults waitlisted for lung transplant by race. Mortality rates are computed as the number of deaths per 100 patient-years of waiting in the given year. Waiting time is censored at transplant, death, transfer to another program, removal because of improved condition, or end of cohort. Individual listings are counted separately.
Figure LU 24
Figure LU 24
Pretransplant mortality rates among adults waitlisted for lung transplant by sex. Mortality rates are computed as the number of deaths per 100 patient-years of waiting in the given year. Waiting time is censored at transplant, death, transfer to another program, removal because of improved condition, or end of cohort. Individual listings are counted separately.
Figure LU 25
Figure LU 25
Pretransplant mortality rates among adults waitlisted for lung transplant by diagnosis. Mortality rates are computed as the number of deaths per 100 patient-years of waiting in the given year. Waiting time is censored at transplant, death, transfer to another program, removal because of improved condition, or end of cohort. Individual listings are counted separately. The Other/unknown group includes a small number of heart-lung candidates prior to 2015 who did not have an A/B/C/D diagnosis group specified.
Figure LU 26
Figure LU 26
Pretransplant mortality rates among adults waitlisted for lung transplant by LAS. Mortality rates are computed as the number of deaths per 100 patient-years of waiting in the given year. Waiting time is censored at transplant, death, transfer to another program, removal because of improved condition, or end of cohort. Individual listings are counted separately. LAS is determined at the later of listing date or January 1 of the given year.
Figure LU 27
Figure LU 27
Pretransplant mortality rates among adults waitlisted for lung transplant by blood type. Mortality rates are computed as the number of deaths per 100 patient-years of waiting in the given year. Waiting time is censored at transplant, death, transfer to another program, removal because of improved condition, or end of cohort. Individual listings are counted separately.
Figure LU 28
Figure LU 28
Pretransplant mortality rates among adults waitlisted for lung transplant by height. Mortality rates are computed as the number of deaths per 100 patient-years of waiting in the given year. Waiting time is censored at transplant, death, transfer to another program, removal because of improved condition, or end of cohort. Individual listings are counted separately.
None
Figure LU 29: Pretransplant mortality rates among adults waitlisted for lung transplant by metropolitan vs. non-metropolitan residence. Mortality rates are computed as the number of deaths per 100 patient-years of waiting in the given year. Waiting time is censored at transplant, death, transfer to another program, removal because of improved condition, or end of cohort. Individual listings are counted separately. Urban/rural determination is made using the RUCA (rural-urban commuting area) designation of the candidate’s permanent zip code.
Figure LU 30
Figure LU 30
Pretransplant mortality rates among adults waitlisted for lung transplant in 2021 by DSA. Mortality rates are computed as the number of deaths per 100 patient-years of waiting in the given year. Waiting time is censored at transplant, death, transfer to another program, removal because of improved condition, or end of cohort. Individual listings are counted separately.
Figure LU 31
Figure LU 31
Deaths within six months after removal among adult lung waitlist candidates, overall. Denominator includes only candidates removed from the waiting list for reasons other than transplant or death while on the list.
Figure LU 32
Figure LU 32
Deaths within six months after removal among adult lung waitlist candidates, by diagnosis. Denominator includes only candidates removed from the waiting list for reasons other than transplant or death while on the list. The Other/unknown group includes a small number of heart-lung candidates prior to 2015 who did not have an A/B/C/D diagnosis group specified.
Figure LU 33
Figure LU 33
Deaths within six months after removal among adult lung waitlist candidates, by age. Denominator includes only candidates removed from the waiting list for reasons other than transplant or death while on the list. Age is determined at removal.
Figure LU 34
Figure LU 34
Overall deceased lung donor count. Count of deceased donors with at least one lung recovered. Donors are counted once, regardless of the number of lungs recovered.
None
Figure LU 35: Deceased lung donor count by age. Count of deceased donors with at least one lung recovered. Donors are counted once, regardless of the number of lungs recovered.
Figure LU 36
Figure LU 36
Distribution of deceased lung donors by age. Deceased donors whose lungs were recovered for transplant. Donors are counted once, regardless of the number of lungs recovered.
Figure LU 37
Figure LU 37
Distribution of deceased lung donors by sex. Deceased donors whose lungs were recovered for transplant. Donors are counted once, regardless of the number of lungs recovered.
Figure LU 38
Figure LU 38
Distribution of deceased lung donors by race. Deceased donors whose lungs were recovered for transplant. Donors are counted once, regardless of the number of lungs recovered.
Figure LU 39
Figure LU 39
Overall percent of lungs recovered for transplant and not transplanted. Percentages of lungs not transplanted out of all lungs recovered for transplant.
Figure LU 40
Figure LU 40
Percent of lungs recovered for transplant and not transplanted by donor age. Percentages of lungs not transplanted out of all lungs recovered for transplant.
Figure LU 41
Figure LU 41
Percent of lungs recovered for transplant and not transplanted by donor cause of death. Percentages of lungs not transplanted out of all lungs recovered for transplant. CVA, cerebrovascular accident.
Figure LU 42
Figure LU 42
Percent of lungs recovered for transplant and not transplanted, by donor risk of disease transmission. Percentages of lungs not transplanted out of all lungs recovered for transplant. “Increased risk” is defined by criteria from the US Public Health Service Guidelines for increased risk for HIV, hepatitis B, and hepatitis C transmission.
Figure LU 43
Figure LU 43
Cause of death among deceased lung donors. Deceased donors with a lung recovered for the purposes of transplant. CVA, cerebrovascular accident.
Figure LU 44
Figure LU 44
Overall lung transplants. All lung transplant recipients, including adult and pediatric, retransplant, and multiorgan recipients.
Figure LU 45
Figure LU 45
Total lung transplants by procedure type. All lung transplant recipients, including adult and pediatric, retransplant, and multiorgan recipients.
Figure LU 46
Figure LU 46
Total lung transplants by age. All lung transplant recipients, including adult and pediatric, retransplant, and multiorgan recipients.
Figure LU 47
Figure LU 47
Total lung transplants by sex. All lung transplant recipients, including adult and pediatric, retransplant, and multiorgan recipients.
Figure LU 48
Figure LU 48
Total lung transplants by race. All lung transplant recipients, including adult and pediatric, retransplant, and multiorgan recipients.
Figure LU 49
Figure LU 49
Total lung transplants by diagnosis. All lung transplant recipients, including adult and pediatric, retransplant, and multiorgan recipients. The Other/unknown group includes a small number of heart-lung recipients prior to 2015 who did not have an A/B/C/D diagnosis group specified.
Figure LU 50
Figure LU 50
Total lung transplants by LAS. All lung transplant recipients, including adult and pediatric, retransplant, and multiorgan recipients.
Figure LU 51
Figure LU 51
Induction agent use in adult lung transplant recipients. Immunosuppression at transplant reported to the OPTN.
Figure LU 52
Figure LU 52
Immunosuppression regimen use in adult lung transplant recipients. Immunosuppression regimen at transplant reported to the OPTN. Tac, tacrolimus. MMF, all mycophenolate agents.
Figure LU 53
Figure LU 53
Patient death among adult lung transplant recipients. All adult recipients of deceased donor lungs, including multiorgan transplants.
Figure LU 54
Figure LU 54
Patient survival among adult lung transplant recipients, 2014-2016, by age. Patient survival estimated using unadjusted Kaplan-Meier methods.
Figure LU 55
Figure LU 55
Patient survival among adult lung transplant recipients, 2014-2016, by race. Patient survival estimated using unadjusted Kaplan-Meier methods.
Figure LU 56
Figure LU 56
Patient survival among adult lung transplant recipients, 2014-2016, by LAS. Patient survival estimated using unadjusted Kaplan-Meier methods.
Figure LU 57
Figure LU 57
Patient survival among adult lung transplant recipients, 2014-2016, by transplant type. Patient survival estimated using unadjusted Kaplan-Meier methods.
Figure LU 58
Figure LU 58
Patient survival among adult lung transplant recipients, 2014-2016, by diagnosis group. Patient survival estimated using unadjusted Kaplan-Meier methods. The Other/unknown group includes a small number of heart-lung recipients prior to 2015 who did not have an A/B/C/D diagnosis group specified.
Figure LU 59
Figure LU 59
Patient survival among adult lung transplant recipients, 2014-2016, by sex. Patient survival estimated using unadjusted Kaplan-Meier methods.
Figure LU 60
Figure LU 60
Patient survival among adult lung transplant recipients, 2014-2016, by metropolitan vs. non-metropolitan recipient residence. Patient survival estimated using unadjusted Kaplan-Meier methods.
None
Figure LU 61: Incidence of acute rejection by 1 year posttransplant among adult lung transplant recipients by age. Only the first reported rejection event is counted. Cumulative incidence is estimated using the Kaplan-Meier method.
None
Figure LU 62: Incidence of acute rejection by 1 year posttransplant among adult lung transplant recipients by induction agent. Only the first reported rejection event is counted. Cumulative incidence is estimated using the Kaplan-Meier method. IL2Ab, interleukin-2 receptor antibody; TCD, T-cell depleting.
None
Figure LU 63: Incidence of PTLD among adult lung transplant recipients by recipient EBV status at transplant, 2010-2016. Cumulative incidence is estimated using the Kaplan-Meier method. PTLD is identified as a reported complication or cause of death on the OPTN Transplant Recipient Follow-up Form or the Posttransplant Malignancy Form as polymorphic PTLD, monomorphic PTLD, or Hodgkin’s disease. Only the earliest date of PTLD diagnosis is considered. EBV, Epstein-Barr virus; PTLD, posttransplant lymphoproliferative disorder.
Figure LU 64
Figure LU 64
New pediatric candidates added to the lung transplant waiting list. A new candidate is one who first joined the list during the given year, without having been listed in a previous year. Previously listed candidates who underwent transplant and subsequently relisted are considered new. Candidates listed at more than one center are counted once per listing. Active and inactive patients are included.
Figure LU 65
Figure LU 65
All pediatric candidates on the lung transplant waiting list. Pediatric candidates listed at any time during the year. Candidates listed at more than one center are counted once per listing.
Figure LU 66
Figure LU 66
Distribution of pediatric candidates waiting for lung transplant by age. Candidates waiting for transplant at any time in the given year. Candidates listed at more than one center are counted once per listing. Active and inactive candidates are included. Age is determined at the earliest of transplant, death, removal, or December 31 of the year.
Figure LU 67
Figure LU 67
Distribution of pediatric candidates waiting for lung transplant by race. Candidates waiting for transplant any time in the given year. Candidates listed at more than one center are counted once per listing. Active and inactive candidates are included.
None
Figure LU 68: Distribution of pediatric candidates waiting for lung transplant by sex. Candidates waiting for transplant any time in the given year. Candidates listed at more than one center are counted once per listing. Active and inactive patients are included.
Figure LU 69
Figure LU 69
Distribution of pediatric candidates waiting for lung transplant by waiting time. Candidates waiting for transplant any time in the given year. Candidates listed at more than one center are counted once per listing. Time on the waiting list is determined at the earliest of transplant, death, removal, or December 31 of the year. Active and inactive candidates are included.
Figure LU 70
Figure LU 70
Three-year outcomes for newly listed pediatric candidates waiting for lung transplant, 2016-2018. Pediatric candidates who joined the waiting list in 2016-2018. Pediatric candidates listed at more than one center are counted once per listing. Removed from list includes all reasons except transplant and death. DD, deceased donor.
Figure LU 71
Figure LU 71
Overall deceased donor lung transplant rates among pediatric waitlist candidates. Transplant rates are computed as the number of deceased donor transplants per 100 patient-years of waiting in a given year. Individual listings are counted separately.
Figure LU 72
Figure LU 72
Deceased donor lung transplant rates among pediatric waitlist candidates by age. Transplant rates are computed as the number of deceased donor transplants per 100 patient-years of waiting in a given year. Individual listings are counted separately. Age is determined at the later of listing date or January 1 of the given year.
Figure LU 73
Figure LU 73
Deceased donor lung transplant rates among pediatric waitlist candidates by race. Transplant rates are computed as the number of deceased donor transplants per 100 patient-years of waiting in a given year. Individual listings are counted separately.
Figure LU 74
Figure LU 74
Overall pretransplant mortality rates among pediatric candidates waitlisted for lung. Mortality rates are computed as the number of deaths per 100 patient-years of waiting in the given year. Waiting time is censored at transplant, death, transfer to another program, removal because of improved condition, or end of cohort. Individual listings are counted separately.
Figure LU 75
Figure LU 75
Pretransplant mortality rates among pediatric candidates waitlisted for lung transplant by age. Mortality rates are computed as the number of deaths per 100 patient-years of waiting in the given year. Waiting time is censored at transplant, death, transfer to another program, removal because of improved condition, or end of cohort. Individual listings are counted separately. Age is determined at the later of listing date or January 1 of the given year.
Figure LU 76
Figure LU 76
Overall pediatric lung transplants. All pediatric lung transplant recipients, including retransplant, and multiorgan recipients.
Figure LU 77
Figure LU 77
Pediatric lung transplants by recipient age. All pediatric lung transplant recipients, including retransplant, and multiorgan recipients.
Figure LU 78
Figure LU 78
Induction agent use in pediatric lung transplant recipients. Immunosuppression at transplant reported to the OPTN.
Figure LU 79
Figure LU 79
Immunosuppression regimen use in pediatric lung transplant recipients. Immunosuppression regimen at transplant reported to the OPTN. Tac, tacrolimus. MMF, all mycophenolate agents.
Figure LU 80
Figure LU 80
Incidence of PTLD among pediatric lung transplant recipients by recipient EBV status at transplant, 2010-2016. Cumulative incidence is estimated using the Kaplan-Meier method. PTLD is identified as a reported complication or cause of death on the OPTN Transplant Recipient Follow-up Form or on the Posttransplant Malignancy Form as polymorphic PTLD, monomorphic PTLD, or Hodgkin’s disease. Only the earliest date of PTLD diagnosis is considered. EBV, Epstein-Barr virus. PTLD, posttransplant lymphoproliferative disorder.
Figure LU 81
Figure LU 81
Patient death among pediatric lung transplant recipients. All pediatric recipients of deceased donor lungs, including multiorgan transplants. Estimates are unadjusted, computed using unadjusted Kaplan-Meier methods.
Figure LU 82
Figure LU 82
Overall patient survival among pediatric deceased donor lung transplant recipients, 2014-2016. Recipient survival estimated using unadjusted Kaplan-Meier methods.