. 2023 Feb;23(2 Suppl 1):S21-S120.
doi: 10.1016/j.ajt.2023.02.004.

OPTN/SRTR 2021 Annual Data Report: Kidney

Affiliations

OPTN/SRTR 2021 Annual Data Report: Kidney

Krista L Lentine et al. Am J Transplant. 2023 Feb.

Abstract

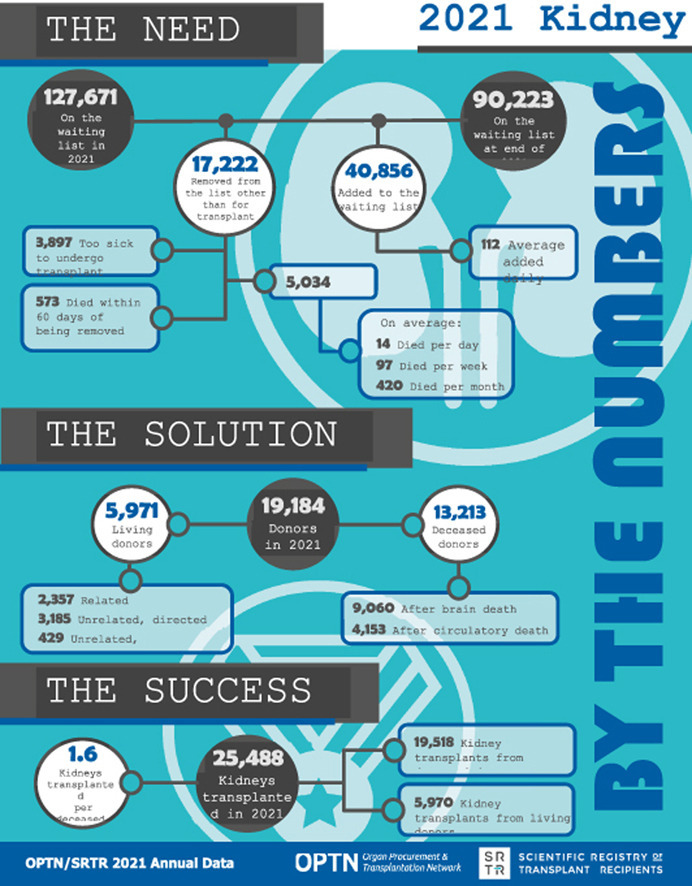
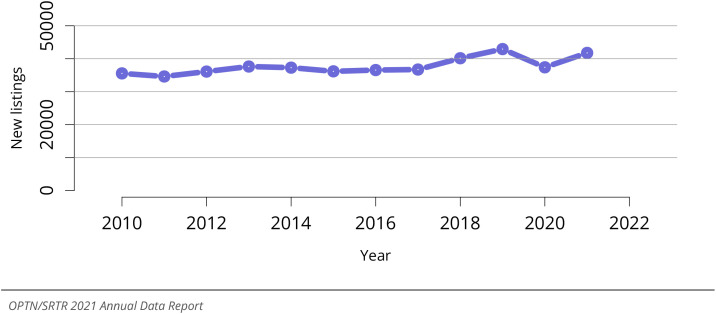
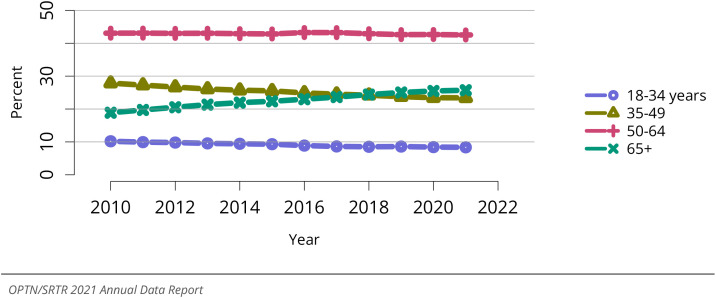
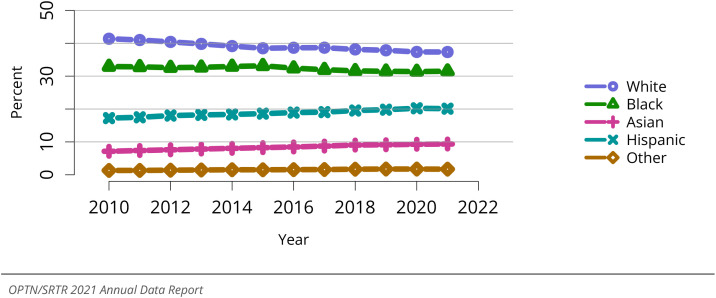
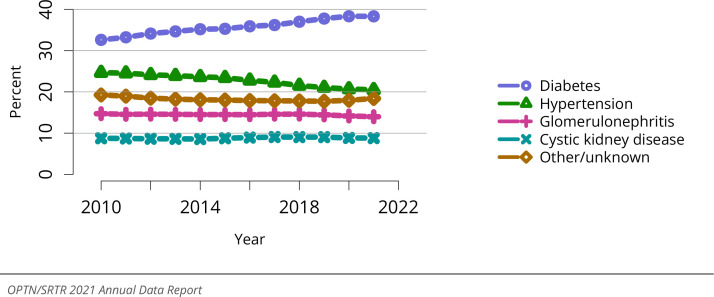
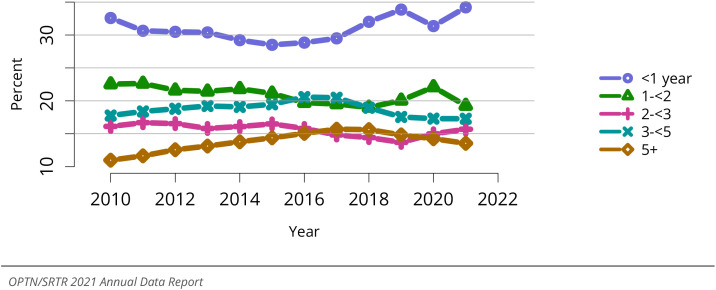
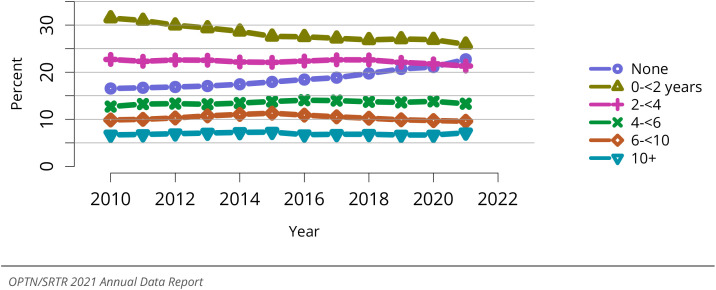
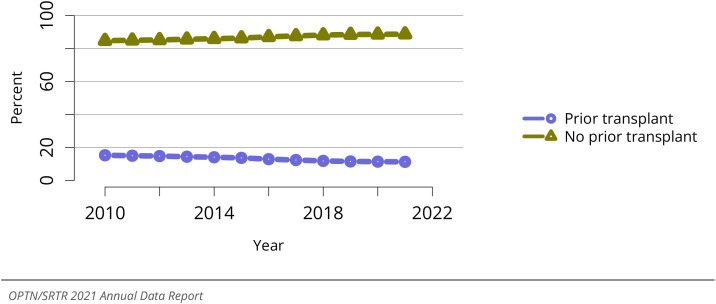
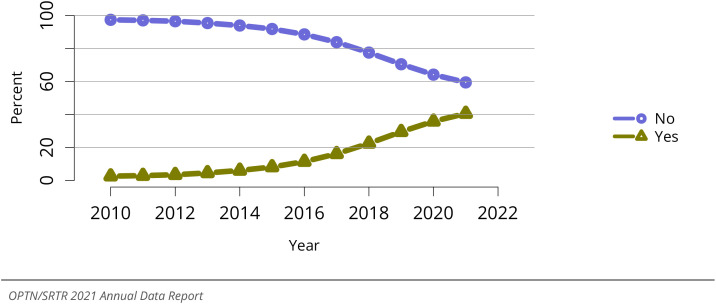
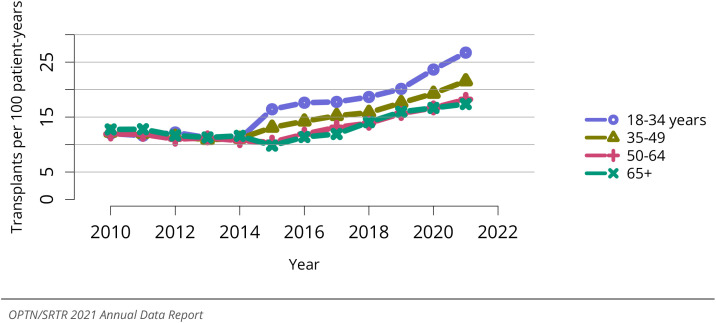
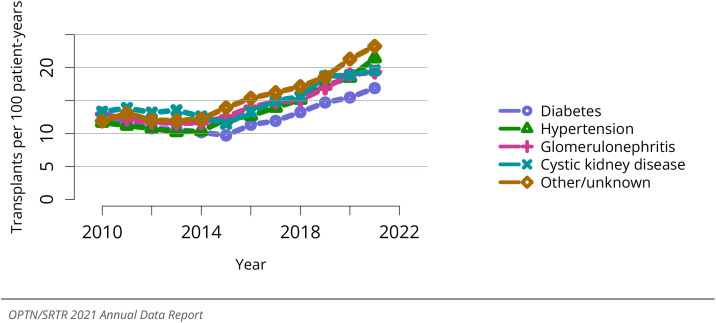
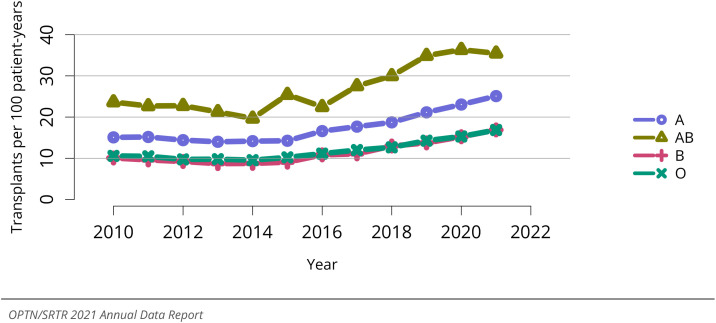
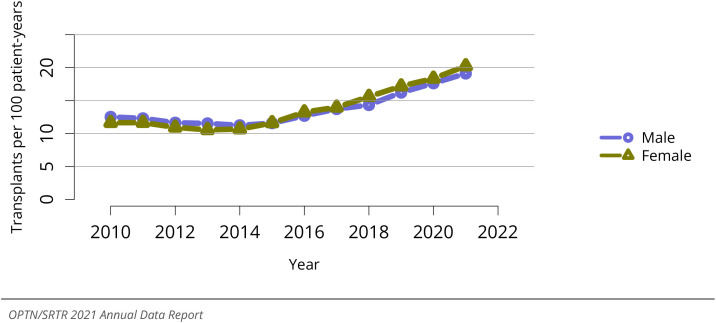
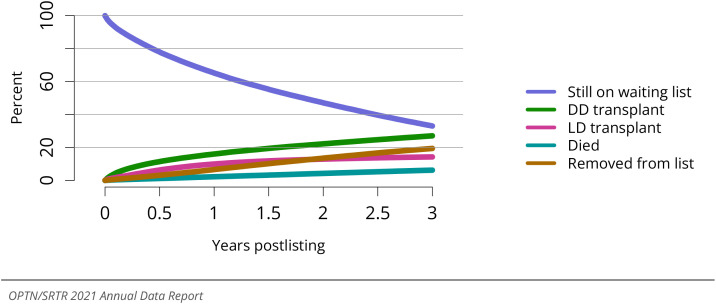
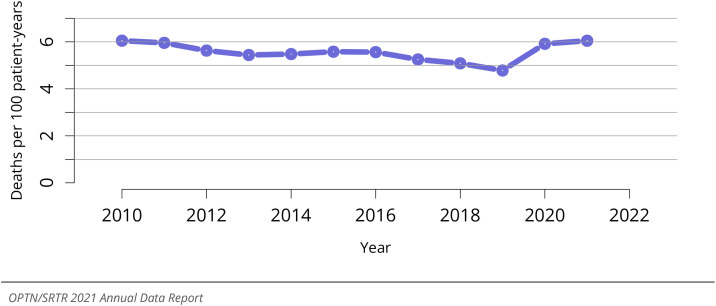
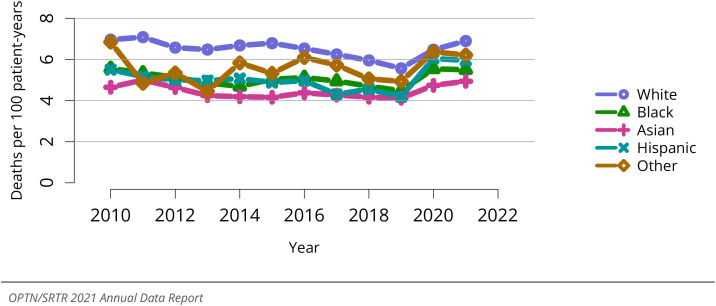
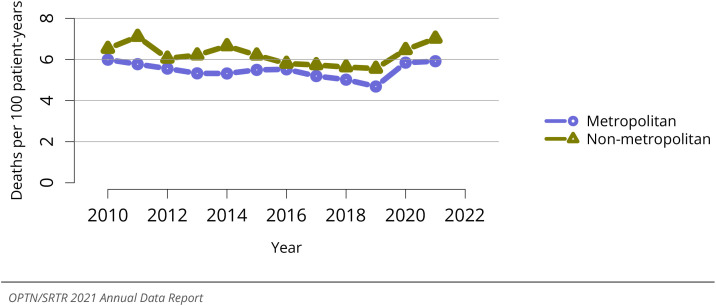
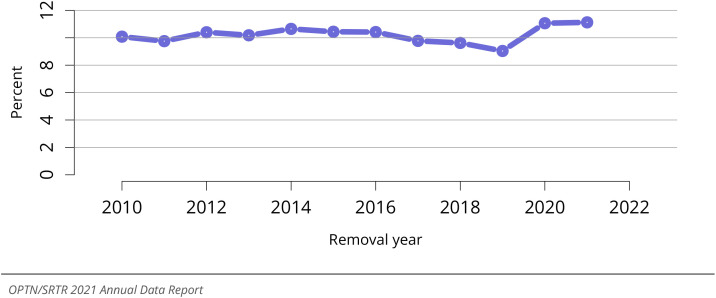
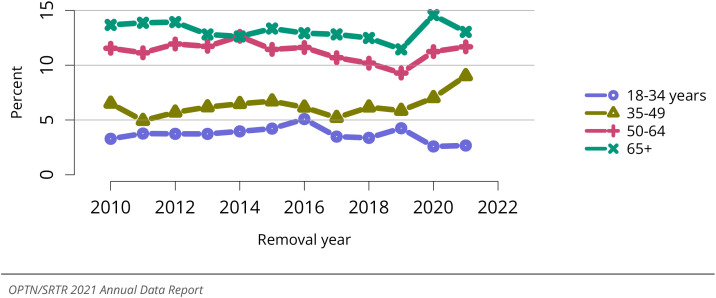
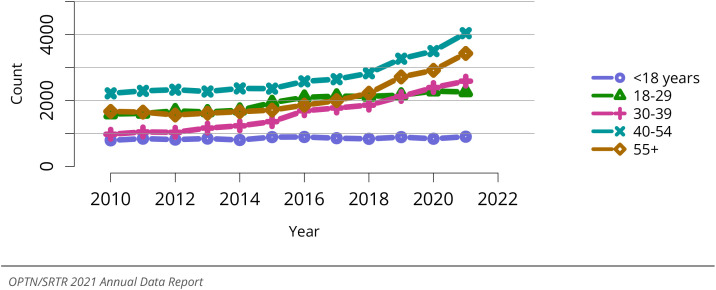
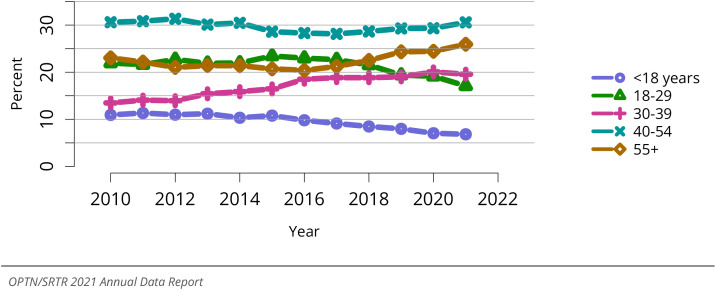
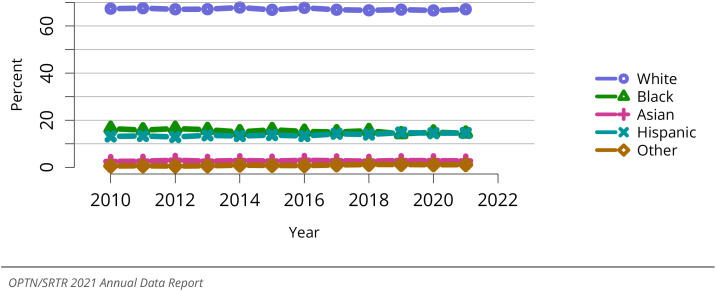
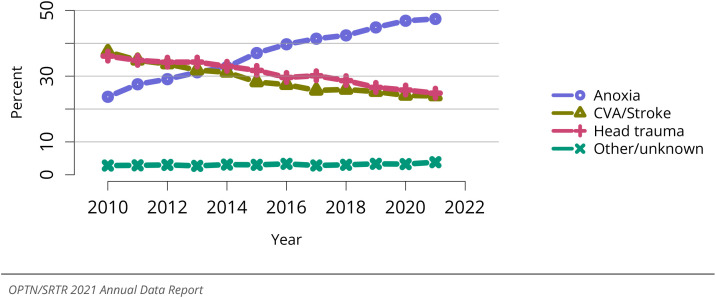
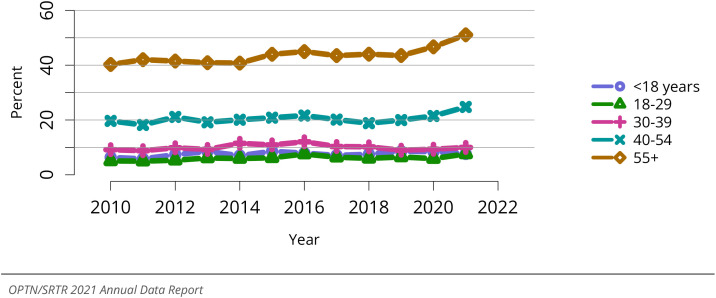
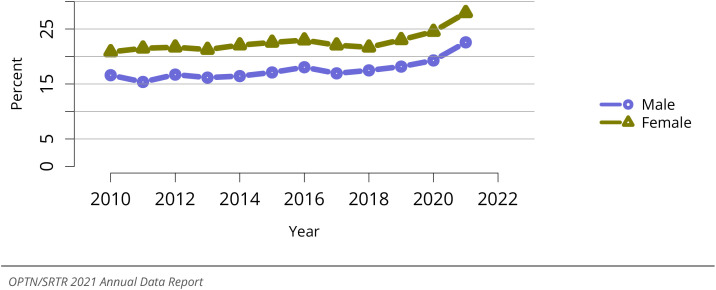
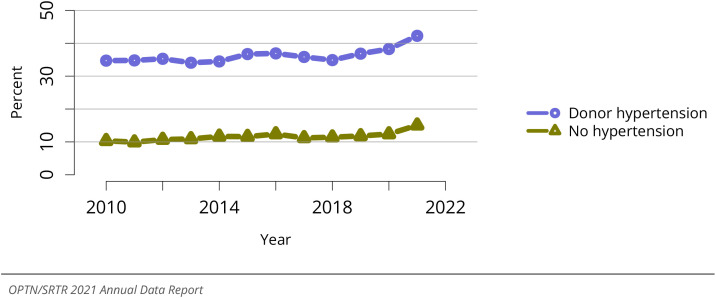
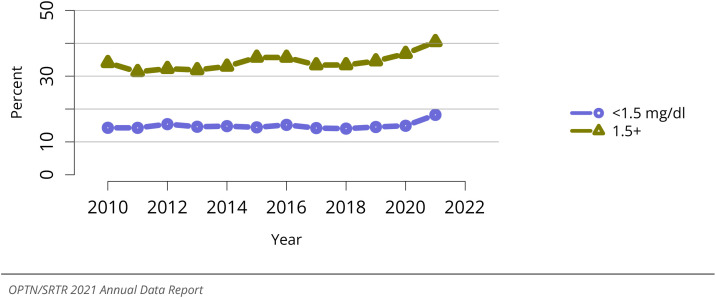
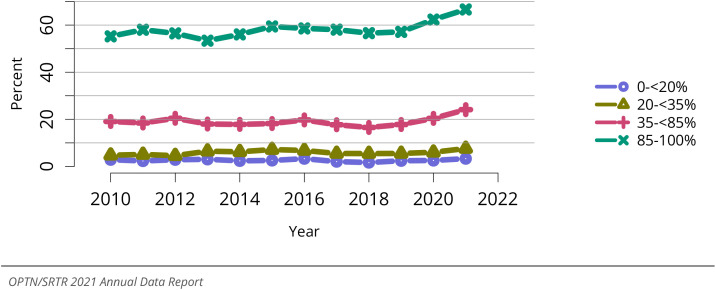
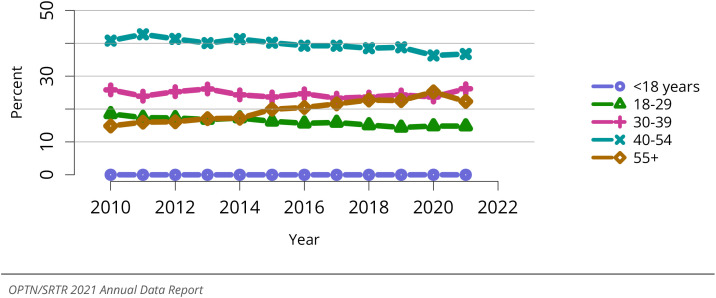
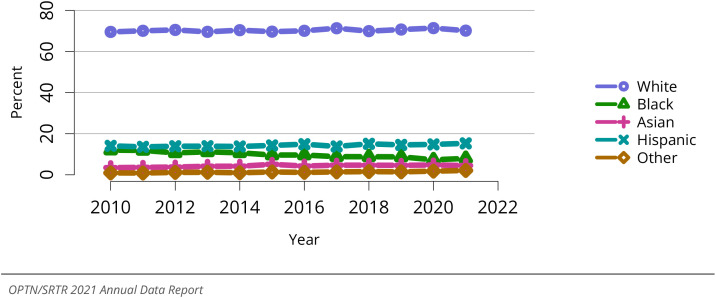
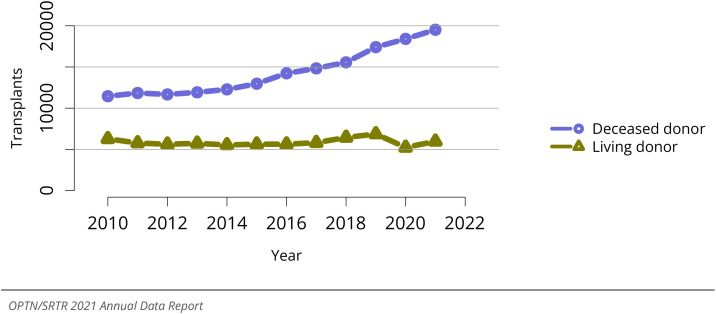
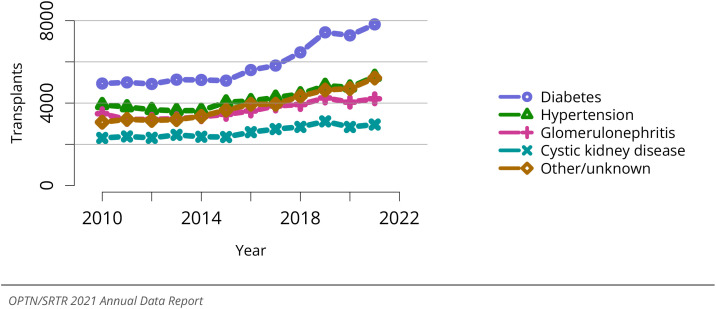
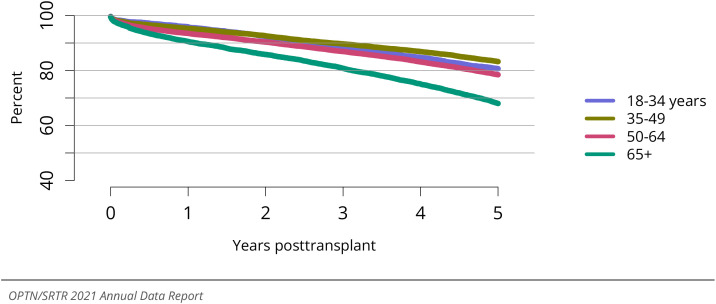
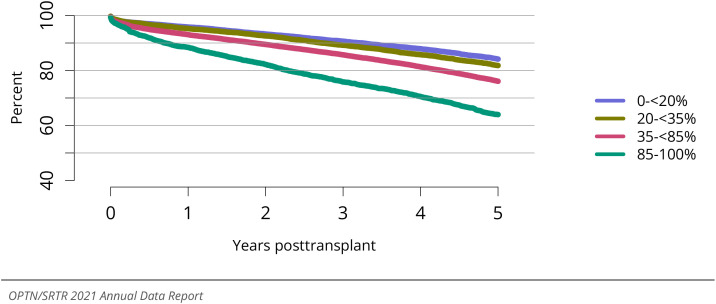
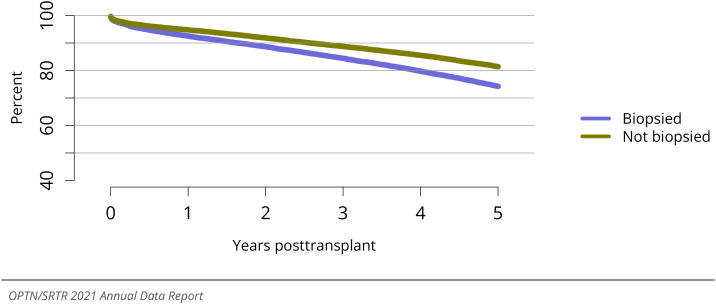
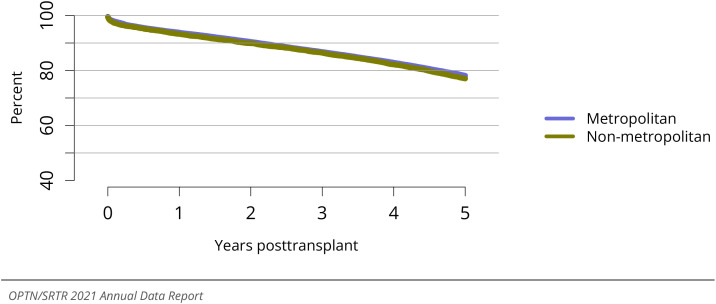
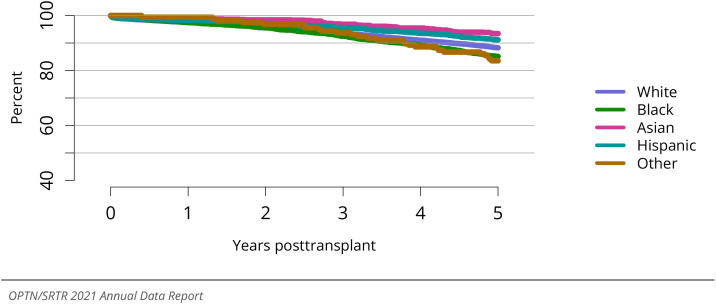
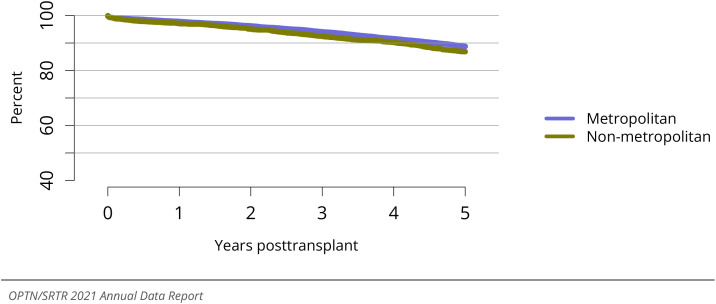
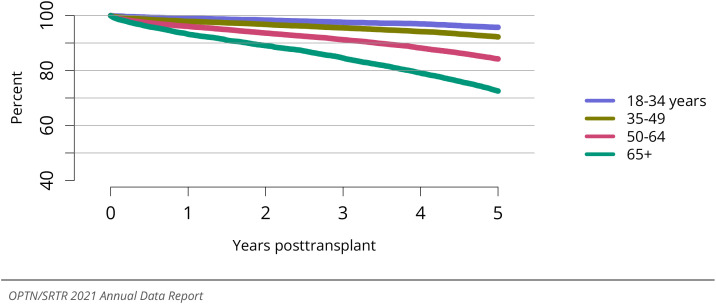
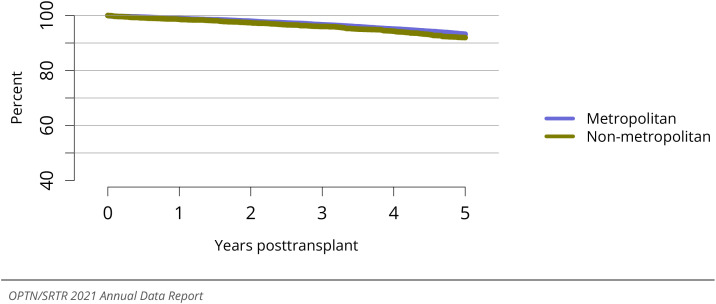
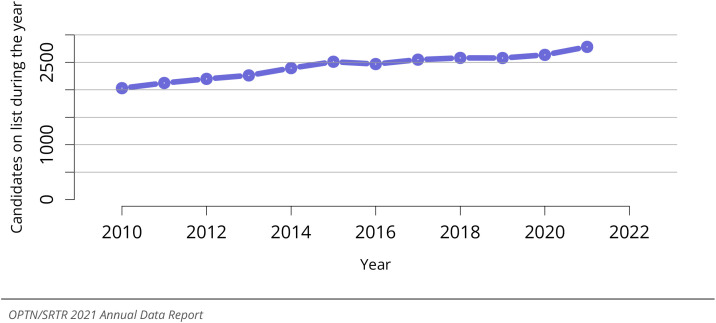
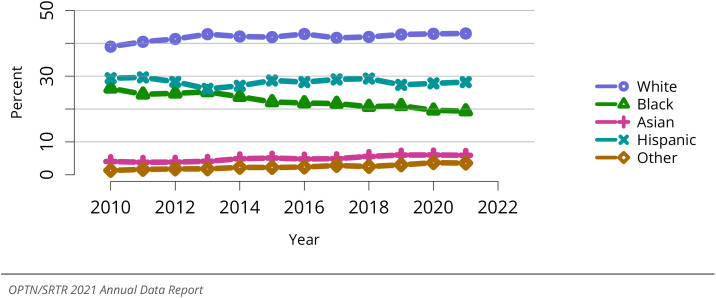
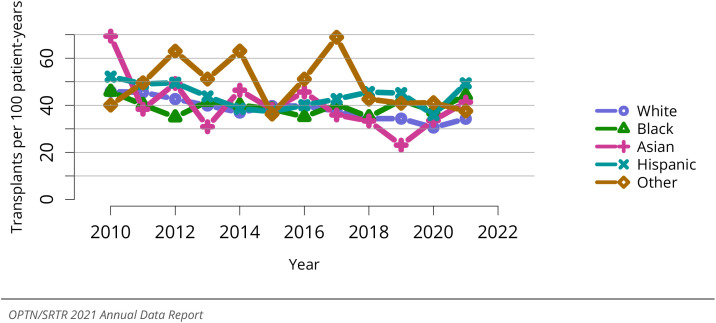
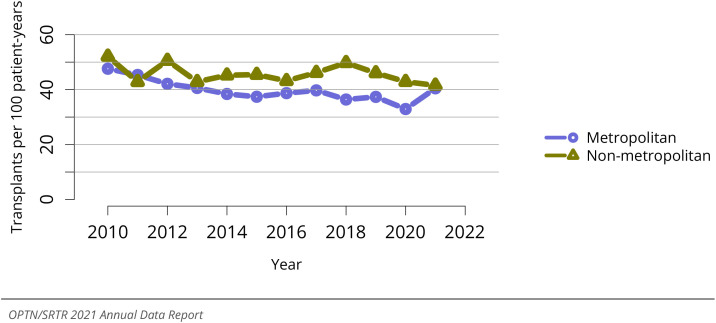
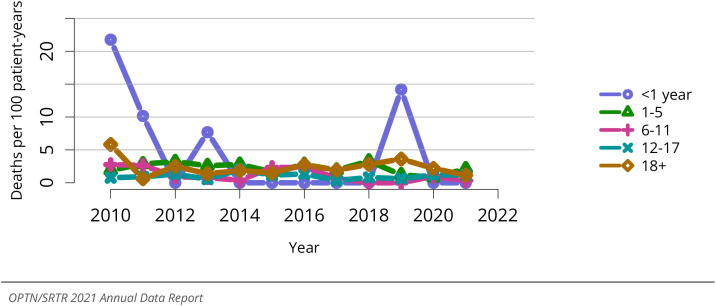
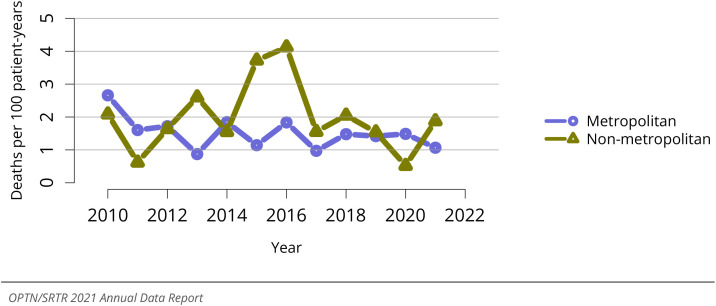
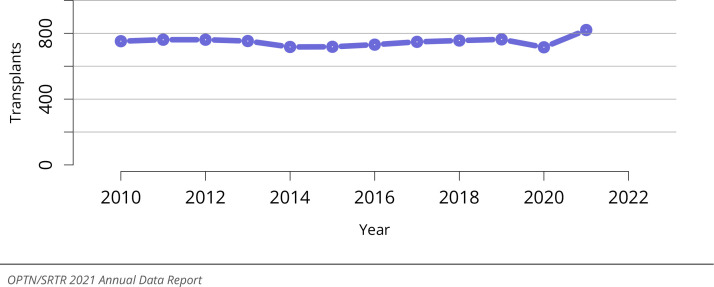
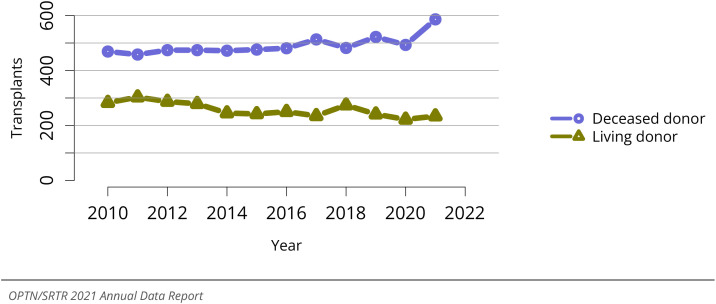
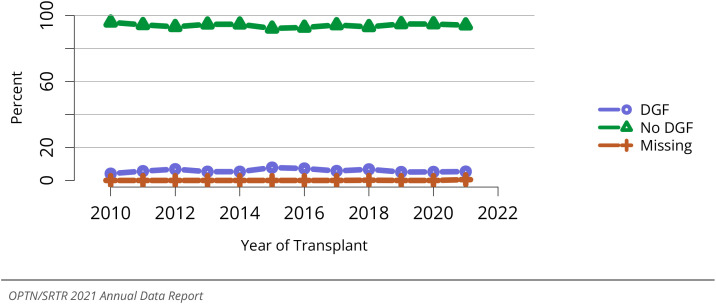
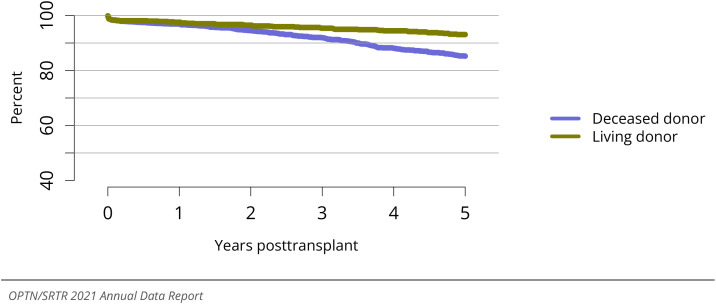
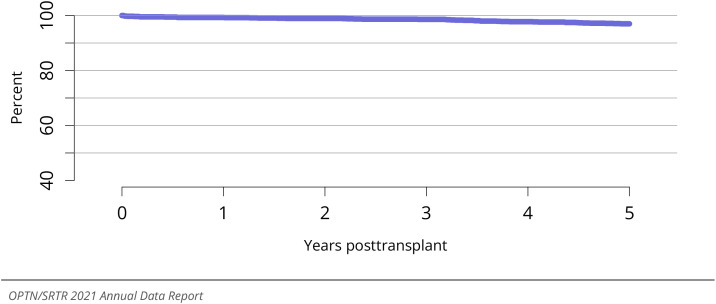
The year 2021 marked both successes and challenges for the field of kidney transplantation, in the context of the ongoing COVID-19 pandemic and broader geographic organ distribution. The total number of kidney transplants in the United States reached a record count of 25,487, driven by growth in deceased donor kidney transplants. The total number of candidates listed for deceased donor kidney transplant rose slightly in 2021 but remained below 2019 listing levels, with nearly 10% of candidates having been waiting 5 years or longer. Pretransplant mortality declined slightly among candidates of Black, Hispanic, and other races, in parallel with increasing numbers of Black and Hispanic transplant recipients. In the context of broader organ sharing, there is growing disparity in pretransplant mortality among non-metropolitan compared with metropolitan residents. The proportion of deceased donor kidneys recovered but not used for transplant (nonuse rate) rose to a high of 24.6% overall, with greater nonuse among biopsied kidneys (35.9%), kidneys from donors aged 55 years or older (51.1%), and kidneys with kidney donor profile index (KDPI) of 85% or greater (66.6%). Nonuse of kidneys from donors who are hepatitis C virus (HCV) antibody positive only slightly exceeded that of HCV antibody-negative donors. Disparities in access to living donor kidney transplant persists, especially for non-White and publicly insured patients. Delayed graft function continues an upward trend and occurred in 24% of adult kidney transplants in 2021. Five-year graft survival after living compared with deceased donor transplant was 88.6% versus 80.7% for recipients aged 18-34 years, and 82.1% versus 68.0% for recipients aged 65 years or older. The total number of pediatric kidney transplants performed increased to 820 in 2021, the highest number since 2010. Despite numerous efforts, living donor kidney transplant remains low among pediatric recipients, with continued racial disparities. The rate of deceased donor transplants among pediatric candidates recovered in 2021 from a low in 2020. Congenital anomalies of the kidney and urinary tract remain the leading primary kidney disease diagnosis among pediatric candidates. Most pediatric deceased donor recipients receive a kidney from a donor with KDPI less than 35%. Graft survival continues to improve, with superior outcomes for living donor transplant recipients.

Keywords: Kidney transplant; transplant outcomes; waiting list outcomes.


Figures

Image 1
Graphical abstract
Figure KI 1
Figure KI 1
New adult candidates added to the kidney transplant waiting list. A new candidate is one who first joined the list during the given year, without having been listed in a previous year. Previously listed candidates who underwent transplant and subsequently relisted are considered new. Active and inactive patients are included. Candidates listed at more than one center are counted once per listing. Includes kidney and kidney-pancreas listings.
Figure KI 2
Figure KI 2
All adult candidates on the kidney transplant waiting list. Adult candidates on the list at any time during the year. Candidates listed at more than one center are counted once per listing. Includes kidney and kidney-pancreas candidates.
Figure KI 3
Figure KI 3
Distribution of adults waiting for kidney transplant by age. Candidates waiting for trans- plant at any time in the given year. Candidates listed at more than one center are counted once per listing. Active and inactive candidates are included. Age is determined at the earliest of transplant, death, removal, or December 31 of the year.
Figure KI 4
Figure KI 4
Distribution of adults waiting for kidney transplant by sex. Candidates waiting for trans- plant at any time in the given year. Candidates listed at more than one center are counted once per listing. Active and inactive patients are included.
Figure KI 5
Figure KI 5
Distribution of adults waiting for kidney transplant by race. Candidates waiting for trans- plant at any time in the given year. Candidates listed at more than one center are counted once per listing. Active and inactive patients are included.
Figure KI 6
Figure KI 6
Distribution of adults waiting for kidney transplant by diagnosis. Candidates waiting for transplant at any time in the given year. Candidates listed at more than one center are counted once per listing. Active and inactive patients are included.
Figure KI 7
Figure KI 7
Distribution of adults waiting for kidney transplant by waiting time (years). Candidates waiting for transplant at any time in the given year. Candidates listed at more than one center are counted once per listing. Time on the waiting list is determined at the earliest of transplant, death, removal, or December 31 of the year. Candidates listed in the given year are considered to have been listed less than 1 year. Active and inactive candidates are included.
Figure KI 8
Figure KI 8
Distribution of adults waiting for kidney transplant by BMI. Candidates waiting for trans- plant at any time in the given year. Candidates listed at more than one center are counted once per listing. Active and inactive patients are included.
Figure KI 9
Figure KI 9
Distribution of adults waiting for kidney transplant by years on dialysis. Candidates waiting for transplant at any time in the given year. Candidates listed at more than one center are counted once per listing. Time on dialysis is computed as time from minimum of first ESRD service date or most recent graft failure to listing date or January 1 of the given year. Active and inactive candidates are included.
Figure KI 10
Figure KI 10
Distribution of adults waiting for kidney transplant by blood type. Candidates waiting for transplant at any time in the given year. Candidates listed at more than one center are counted once per listing. Active and inactive patients are included.
Figure KI 11
Figure KI 11
Distribution of adults waiting for kidney transplant by prior transplant status. Candi- dates waiting for transplant at any time in the given year. Candidates listed at more than one center are counted once per listing. Active and inactive patients are included.
Figure KI 12
Figure KI 12
Adults willing to accept a kidney designated ECD or KDPI >= 85% by age. Adults waiting for kidney transplant on December 31 of the given year. Candidates listed at more than one center are counted once per listing. Willingness to accept ECD at time of listing or willingness to accept a local non- zero HLA mismatch KDPI >=85% kidney at the later of listing date or January 1 of the given year, beginning in 2014. ECD, expanded criteria donor.
Figure KI 13
Figure KI 13
Adults willing to accept kidney from HCV+ donor. Candidates waiting for transplant at any time in the given year. Candidates listed at more than one center are counted once per listing. Willingness to accept HCV+ organ at time of listing. HCV, hepatitus C virus.
Figure KI 14
Figure KI 14
Overall deceased donor kidney transplant rates among adult waitlist candidates. Transplant rates are computed as the number of deceased donor transplants per 100 patient-years of wait time in a given year. Individual listings are counted separately.
Figure KI 15
Figure KI 15
Deceased donor kidney transplant rates among adult waitlist candidates by age. Trans- plant rates are computed as the number of deceased donor transplants per 100 patient-years of wait time in a given year. Individual listings are counted separately. Age is determined at the later of listing date or January 1 of the given year.
Figure KI 16
Figure KI 16
Deceased donor kidney transplant rates among adult waitlist candidates by race. Transplant rates are computed as the number of deceased donor transplants per 100 patient-years of wait time in a given year. Individual listings are counted separately.
Figure KI 17
Figure KI 17
Deceased donor kidney transplant rates among adult waitlist candidates by diagnosis. Transplant rates are computed as the number of deceased donor transplants per 100 patient-years of wait time in a given year. Individual listings are counted separately.
Figure KI 18
Figure KI 18
Deceased donor kidney transplant rates among adult waitlist candidates by cPRA. Transplant rates are computed as the number of deceased donor transplants per 100 patient-years of wait time in a given year. Individual listings are counted separately. cPRA is determined at the later of listing date or January 1 of the given year.
Figure KI 19
Figure KI 19
Deceased donor kidney transplant rates among adult waitlist candidates by blood type. Transplant rates are computed as the number of deceased donor transplants per 100 patient-years of wait time in a given year. Individual listings are counted separately.
Figure KI 20
Figure KI 20
Deceased donor kidney transplant rates among adult waitlist candidates by time on the waitlist. Transplant rates are computed as the number of deceased donor transplants per 100 patient-years of wait time in a given year. Individual listings are counted separately.
Figure KI 21
Figure KI 21
Deceased donor kidney transplant rates among adult waitlist candidates by sex. Trans- plant rates are computed as the number of deceased donor transplants per 100 patient-years of wait time in a given year. Individual listings are counted separately.
Figure KI 22
Figure KI 22
Deceased donor kidney transplant rates among adult waitlist candidates by metropoli- tan vs. non-metropolitan residence. Transplant rates are computed as the number of deceased donor transplants per 100 patient-years of wait time in a given year. Individual listings are counted separately. Metropolitan/non-metropolitan determination is made using the RUCA (rural-urban commuting area) des- ignation of the candidate’s permanent zip code.
Figure KI 23
Figure KI 23
Three-year outcomes for adults waiting for kidney transplant, new listings in 2016- 2018. Candidates listed at more than one center are counted once per listing. Removed from list includes all reasons except transplant and death. DD, deceased donor; LD, living donor.
Figure KI 24
Figure KI 24
Percentage of adults who underwent deceased donor kidney transplant within a given time period of listing. Candidates listed at more than one center are counted once per listing.
Figure KI 25
Figure KI 25
Overall pretransplant mortality rates among adults waitlisted for kidney transplant. Mortality rates are computed as the number of deaths per 100 patient-years of waiting in the given year. Waiting time is censored at transplant, death, transfer to another program, removal because of improved condition, or end of cohort. Individual listings are counted separately.
Figure KI 26
Figure KI 26
Pretransplant mortality rates among adults waitlisted for kidney transplant by age. Mortality rates are computed as the number of deaths per 100 patient-years of waiting in the given year. Waiting time is censored at transplant, death, transfer to another program, removal because of improved condition, or end of cohort. Individual listings are counted separately. Age is determined at the later of listing date or January 1 of the given year.
Figure KI 27
Figure KI 27
Pretransplant mortality rates among adults waitlisted for kidney transplant by race. Mortality rates are computed as the number of deaths per 100 patient-years of waiting in the given year. Waiting time is censored at transplant, death, transfer to another program, removal because of improved condition, or end of cohort. Individual listings are counted separately.
Figure KI 28
Figure KI 28
Pretransplant mortality rates among adults waitlisted for kidney transplant by sex. Mortality rates are computed as the number of deaths per 100 patient-years of waiting in the given year. Waiting time is censored at transplant, death, transfer to another program, removal because of improved condition, or end of cohort. Individual listings are counted separately.
Figure KI 29
Figure KI 29
Pretransplant mortality rates among adults waitlisted for kidney transplant by diag- nosis. Mortality rates are computed as the number of deaths per 100 patient-years of waiting in the given year. Waiting time is censored at transplant, death, transfer to another program, removal because of im- proved condition, or end of cohort. Individual listings are counted separately.
Figure KI 30
Figure KI 30
Pretransplant mortality rates among adults waitlisted for kidney transplant by blood type. Mortality rates are computed as the number of deaths per 100 patient-years of waiting in the given year. Waiting time is censored at transplant, death, transfer to another program, removal because of improved condition, or end of cohort. Individual listings are counted separately.
Figure KI 31
Figure KI 31
Pretransplant mortality rates among adults waitlisted for kidney transplant by metropolitan vs. non-metropolitan residence. Mortality rates are computed as the number of deaths per 100 patient-years of waiting in the given year. Waiting time is censored at transplant, death, trans- fer to another program, removal because of improved condition, or end of cohort. Individual listings are counted separately. Urban/rural determination is made using the RUCA (rural-urban commuting area) designation of the candidate’s permanent zip code.
Figure KI 32
Figure KI 32
Pretransplant mortality rates among adults waitlisted for kidney transplant in 2021 by DSA. Mortality rates are computed as the number of deaths per 100 patient-years of waiting in the given year. Waiting time is censored at transplant, death, transfer to another program, removal because of improved condition, or end of cohort. Individual listings are counted separately.
Figure KI 33
Figure KI 33
Deaths within six months after removal among adult kidney waitlist candidates, over- all. Denominator includes only candidates removed from the waiting list for reasons other than transplant or death while on the list.
Figure KI 34
Figure KI 34
Deaths within six months after removal among adult kidney waitlist candidates, by diagnosis group at removal. Denominator includes only candidates removed from the waiting list for reasons other than transplant or death while on the list.
Figure KI 35
Figure KI 35
Deaths within six months after removal among adult kidney waitlist candidates, by age. Denominator includes only candidates removed from the waiting list for reasons other than trans- plant or death while on the list. Age is determined at the later of listing date or January 1 of the given year.
Figure KI 36
Figure KI 36
Overall deceased kidney donor count. Count of deceased donors from whom at least one kidney was recovered for transplant.
Figure KI 37
Figure KI 37
Deceased kidney donor count by age. Count of deceased donors from whom at least one kidney was recovered for transplant.
Figure KI 38
Figure KI 38
Deceased kidney donor count by HCV status. Count of deceased donors from whom at least one kidney was recovered for transplant. Donor HCV status was based on an antibody test.
Figure KI 39
Figure KI 39
Distribution of deceased kidney donors by age. Deceased donors from whom at least one kidney was recovered for transplant.
Figure KI 40
Figure KI 40
Distribution of deceased kidney donors by sex. Deceased donors from whom at least one kidney was recovered for transplant.
Figure KI 41
Figure KI 41
Distribution of deceased kidney donors by race. Deceased donors from whom at least one kidney was recovered for transplant.
Figure KI 42
Figure KI 42
Distribution of deceased kidney donors by donor HCV status. Deceased donors from whom at least one kidney was recovered for transplant. Donor HCV status was based on an antibody test.
Figure KI 43
Figure KI 43
Cause of death among deceased kidney donors. Deceased donors with at least one kidney recovered for transplant. Each donor is counted once. CVA, cerebrovascular accident.
Figure KI 44
Figure KI 44
Overall percent of kidneys recovered for transplant and not transplanted. Percentages of kidneys not transplanted out of all kidneys recovered for transplant.
Figure KI 45
Figure KI 45
Percent of kidneys recovered for transplant and not transplanted by donor age. Per- centages of kidneys not transplanted out of all kidneys recovered for transplant.
Figure KI 46
Figure KI 46
Percent of kidneys recovered for transplant and not transplanted by donor diabetes status. Percentages of kidneys not transplanted out of all kidneys recovered for transplant.
None
Figure KI 47: Percent of kidneys recovered for transplant and not transplanted by donor sex. Per- centages of kidneys not transplanted out of all kidneys recovered for transplant.
Figure KI 48
Figure KI 48
Percent of kidneys recovered for transplant and not transplanted by donor race. Per- centages of kidneys not transplanted out of all kidneys recovered for transplant.
Figure KI 49
Figure KI 49
Percent of kidneys recovered for transplant and not transplanted by donor hyperten- sion status. Percentages of kidneys not transplanted out of all kidneys recovered for transplant.
Figure KI 50
Figure KI 50
Percent of kidneys recovered for transplant and not transplanted by donor BMI. Per- centages of kidneys not transplanted out of all kidneys recovered for transplant.
None
Figure KI 51: Percent of kidneys recovered for transplant and not transplanted by donor terminal creatinine. Percentages of kidneys not transplanted out of all kidneys recovered for transplant.
Figure KI 52
Figure KI 52
Percent of kidneys recovered for transplant and not transplanted by donor biopsy status. Percentages of kidneys not transplanted out of all kidneys recovered for transplant. Kidneys are classified as biopsied if either of the donor’s kidneys was biopsied.
None
Figure KI 53: Percent of kidneys recovered for transplant and not transplanted by donor cause of death. Percentages of kidneys not transplanted out of all kidneys recovered for transplant. CVA, cere- brovascular accident.
Figure KI 54
Figure KI 54
Percent of kidneys recovered for transplant and not transplanted by donor HCV status. Percentages of kidneys not transplanted out of all kidneys recovered for transplant. Donor HCV status was based on an antibody test.
Figure KI 55
Figure KI 55
Percent of kidneys recovered for transplant and not transplanted, by donor risk of dis- ease transmission. Percentages of kidneys not transplanted out of all kidneys recovered for transplant. “Increased risk” is defined by criteria from the US Public Health Service Guidelines for increased risk for HIV, hepatitis B, and hepatitis C transmission.
Figure KI 56
Figure KI 56
Percent of kidneys recovered for transplant and not transplanted by DCD status. Per- centages of kidneys not transplanted out of all kidneys recovered for transplant. DBD, donation after brain death; DCD, donation after circulatory death.
Figure KI 57
Figure KI 57
Percent of kidneys recovered for transplant and not transplanted by KDPI. Percentages of kidneys not transplanted out of all kidneys recovered for transplant, by KDPI classification. Conversion of KDRI to KDPI is done using the OPTN KDPI Mapping Tables. For donors recovered January through May, the cohort 2 years prior was used to assign KDPI; for donors recovered June through December, the cohort 1 year prior was used to assign KDPI. KDPI, kidney donor profile index; KDRI, kidney donor risk index.
Figure KI 58
Figure KI 58
Number of living kidney transplants by donor relation. As reported on the OPTN Living Donor Registration Form.
Figure KI 59
Figure KI 59
Living kidney donors by age. As reported on the OPTN Living Donor Registration Form.
Figure KI 60
Figure KI 60
Living kidney donors by sex. As reported on the OPTN Living Donor Registration Form.
Figure KI 61
Figure KI 61
Living kidney donors by race. As reported on the OPTN Living Donor Registration Form.
Figure KI 62
Figure KI 62
Intended living kidney donor procedure type. As reported on the OPTN Living Donor Registration Form.
Figure KI 63
Figure KI 63
BMI among living kidney donors. Donor height and weight reported on the OPTN Living Donor Registration Form.
Figure KI 64
Figure KI 64
Overall kidney transplants. All kidney transplant recipients, including adult and pediatric, retransplant, and multiorgan recipients.
Figure KI 65
Figure KI 65
Total kidney transplants by donor type. All kidney transplant recipients, including adult and pediatric, retransplant, and multiorgan recipients.
Figure KI 66
Figure KI 66
Total kidney transplants by age. All kidney transplant recipients, including adult and pediatric, retransplant, and multiorgan recipients.
Figure KI 67
Figure KI 67
Total kidney transplants by sex. All kidney transplant recipients, including adult and pediatric, retransplant, and multiorgan recipients.
Figure KI 68
Figure KI 68
Total kidney transplants by race. All kidney transplant recipients, including adult and pediatric, retransplant, and multiorgan recipients.
Figure KI 69
Figure KI 69
Total kidney transplants by diagnosis. All kidney transplant recipients, including adult and pediatric, retransplant, and multiorgan recipients.
Figure KI 70
Figure KI 70
Kidney transplants by kidney donor profile index (KDPI). All adult recipients of deceased donor kidneys, including multiorgan transplants. Conversion of KDRI to KDPI is done using the OPTN KDPI Mapping Tables. For donors recovered January through May, the cohort 2 years prior was used to assign KDPI; for donors recovered June through December, the cohort 1 year prior was used to assign KDPI. Kidneys recovered en bloc are counted once. KDPI, kidney donor profile index; KDRI, kidney donor risk index.
Figure KI 71
Figure KI 71
Induction agent use in adult kidney transplant recipients. Immunosuppression at trans- plant reported to the OPTN.
Figure KI 72
Figure KI 72
Immunosuppression regimen use in adult kidney transplant recipients. Immunosup- pression regimen at transplant reported to the OPTN. Tac, tacrolimus. MMF, all mycophenolate agents.
Figure KI 73
Figure KI 73
Peak cPRA at time of kidney transplant in adult deceased donor recipients. Peak cPRA is used.
Figure KI 74
Figure KI 74
Peak cPRA at time of kidney transplant in adult living donor recipients. Peak cPRA is used.
None
Figure KI 75: Total HLA A, B, and DR mismatches among adult kidney transplant recipients, 2017- 2021. Donor and recipient antigen matching is based on OPTN antigen values and split equivalences policy as of 2019.
Figure KI 76
Figure KI 76
Delayed graft function among adult kidney transplant recipients. All adult recipients of kidneys. Delayed graft function is defined as dialysis administered within the first seven days posttrans- plant.
Figure KI 77
Figure KI 77
Graft survival among adult deceased donor kidney transplant recipients, 2014-2016, by age. Graft survival estimated using unadjusted Kaplan-Meier methods.
Figure KI 78
Figure KI 78
Graft survival among adult deceased donor kidney transplant recipients, 2014-2016, by diagnosis. Graft survival estimated using unadjusted Kaplan-Meier methods.
Figure KI 79
Figure KI 79
Graft survival among adult deceased donor kidney transplant recipients, 2014-2016, by KDPI. Graft survival estimated using unadjusted Kaplan-Meier methods. Conversion of KDRI to KDPI is done using the OPTN KDPI Mapping Tables. For donors recovered January through May, the cohort 2 years prior was used to assign KDPI; for donors recovered June through December, the cohort 1 year prior was used to assign KDPI. KDPI, kidney donor profile index.
Figure KI 80
Figure KI 80
Graft survival among adult deceased donor kidney transplant recipients, 2014-2016, by DCD status. Graft survival estimated using unadjusted Kaplan-Meier methods. DCD, donation after circulatory death; DBD, donation after brain death.
Figure KI 81
Figure KI 81
Graft survival among adult deceased donor kidney transplant recipients, 2014-2016, by biopsy status. Graft survival estimated using unadjusted Kaplan-Meier methods. Kidneys are classified as biopsied if either of the donor’s kidneys was biopsied.
Figure KI 82
Figure KI 82
Graft survival among adult deceased donor kidney transplant recipients, 2014-2016, by BMI. Graft survival estimated using unadjusted Kaplan-Meier methods.
Figure KI 83
Figure KI 83
Graft survival among adult deceased donor kidney transplant recipients, 2014-2016, by metropolitan vs. non-metropolitan recipient residence. Graft survival estimated using unadjusted Kaplan-Meier methods.
Figure KI 84
Figure KI 84
Graft survival among adult living donor kidney transplant recipients, 2014-2016, by age. Graft survival estimated using unadjusted Kaplan-Meier methods.
Figure KI 85
Figure KI 85
Graft survival among adult living donor kidney transplant recipients, 2014-2016, by race. Graft survival estimated using unadjusted Kaplan-Meier methods.
Figure KI 86
Figure KI 86
Graft survival among adult living donor kidney transplant recipients, 2014-2016, by diagnosis. Graft survival estimated using unadjusted Kaplan-Meier methods.
Figure KI 87
Figure KI 87
Graft survival among adult living donor kidney transplant recipients, 2014-2016, by metropolitan vs. non-metropolitan recipient residence. Graft survival estimated using unadjusted Kaplan-Meier methods.
Figure KI 88
Figure KI 88
Distribution of eGFR at 12 months posttransplant among adult deceased donor kidney transplant recipients. GFR (mL/min/1.73 m2) estimated using the Chronic Kidney Disease Epidemiology Collaboration equation, and computed by SRTR for patients alive with graft function at 12 months post- transplant.
Figure KI 89
Figure KI 89
Distribution of eGFR at 12 months posttransplant among adult living donor kidney transplant recipients. GFR (mL/min/1.73 m2) estimated using the Chronic Kidney Disease Epidemiology Collaboration equation, and computed by SRTR for patients alive with graft function at 12 months post- transplant.
Figure KI 90
Figure KI 90
Incidence of acute rejection by 1 year posttransplant among adult kidney transplant recipients by age. Only the first reported rejection event is counted. Cumulative incidence is estimated using the Kaplan-Meier method.
Figure KI 91
Figure KI 91
Incidence of acute rejection by 1 year posttransplant among adult kidney transplant recipients by induction agent. Only the first reported rejection event is counted. Cumulative incidence is estimated using the Kaplan-Meier method. IL2Ab, interleukin 2 receptor antibody; TCD, T-cell depleting.
None
Figure KI 92: Incidence of PTLD among adult kidney transplant recipients by recipient EBV status at transplant, 2010-2016. Cumulative incidence is estimated using the Kaplan-Meier method. PTLD is identified as a reported complication or cause of death on the OPTN Transplant Recipient Follow-up Form or the Posttransplant Malignancy Form as polymorphic PTLD, monomorphic PTLD, or Hodgkin’s disease. Only the earliest date of PTLD diagnosis is considered. EBV, Epstein-Barr virus; PTLD, posttransplant lym- phoproliferative disorder.
Figure KI 93
Figure KI 93
Patient survival among adult deceased donor kidney transplant recipients, 2014-2016, by age. Patient survival estimated using unadjusted Kaplan-Meier methods.
Figure KI 94
Figure KI 94
Patient survival among adult deceased donor kidney transplant recipients, 2014-2016, by diagnosis. Patient survival estimated using unadjusted Kaplan-Meier methods.
Figure KI 95
Figure KI 95
Patient survival among adult deceased donor kidney transplant recipients, 2014-2016, by metropolitan vs. non-metropolitan recipient residence. Patient survival estimated using unad- justed Kaplan-Meier methods.
Figure KI 96
Figure KI 96
Patient survival among adult deceased donor kidney transplant recipients, 2014-2016, by KDPI. Patient survival estimated using unadjusted Kaplan-Meier methods. Conversion of KDRI to KDPI is done using the OPTN KDPI Mapping Tables. For donors recovered January through May, the cohort 2 years prior was used to assign KDPI; for donors recovered June through December, the cohort 1 year prior was used to assign KDPI. KDPI, kidney donor profile index.
Figure KI 97
Figure KI 97
Patient survival among adult deceased donor kidney transplant recipients, 2014-2016, by biopsy status. Patient survival estimated using unadjusted Kaplan-Meier methods. Kidneys are clas- sified as biopsied if either of the donor’s kidneys was biopsied.
Figure KI 98
Figure KI 98
Patient survival among adult living donor kidney transplant recipients, 2014-2016, by age. Patient survival estimated using unadjusted Kaplan-Meier methods.
Figure KI 99
Figure KI 99
Patient survival among adult living donor kidney transplant recipients, 2014-2016, by diagnosis. Patient survival estimated using unadjusted Kaplan-Meier methods.
Figure KI 100
Figure KI 100
Patient survival among adult living donor kidney transplant recipients, 2014-2016, by race. Patient survival estimated using unadjusted Kaplan-Meier methods.
Figure KI 101
Figure KI 101
Patient survival among adult living donor kidney transplant recipients, 2014-2016, by metropolitan vs. non-metropolitan recipient residence. Patient survival estimated using unadjusted Kaplan-Meier methods.
Figure KI 102
Figure KI 102
New pediatric candidates added to the kidney transplant waiting list. A new candi- date is one who first joined the list during the given year, without having been listed in a previous year. Previously listed candidates who underwent transplant and subsequently relisted are considered new. Candidates listed at more than one center are counted once per listing. Active and inactive patients are included.
Figure KI 103
Figure KI 103
All pediatric candidates on the kidney transplant waiting list. Candidates listed at more than one center are counted once per listing; age determined at first listing.
Figure KI 104
Figure KI 104
Distribution of pediatric candidates waiting for kidney transplant by age. Candidates waiting for transplant at any time in the given year. Candidates listed at more than one center are counted once per listing. Active and inactive candidates are included. Age is determined at the earliest of transplant, death, removal, or December 31 of the year.
Figure KI 105
Figure KI 105
Distribution of pediatric candidates waiting for kidney transplant by race. Candidates waiting for transplant any time in the given year. Candidates listed at more than one center are counted once per listing. Active and inactive candidates are included.
None
Figure KI 106: Distribution of pediatric candidates waiting for kidney transplant by diagnosis. Can- didates waiting for transplant any time in the given year. Candidates listed at more than one center are counted once per listing. Diagnosis categories follow North American Pediatric Renal Trials and Collab- orative Studies recommendations. Active and inactive candidates are included. FSGS, focal segmental glomerulosclerosis; CAKUT, congenital anomalies of the kidney and urinary tract.
None
Figure KI 107: Distribution of pediatric candidates waiting for kidney transplant by sex. Candidates waiting for transplant any time in the given year. Candidates listed at more than one center are counted once per listing. Active and inactive patients are included.
Figure KI 108
Figure KI 108
Distribution of pediatric candidates waiting for kidney transplant by waiting time. Candidates waiting for transplant any time in the given year. Candidates listed at more than one center are counted once per listing. Time on the waiting list is determined at the earliest of transplant, death, removal, or December 31 of the year. Candidates listed in the given year are considered to have been listed less than 1 year. Active and inactive candidates are included.
None
Figure KI 109: Distribution of pediatric candidates waiting for kidney transplant by cPRA. Candidates waiting for transplant at any time in the given year. Candidates listed at more than one center are counted once per listing. cPRA is determined at the earliest of transplant, death, removal, or December 31 of the year. Active and inactive candidates are included.
Figure KI 110
Figure KI 110
Three-year outcomes for newly listed pediatric candidates waiting for kidney trans- plant, 2016-2018. Pediatric candidates who joined the waitlist in 2016-2018. Candidates listed at more than one center are counted once per listing. DD, deceased donor; LD, living donor.
Figure KI 111
Figure KI 111
Overall deceased donor kidney transplant rates among pediatric waitlist candidates. Transplant rates are computed as the number of deceased donor transplants per 100 patient-years of waiting in a given year. Individual listings are counted separately.
Figure KI 112
Figure KI 112
Deceased donor kidney transplant rates among pediatric waitlist candidates by age. Transplant rates are computed as the number of deceased donor transplants per 100 patient-years of waiting in a given year. Individual listings are counted separately. Age is determined at the later of listing date or January 1 of the given year.
None
Figure KI 113: Deceased donor kidney transplant rates among pediatric waitlist candidates by race. Transplant rates are computed as the number of deceased donor transplants per 100 patient-years of waiting in a given year. Individual listings are counted separately.
Figure KI 114
Figure KI 114
Deceased donor kidney transplant rates among pediatric waitlist candidates by cPRA. Transplant rates are computed as the number of deceased donor transplants per 100 patient-years of waiting in a given year. Individual listings are counted separately. cPRA is determined at the earliest of transplant, death, removal, or December 31 of the year.
None
Figure KI 115: Deceased donor kidney transplant rates among pediatric waitlist candidates by metropolitan vs. non-metropolitan residence. Transplant rates are computed as the number of de- ceased donor transplants per 100 patient-years of waiting in a given year. Individual listings are counted separately.
Figure KI 116
Figure KI 116
Overall pretransplant mortality rates among pediatric candidates waitlisted for kid- ney. Mortality rates are computed as the number of deaths per 100 patient-years of waiting in the given year. Waiting time is censored at transplant, death, transfer to another program, removal because of im- proved condition, or end of cohort. Individual listings are counted separately.
Figure KI 117
Figure KI 117
Pretransplant mortality rates among pediatric candidates waitlisted for kidney trans- plant by age. Mortality rates are computed as the number of deaths per 100 patient-years of waiting in the given year. Waiting time is censored at transplant, death, transfer to another program, removal because of improved condition, or end of cohort. Individual listings are counted separately. Age is determined at the later of listing date or January 1 of the given year.
Figure KI 118
Figure KI 118
Pretransplant mortality rates among pediatric candidates waitlisted for kidney trans- plant by race. Mortality rates are computed as the number of deaths per 100 patient-years of waiting in the given year. Waiting time is censored at transplant, death, transfer to another program, removal because of improved condition, or end of cohort. Individual listings are counted separately.
None
Figure KI 119: Pretransplant mortality rates among pediatric candidates waitlisted for kidney trans- plant by metropolitan vs. non-metropolitan residence. Mortality rates are computed as the number of deaths per 100 patient-years of waiting in the given year. Waiting time is censored at transplant, death, transfer to another program, removal because of improved condition, or end of cohort. Individual listings are counted separately. Urban/rural determination is made using the RUCA (rural-urban commuting area) designation of the candidate’s permanent zip code.
Figure KI 120
Figure KI 120
Overall pediatric kidney transplants. All pediatric kidney transplant recipients, including retransplant, and multiorgan recipients.
Figure KI 121
Figure KI 121
Pediatric kidney transplants by donor type. All pediatric kidney transplant recipients, including retransplant, and multiorgan recipients.
None
Figure KI 122: Pediatric kidney transplants by recipient age. All pediatric kidney transplant recipients, including retransplant, and multiorgan recipients.
Figure KI 123
Figure KI 123
Percent of pediatric kidney transplants from living donors by recipient age. All pedi- atric living kidney transplant recipients, including retransplant, and multiorgan recipients.
Figure KI 124
Figure KI 124
Number of centers performing pediatric and adult kidney transplants by center age mix. Adult centers performed transplants only for recipients aged 18 years or older. Functionally adult centers performed transplants for 80% adults or more, and the remainder were children aged 15-17 years. Mixed included adults and children of any age groups. Pediatric centers performed transplants for recipi- ents aged 0-17 years, and a small number of adults up to age 21 years.
Figure KI 125
Figure KI 125
Pediatric kidney recipients at programs that perform 5 or fewer pediatric transplants annually. Age groups are cumulative.
Figure KI 126
Figure KI 126
Induction agent use in pediatric kidney transplant recipients. Immunosuppression at transplant reported to the OPTN.
Figure KI 127
Figure KI 127
Immunosuppression regimen use in pediatric kidney transplant recipients. Immuno- suppression regimen at transplant reported to the OPTN. Tac, tacrolimus. MMF, all mycophenolate agents.
Figure KI 128
Figure KI 128
Total HLA A, B, and DR mismatches among pediatric kidney transplant recipients, 2017-2021. Donor and recipient antigen matching is based on OPTN antigen values and split equivalences policy as of 2019.
None
Figure KI 129: Delayed graft function among pediatric kidney transplant recipients. All pediatric recipients of kidneys. Delayed graft function is defined as dialysis administered within the first seven days posttransplant.
Figure KI 130
Figure KI 130
Distribution of eGFR at 12 months posttransplant among pediatric deceased donor kidney-alone transplant recipients. GFR (mL/min/1.73 m2) estimated using the bedside Schwartz equa- tion, and computed by SRTR for patients alive with graft function at 12 months posttransplant. Equation: eGFR = 0.413*Height(cm)/Creatinine (mg/dL).
Figure KI 131
Figure KI 131
Distribution of eGFR at 12 months posttransplant among pediatric living donor kidney-alone transplant recipients. GFR (mL/min/1.73 m2) estimated using the bedside Schwartz equa- tion, and computed by SRTR for patients alive with graft function at 12 months posttransplant. Equation: eGFR = 0.413*Height(cm)/Creatinine (mg/dL).
Figure KI 132
Figure KI 132
Graft failure among pediatric deceased donor kidney transplant recipients. All pedi- atric recipients of deceased donor kidneys, including multiorgan transplants. Estimates are unadjusted, computed using Kaplan-Meier methods. Recipients are followed to the earliest of kidney graft failure; kid- ney retransplant; return to dialysis; death; or 6 months, 1, 3, 5, or 10 years posttransplant. All-cause graft failure is defined as any of the prior outcomes prior to 6 months, 1, 3, 5, or 10 years, respectively.
Figure KI 133
Figure KI 133
Graft failure among pediatric living donor kidney transplant recipients. All pediatric recipients of living donor kidneys, including multiorgan transplants. Estimates are unadjusted, computed using Kaplan-Meier methods. Recipients are followed to the earliest of kidney graft failure; kidney retrans- plant; return to dialysis; death; or 6 months, 1, 3, 5, or 10 years posttransplant. All-cause graft failure is defined as any of the prior outcomes prior to 6 months, 1, 3, 5, or 10 years, respectively.
None
Figure KI 134: Graft survival among pediatric deceased donor kidney transplant recipients, 2014- 2016, by age. Recipient survival estimated using unadjusted Kaplan-Meier methods.
Figure KI 135
Figure KI 135
Graft survival among pediatric kidney transplant recipients, 2014-2016, by donor type. Recipient survival estimated using unadjusted Kaplan-Meier methods.
Figure KI 136
Figure KI 136
Incidence of acute rejection by 1 year posttransplant among pediatric kidney trans- plant recipients by age. Only the first reported rejection event is counted. Cumulative incidence is esti- mated using the Kaplan-Meier method.
Figure KI 137
Figure KI 137
Incidence of PTLD among pediatric kidney transplant recipients by recipient EBV sta- tus at transplant, 2010-2016. Cumulative incidence is estimated using the Kaplan-Meier method. PTLD is identified as a reported complication or cause of death on the OPTN Transplant Recipient Follow-up Form or on the Posttransplant Malignancy Form as polymorphic PTLD, monomorphic PTLD, or Hodgkin’s disease. Only the earliest date of PTLD diagnosis is considered. EBV, Epstein-Barr virus. PTLD, posttrans- plant lymphoproliferative disorder.
None
Figure KI 138: Patient death among pediatric kidney transplant recipients. All pediatric recipients of deceased donor kidneys, including multiorgan transplants. Estimates are unadjusted, computed using unadjusted Kaplan-Meier methods.
Figure KI 139
Figure KI 139
Overall patient survival among pediatric deceased donor kidney transplant recipi- ents, 2014-2016. Recipient survival estimated using unadjusted Kaplan-Meier methods.
Figure KI 140
Figure KI 140
Patient survival among pediatric deceased donor kidney transplant recipients, 2014- 2016, by recipient age. Recipient survival estimated using unadjusted Kaplan-Meier methods.

References

    1. Executive Office of the President Executive Order 13879 of July 10, 2019: Advancing American Kidney Health. 2019. https://www.federalregister.gov/documents/2019/07/15/2019-15159/ advanci...
    1. Abara W.E., Collier M.G., Moorman A., et al. Characteristics of Deceased Solid Organ Donors and Screening Results for Hepatitis B, C, and Human Im- munodeficiency Viruses — United States, 2010–2017. MMWR. 2019;68:61–66. doi: 10.15585/mmwr.mm6803a2. - DOI - PMC - PubMed
    1. US Department of Health and Human Services Health Resources and Services Ad- ministration. New Rule Expands the Scope of Reimbursable Expenses for Living Or- gan Donation. 2020. https://www.hrsa.gov/about/ news/press-releases/new-rule-expands-scope-l...
    1. Lentine K.L., Mannon R.B., Mandelbrot D. Understanding and Overcoming Finan- cial Risks for Living Organ Donors. Am J Kidney Dis. 2022 Feb;79(2):159–161. doi: 10.1053/j.ajkd.2021.09.003. - DOI - PubMed
    1. Stewart D.E., Foutz J., Kamal L., et al. The Independent Effects of Procurement Biopsy Findings on 10-Year Outcomes of Extended Criteria Donor Kidney Transplants. Kid- ney Int Rep. 2022;7(8):1850–1865. doi: 10.1016/j.ekir.2022.05.027. - DOI - PMC - PubMed