

Interfacial Dynamics and Growth Modes of β2-Microglobulin Dimers
- PMID: 37132512
- PMCID: PMC10369489
- DOI: 10.1021/acs.jcim.3c00399
Interfacial Dynamics and Growth Modes of β2-Microglobulin Dimers
Abstract
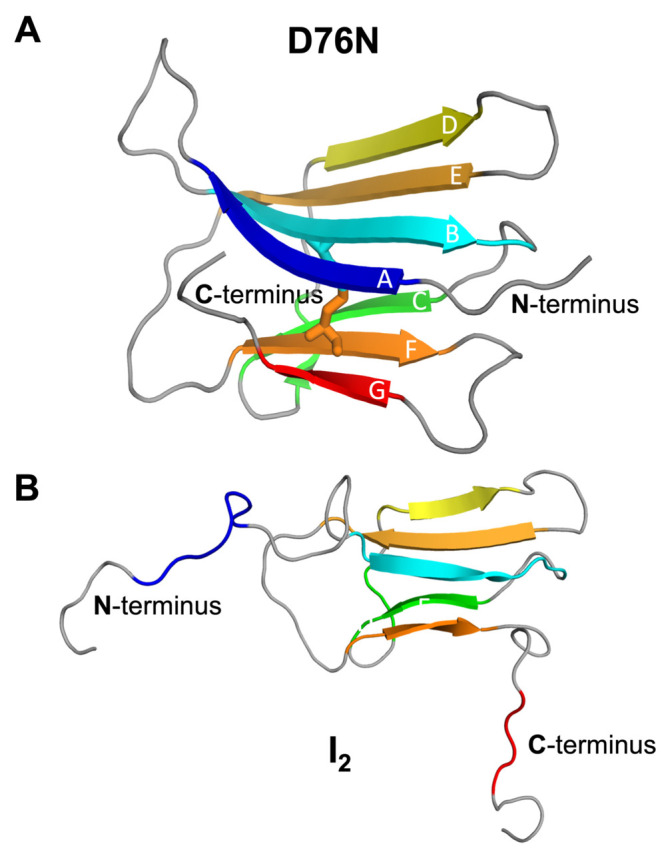
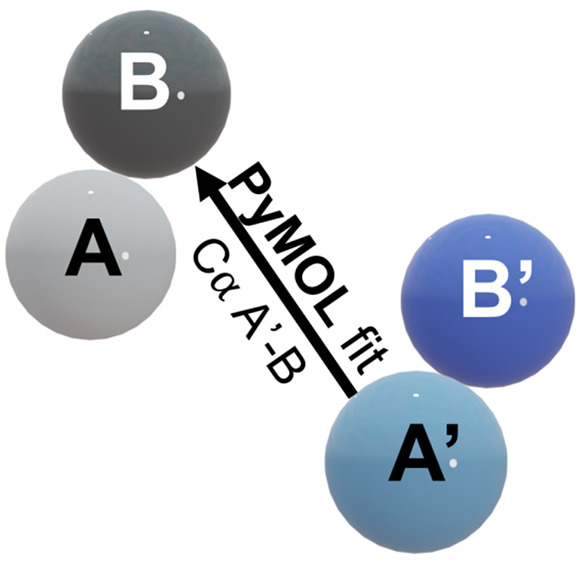
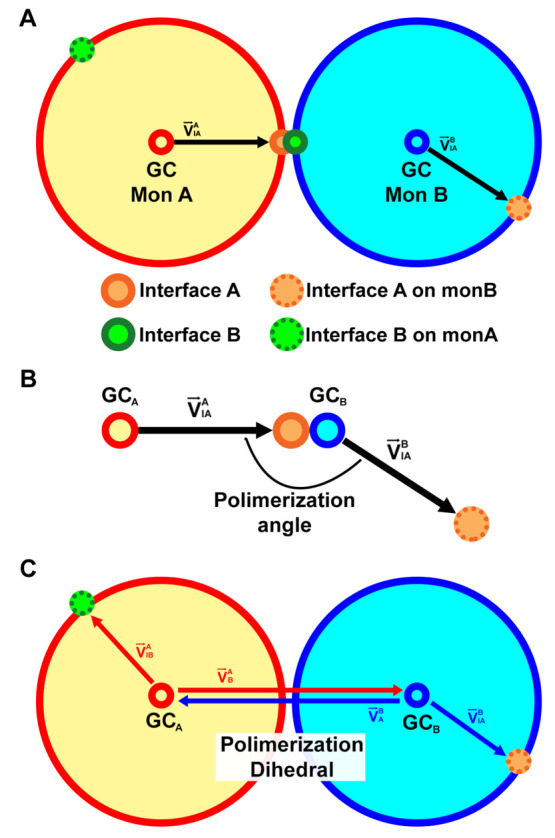
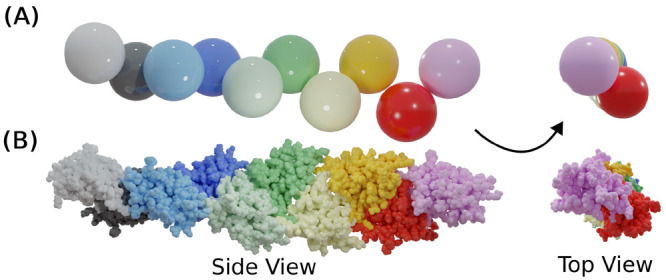
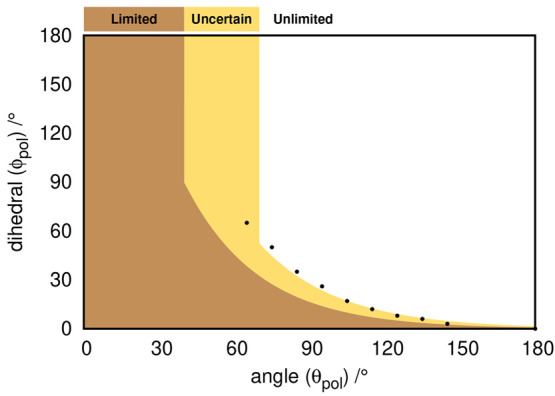
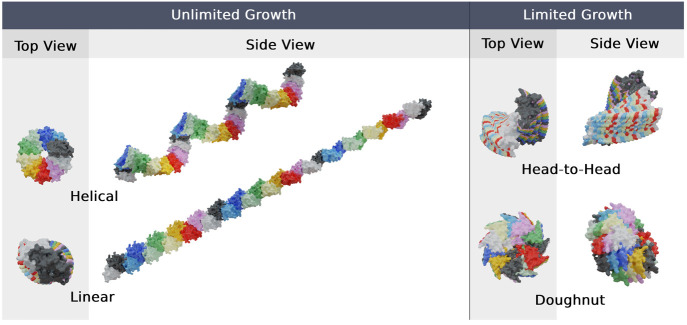
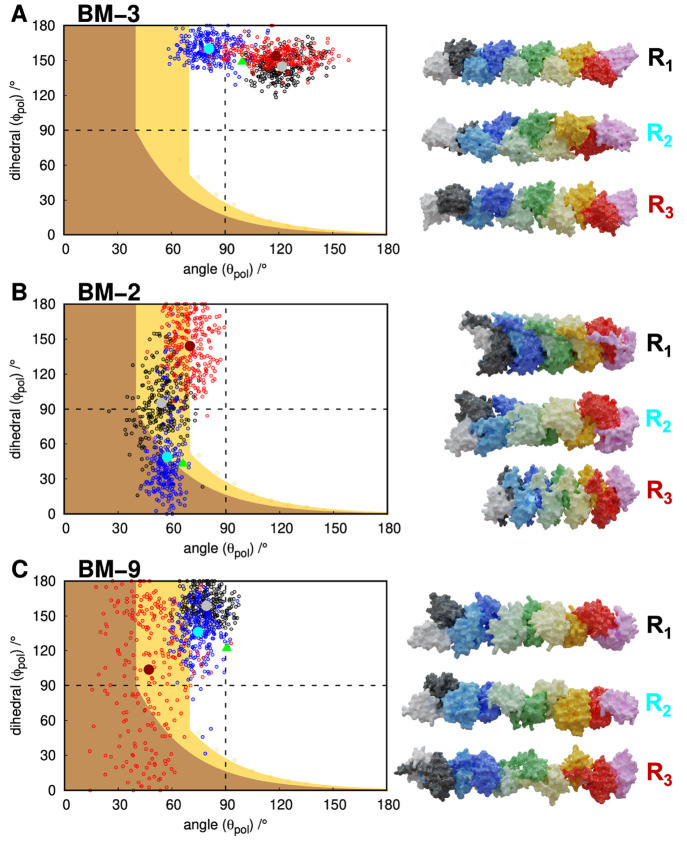
Protein aggregation is a complex process, strongly dependent on environmental conditions and highly structurally heterogeneous, both at the final level of fibril structure and intermediate level of oligomerization. Since the first step in aggregation is the formation of a dimer, it is important to clarify how certain properties of the latter (e.g., stability or interface geometry) may play a role in self-association. Here, we report a simple model that represents the dimer's interfacial region by two angles and combine it with a simple computational method to investigate how modulations of the interfacial region occurring on the ns-μs time scale change the dimer's growth mode. To illustrate the proposed methodology, we consider 15 different dimer configurations of the β2m D76N mutant protein equilibrated with long Molecular Dynamics simulations and identify which interfaces lead to limited and unlimited growth modes, having, therefore, different aggregation profiles. We found that despite the highly dynamic nature of the starting configurations, most polymeric growth modes tend to be conserved within the studied time scale. The proposed methodology performs remarkably well taking into consideration the nonspherical morphology of the β2m dimers, which exhibit unstructured termini detached from the protein's core, and the relatively weak binding affinities of their interfaces, which are stabilized by nonspecific apolar interactions. The proposed methodology is general and can be applied to any protein for which a dimer structure has been experimentally determined or computationally predicted.
Conflict of interest statement
The authors declare no competing financial interest.
Figures
Similar articles
-
Predicting stable binding modes from simulated dimers of the D76N mutant of 2-microglobulin.Comput Struct Biotechnol J. 2021 Sep 8;19:5160-5169. doi: 10.1016/j.csbj.2021.09.003. eCollection 2021. Comput Struct Biotechnol J. 2021. PMID: 34630936 Free PMC article.
-
A systematic molecular dynamics approach to the structural characterization of amyloid aggregation propensity of β2-microglobulin mutant D76N.Mol Biosyst. 2016 Mar;12(3):850-9. doi: 10.1039/c5mb00759c. Mol Biosyst. 2016. PMID: 26757617
-
A tale of two tails: The importance of unstructured termini in the aggregation pathway of β2-microglobulin.Proteins. 2017 Nov;85(11):2045-2057. doi: 10.1002/prot.25358. Epub 2017 Aug 8. Proteins. 2017. PMID: 28745031
-
Molecular interactions in the formation and deposition of beta2-microglobulin-related amyloid fibrils.Amyloid. 2005 Mar;12(1):15-25. doi: 10.1080/13506120500032352. Amyloid. 2005. PMID: 16076607 Review.
-
Computational studies of protein aggregation: methods and applications.Annu Rev Phys Chem. 2015 Apr;66:643-66. doi: 10.1146/annurev-physchem-040513-103738. Epub 2015 Feb 2. Annu Rev Phys Chem. 2015. PMID: 25648485 Review.
Cited by
-
Is There a Functional Role for the Knotted Topology in Protein UCH-L1?J Chem Inf Model. 2024 Sep 9;64(17):6827-6837. doi: 10.1021/acs.jcim.4c00880. Epub 2024 Jul 24. J Chem Inf Model. 2024. PMID: 39045738 Free PMC article.
-
Rational design of monomeric IL37 variants guided by stability and dynamical analyses of IL37 dimers.Comput Struct Biotechnol J. 2024 Apr 22;23:1854-1863. doi: 10.1016/j.csbj.2024.04.037. eCollection 2024 Dec. Comput Struct Biotechnol J. 2024. PMID: 38882680 Free PMC article.
References
-
- Gomes C. M.; Faísca P. F. N.. Protein Folding: An Introduction; SpringerBriefs in Molecular Science; Springer International Publishing: Cham, 2019; pp 1–63.
Publication types
MeSH terms
Substances
LinkOut - more resources
Full Text Sources
Research Materials
Miscellaneous
