. 2023 Aug 2;35(8):2799-2820.
doi: 10.1093/plcell/koad115.

CYCLOIDEA-like genes control floral symmetry, floral orientation, and nectar guide patterning

Affiliations

CYCLOIDEA-like genes control floral symmetry, floral orientation, and nectar guide patterning

Xia Yang et al. Plant Cell. .

Abstract

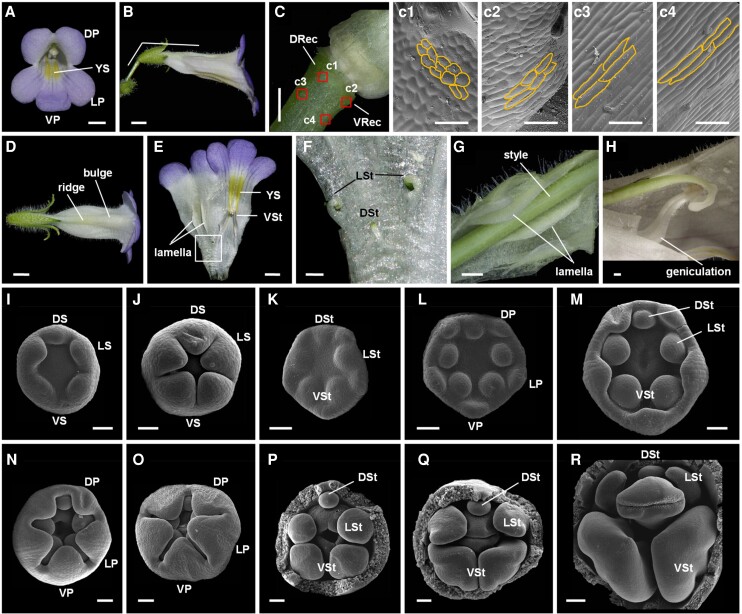
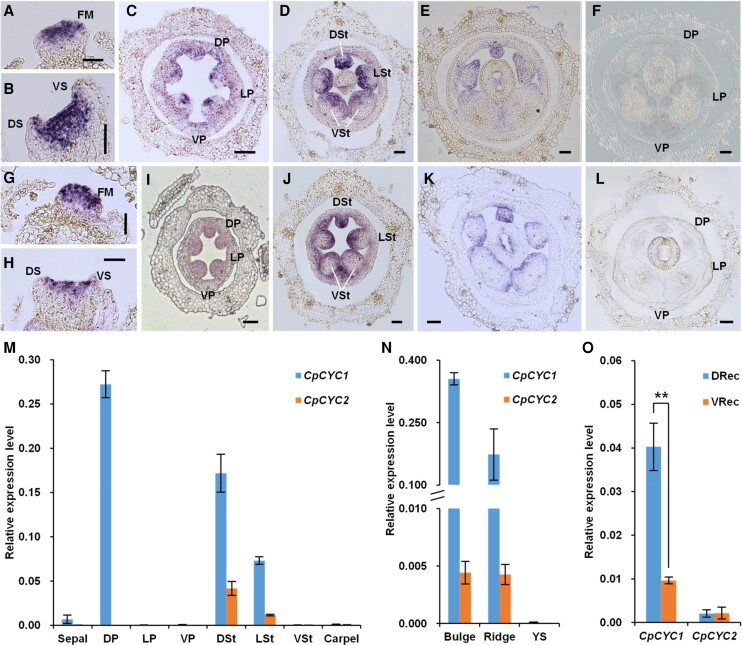
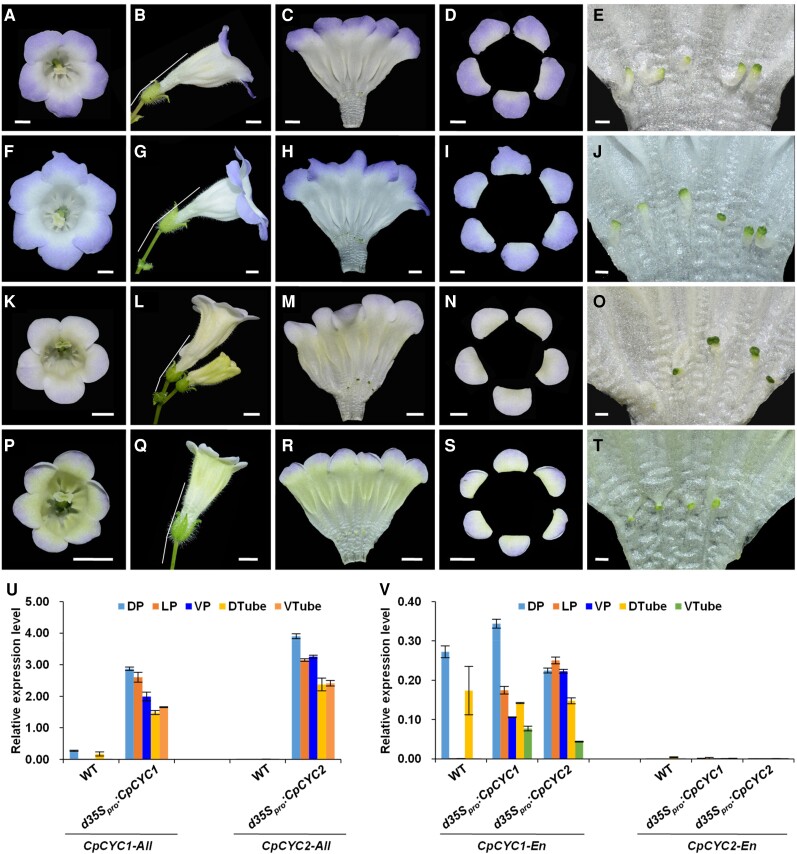
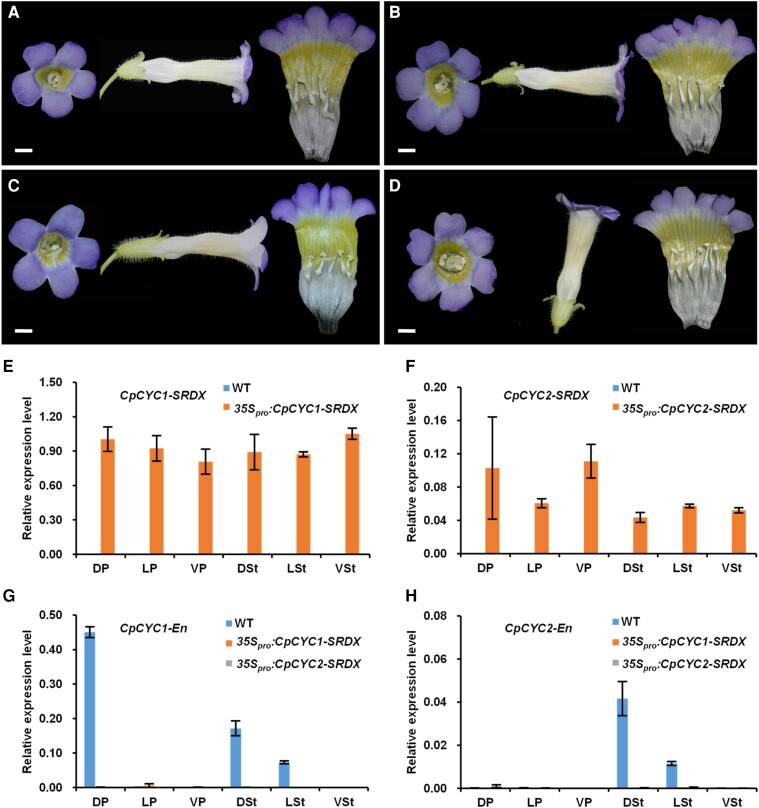
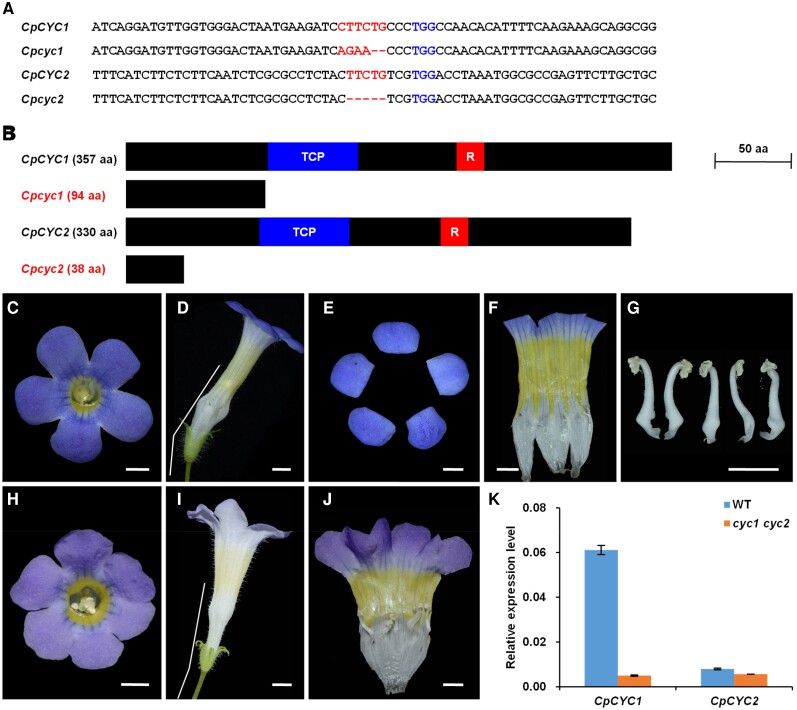
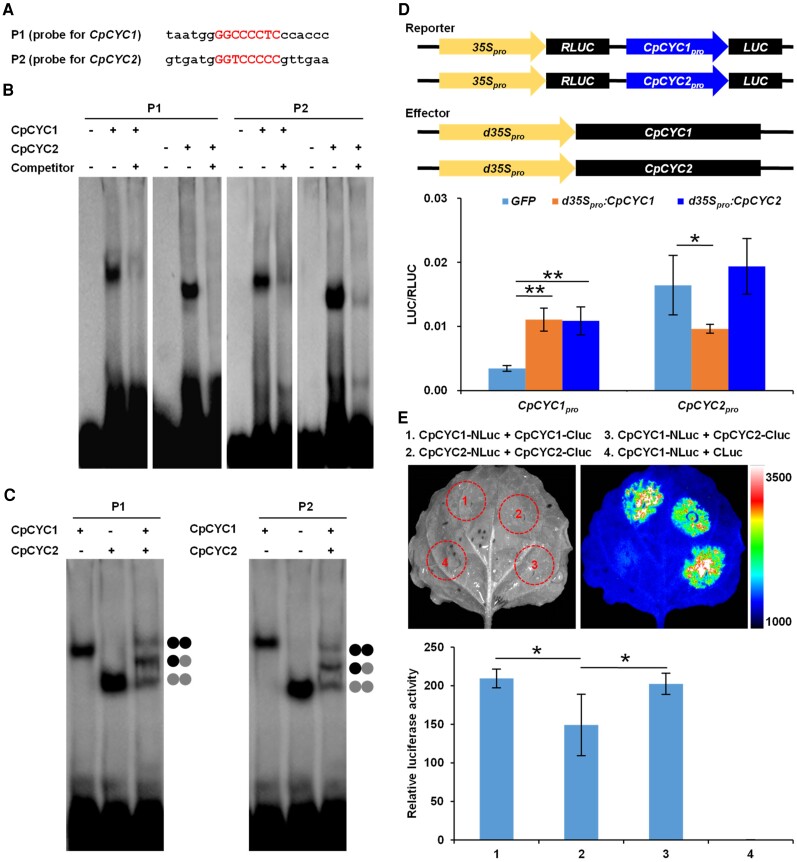
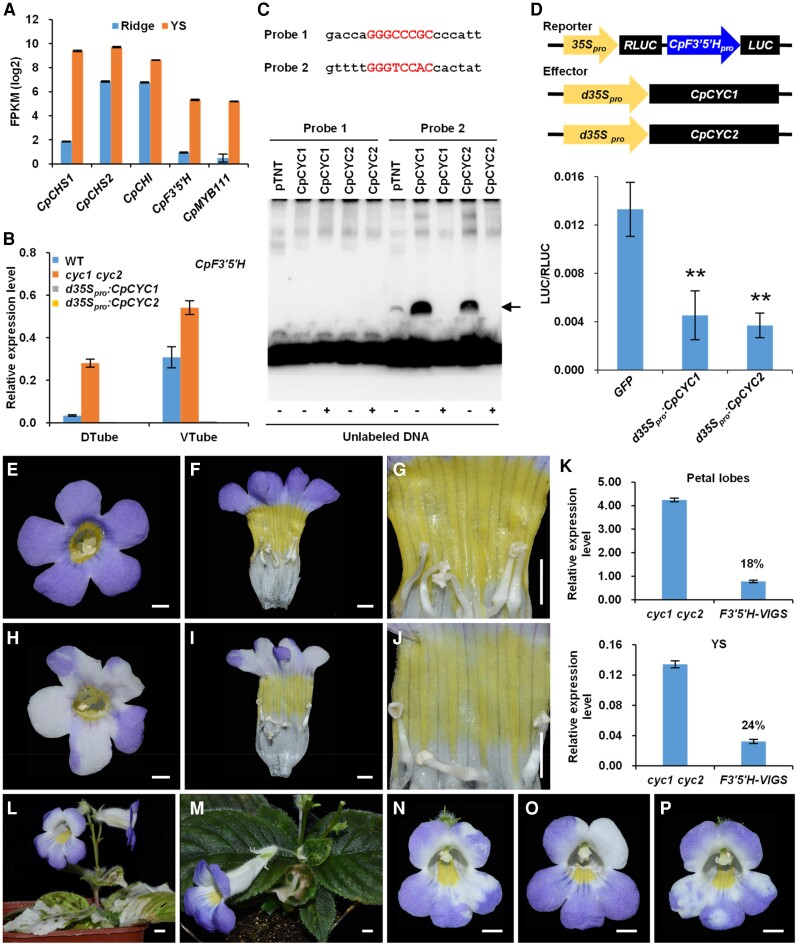
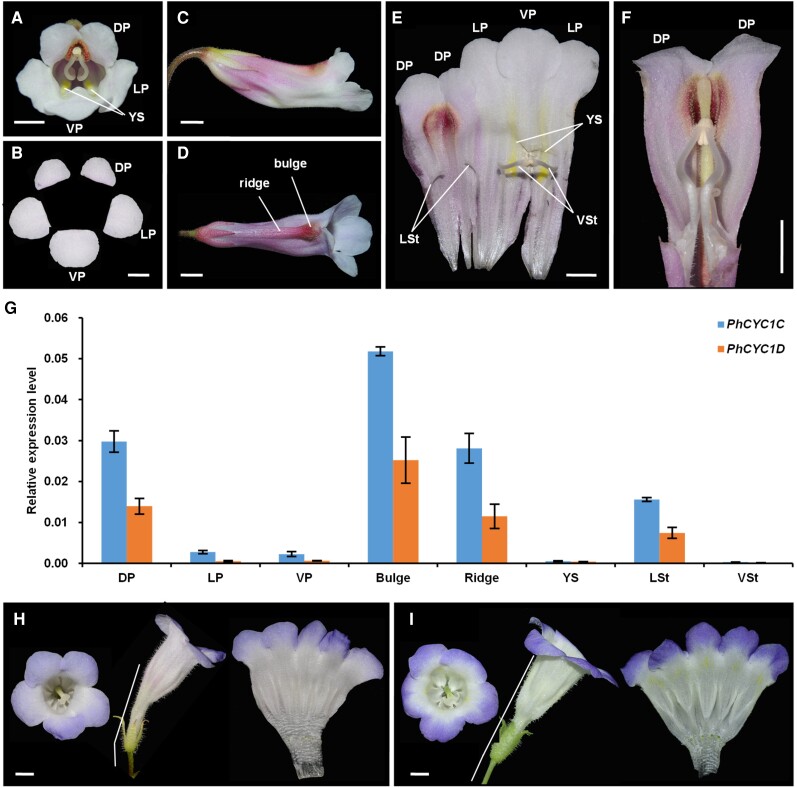
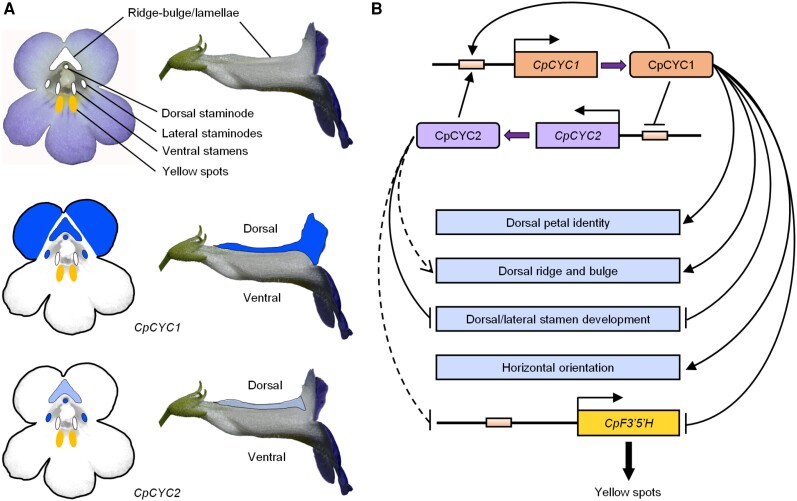
Actinomorphic flowers usually orient vertically (relative to the horizon) and possess symmetric nectar guides, while zygomorphic flowers often face horizontally and have asymmetric nectar guides, indicating that floral symmetry, floral orientation, and nectar guide patterning are correlated. The origin of floral zygomorphy is dependent on the dorsoventrally asymmetric expression of CYCLOIDEA (CYC)-like genes. However, how horizontal orientation and asymmetric nectar guides are achieved remains poorly understood. Here, we selected Chirita pumila (Gesneriaceae) as a model plant to explore the molecular bases for these traits. By analyzing gene expression patterns, protein-DNA and protein-protein interactions, and encoded protein functions, we identified multiple roles and functional divergence of 2 CYC-like genes, i.e. CpCYC1 and CpCYC2, in controlling floral symmetry, floral orientation, and nectar guide patterning. CpCYC1 positively regulates its own expression, whereas CpCYC2 does not regulate itself. In addition, CpCYC2 upregulates CpCYC1, while CpCYC1 downregulates CpCYC2. This asymmetric auto-regulation and cross-regulation mechanism might explain the high expression levels of only 1 of these genes. We show that CpCYC1 and CpCYC2 determine asymmetric nectar guide formation, likely by directly repressing the flavonoid synthesis-related gene CpF3'5'H. We further suggest that CYC-like genes play multiple conserved roles in Gesneriaceae. These findings shed light on the repeated origins of zygomorphic flowers in angiosperms.


Conflict of interest statement

Conflict of interest statement. The authors declare that there is no conflict of interest.

Figures

Figure 1.
Figure 1.
Flowers of wild-type C. pumila. A) Front view of a flower showing dorsal/lateral/ventral petals (DP/LP/VP) and yellow spots (YS). Scale bar: 0.5 cm. B) The lateral view of the flower showing the horizontal orientation. Scale bar: 0.5 cm. C) The asymmetric development of dorsal and ventral parts of the receptacle (DRec and VRec) with c1 to c4 showing cells in different regions. Scale bars: C) 0.5 cm; c1 to c4, 50 µm. D) Dorsal view of the flower showing the ridge and bulge structures in the dorsal corolla tube. Scale bar: 0.5 cm. E and F) The inner structure of the flower showing 2 lamellae, YS, ventral stamens (VSt), and dorsal/lateral staminodes (DSt/LSt). Scale bars: E) 0.5 cm; F) 0.1 cm. G) The style fits perfectly between 2 lamellae. Scale bar: 0.1 cm. H) The geniculate filament of the ventral stamens. Scale bar: 0.1 cm. I to R) Floral development revealed by SEM. DS/LS/VS, dorsa/lateral/ventral sepals. Scale bars: 50 µm.
Figure 2.
Figure 2.
Expression patterns of CpCYC1 and CpCYC2. A to E) The results of in situ hybridization using CpCYC1 antisense probe. CpCYC1 was expressed across floral meristems (FM; A and B) and the dorsal/lateral/ventral petal and stamen primordia (DP/LP/VP, DSt/LSt/VSt; C). Its signal then decreased in VSt D) and finally was specifically distributed in DP and DSt/LSt E). Scale bars: 50 µm. F) No signal was detected using CpCYC1 sense probe. Scale bar: 50 µm. G to K) The expression pattern of CpCYC2 was similar to that of CpCYC1 at early stages G to J), but its signal did not disappear in VSt at late stages of floral development K). Scale bars: 50 µm. L) No signal was detected using the CpCYC2 sense probe. Scale bar: 50 µm. M to O)CpCYC1 and CpCYC2 expression patterns in dissected floral organs, as revealed by RT-qPCR. The expression levels were normalized to those of CpACTIN. The error bars indicate the SD from 3 independent samples (except for sterile stamens). DS/VS, dorsal/ventral sepals; DRec/VRec, dorsal/ventral parts of the receptacle; YS, yellow spots. Asterisks indicate significant differences between samples (2-tailed Student's t test, **P < 0.01).
Figure 3.
Figure 3.
Ectopic expression of CpCYC1 and CpCYC2 generates dorsalized actinomorphic flowers. A to J) Representative flowers of d35Spro:CpCYC1 with 5 A to E) or 6 F to J) petals. Scale bars: A to D) and F to I), 0.5 cm; E) and J), 0.1 cm. K to T) Representative flowers of d35Spro:CpCYC2 with 5 K to O) or 6 P to T) petals. Scale bars: K to N) and P to S), 0.5 cm; O and T), 0.1 cm. U) Ectopic expression of CpCYC1-All and CpCYC2-All (including both exogenous and endogenous) in d35Spro:CpCYC1 and d35Spro:CpCYC2 transgenic lines. V) Expression of endogenous CpCYC1 (CpCYC1-En) and CpCYC2 (CpCYC2-En) in d35Spro:CpCYC1 and d35Spro:CpCYC2 transgenic lines. The expression levels were normalized to those of CpACTIN. The error bars indicate the SD from 3 independent samples. DP/LP/VP, dorsal/lateral/ventral petals; DTube/VTube, dorsal/ventral corolla tubes.
Figure 4.
Figure 4.
Knockdown of CpCYC1 and CpCYC2 generates ventralized actinomorphic flowers. A and B) Flowers of 35Spro:CpCYC1-SRDX with 5 A) or 6 B) petals. Scale bars: 0.5 cm. C and D) Flowers of 35Spro:CpCYC2-SRDX with 5 C) or 6 D) petals. Scale bars: 0.5 cm. E and F) Ectopic expression of exogenous CpCYC1-SRDX and CpCYC2-SRDX in 35Spro:CpCYC1-SRDXE) and 35Spro:CpCYC2-SRDXF) plants. G and H) Expression levels of endogenous CpCYC1 (CpCYC1-En, G) and CpCYC2 (CpCYC2-En, H) were greatly reduced in both transgenic plants. The expression levels were normalized to those of CpACTIN. The error bars indicate the SD from 3 independent samples (except for sterile stamens). DP/LP/VP, dorsal/lateral/ventral petals; DSt/LSt/VSt, dorsal/lateral/ventral stamens.
Figure 5.
Figure 5.
The cyc1 cyc2 double mutant generated by CRISPR/Cas9 produces ventralized actinomorphic flowers. A) The deletion and/or insertion mutations in CpCYC1 and CpCYC2 in the double mutant. B) The mutated CpCYC1 and CpCYC2 might generate truncated proteins. C to J) The double mutant produces fully ventralized flowers with upward orientation and uniform yellow spots. Scale bars: 0.5 cm. K) Expression levels of CpCYC1 and CpCYC2 were strongly reduced in the double mutant. Floral buds <0.5 cm long were used. The expression levels were normalized to those of CpACTIN. The error bars indicate the SD from 3 independent samples.
Figure 6.
Figure 6.
CpCYC1 and CpCYC2 undergo asymmetric auto-regulation and cross-regulation. A to C) EMSA showing that CpCYC1 and CpCYC2 recombinant proteins can bind to their own gene promoters by forming homodimers and heterodimers. The shift band was abolished when excessive amounts of unlabeled probes were added. D) Transient gene expression assays showing that overexpression of CpCYC1 and CpCYC2 enhances CpCYC1 promoter activity. Asterisks indicate significant differences (2-tailed Student's t test, *P < 0.05, **P < 0.01). E) LCI assays showing the quantification of homodimerization and heterodimerization between CpCYC1 and CpCYC2. Asterisks indicate significant differences (2-tailed Student's t test, *P < 0.05).
Figure 7.
Figure 7.
CpCYC1 and CpCYC2 repress yellow spot formation by negatively regulating CpF3′5′H. A) Expression difference of 5 genes involved in flavonoid synthesis between the dorsal ridge and ventral yellow spots in C. pumila revealed by RNA-seq. B) Expression changes of CpF3′5′H in CpCYC1 and CpCYC2 gain- and loss-of-function mutants. The expression levels were normalized to those of CpACTIN. The error bars indicate the SD from 3 independent samples. C) One of the 2 CYC-binding site in the CpF3′5′H promoter can be directly bound by CpCYC1 and CpCYC2 proteins translated using the wheat germ protein expression system (the arrow indicates the shifted band). D)CpF3′5′H is directly repressed by CpCYC1 and CpCYC2. Asterisks indicate significant differences between samples (2-tailed Student's t test, **P < 0.01). E to J) The downregulation of CpF3′5′H in the cyc1 cyc2 double mutant using VIGS leads to light yellow spots and bleached petal lobes H to J) compared to flowers without any mutant phenotype E to G) from the same plant. Scale bars: 0.5 cm. K) The expression level of CpF3′5′H is greatly reduced in both bleached petals and light yellow spots (18% and 24% relative to the control, respectively) collected from open flowers. The expression levels were normalized to those of CpACTIN. The error bars indicate the SD from 3 independent experiments. L and M) Knockdown of CpPDS only bleaches leaves and sepals. Scale bars: 0.5 cm. N to P) Knockdown of CpANS only decolors petal lobes. Scale bars: 0.5 cm.
Figure 8.
Figure 8.
P. heterotricha CYC1C and CYC1D genes have similar functions to CpCYC1. A and B)P. heterotricha produces zygomorphic flowers with 5 petals that differ in both size and morphology. Scale bars: 0.5 cm. C) Side view of a flower in the horizontal orientation. Scale bar: 0.5 cm. D) Dorsal view of a flower showing the bulge and ridge structures in the dorsal corolla tube. Scale bar: 0.5 cm. E) The inner structure of the flower showing 2 ventral fertile stamens and 2 lateral staminodes. Scale bar: 0.5 cm. F) The dorsal part of a corolla tube showing the inside of the bulge and ridge structures and the geniculate filaments of the ventral stamens. Scale bar: 0.5 cm. G) Expression patterns of PhCYC1C and PhCYC1D normalized to those of PhACTIN. The error bars indicate the SD from 3 independent samples. H and I) Overexpression of PhCYC1CH) and PhCYC1DI) generates dorsalized actinomorphic flowers. White bars: 0.5 cm. DP/LP/VP, dorsal/lateral/ventral petals; LSt/VSt, lateral/ventral stamens; YS, yellow spots.
Figure 9.
Figure 9.
Model showing the expression and functional divergence as well as the pleiotropic functions of CpCYC1 and CpCYC2. A)CpCYC1 and CpCYC2 have divergent expression patterns in the second and third whorls of floral organs. Dark blue represents higher expression levels, while light blue represents lower expression levels. B) Model showing the multiple functions, functional divergence, and the asymmetric auto-regulation and cross-regulation of CpCYC1 and CpCYC2. CpCYC1 independently controls dorsal petal identity and floral horizontal orientation and determines the development of the dorsal ridge and bulge together with CpCYC2. Both CpCYC1 and CpCYC2 are required to inhibit the development of dorsal and lateral stamens. They determine asymmetric nectar guide formation likely by directly repressing the flavonoid synthesis-related gene CpF3′5′H. Solid lines display strong promoting or repressive activity, while dashed lines represent weak activity.

Comment in

Similar articles

Cited by

References

    1. Armbruster WS, Pélabon C, Bolstad GH, Hansen TF. Integrated phenotypes: understanding trait covariation in plants and animals. Phil Trans R Soc Lond B Biol Sci. 2014:369(1649):20130245. 10.1098/rstb.2013.0245 - DOI - PMC - PubMed
    1. Bawa KS, Ingty T, Revell LJ, Shivaprakash KN. Correlated evolution of flower size and seed number in flowering plants (monocotyledons). Annals Bot. 2019:123(1):181–190. 10.1093/aob/mcy154 - DOI - PMC - PubMed
    1. Bradley D, Carpenter R, Sommer H, Hartley N, Coen E. Complementary floral homeotic phenotypes result from opposite orientations of a transposon at the plena-locus of Antirrhinum. Cell 1993:72(1):85–95. 10.1016/0092-8674(93)90052-R - DOI - PubMed
    1. Briscoe AD, Chittka L. The evolution of color vision in insects. Ann Rev Entomol. 2001:46(1):471–510. 10.1146/annurev.ento.46.1.471 - DOI - PubMed
    1. Busch A, Zachgo S. Control of corolla monosymmetry in the Brassicaceae Iberis amara. Proc Natl Acad Sci U S A. 2007:104(42):16714–16719. 10.1073/pnas.0705338104 - DOI - PMC - PubMed

Publication types

LinkOut - more resources