. 2023 May 15;136(10):jcs260458.
doi: 10.1242/jcs.260458. Epub 2023 May 31.

Single-cell intracellular pH dynamics regulate the cell cycle by timing the G1 exit and G2 transition

Affiliations

Single-cell intracellular pH dynamics regulate the cell cycle by timing the G1 exit and G2 transition

Julia S Spear et al. J Cell Sci. .

Abstract

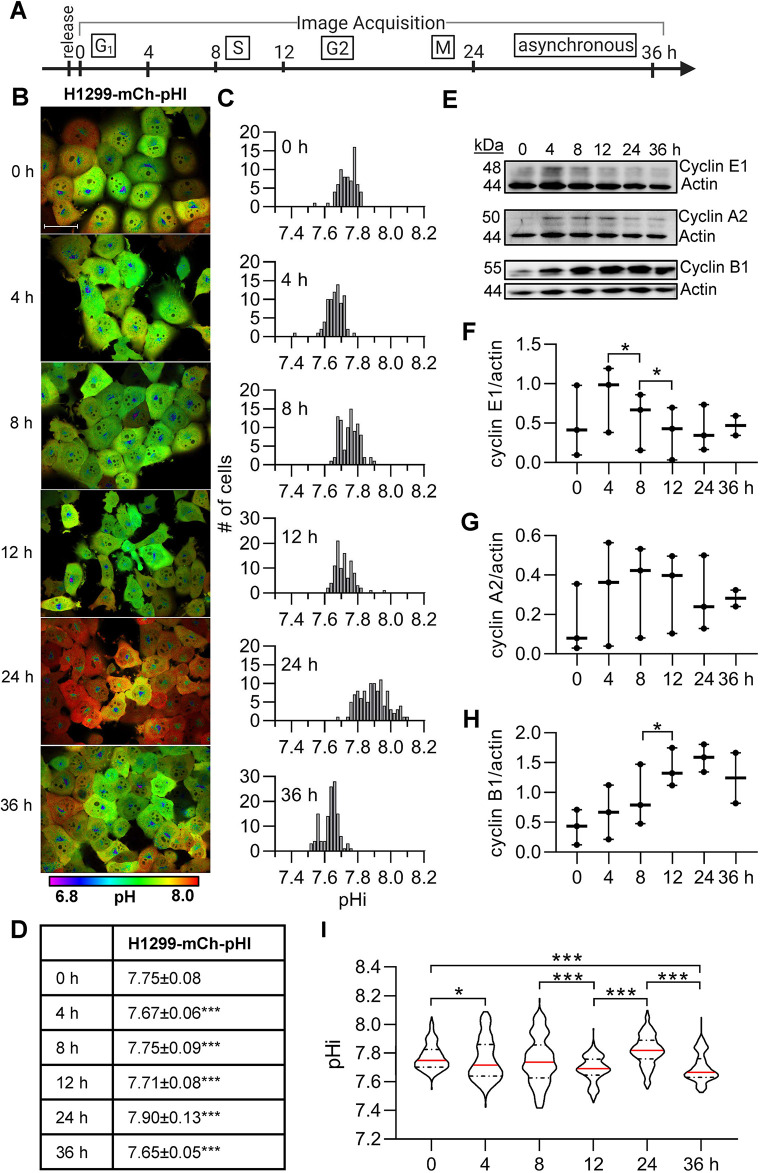
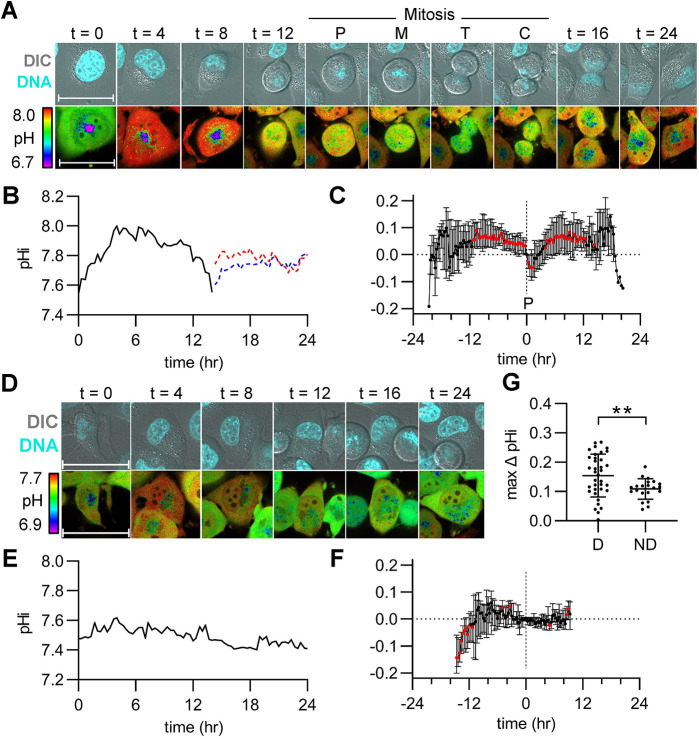
Transient changes in intracellular pH (pHi) regulate normal cell behaviors, but roles for spatiotemporal pHi dynamics in single-cell behaviors remain unclear. Here, we mapped single-cell spatiotemporal pHi dynamics during mammalian cell cycle progression both with and without cell cycle synchronization. We found that single-cell pHi is dynamic throughout the cell cycle: pHi decreases at G1/S, increases in mid-S, decreases at late S, increases at G2/M and rapidly decreases during mitosis. Importantly, although pHi is highly dynamic in dividing cells, non-dividing cells have attenuated pHi dynamics. Using two independent pHi manipulation methods, we found that low pHi inhibits completion of S phase whereas high pHi promotes both S/G2 and G2/M transitions. Our data also suggest that low pHi cues G1 exit, with decreased pHi shortening G1 and increased pHi elongating G1. Furthermore, dynamic pHi is required for S phase timing, as high pHi elongates S phase and low pHi inhibits S/G2 transition. This work reveals that spatiotemporal pHi dynamics are necessary for cell cycle progression at multiple phase transitions in single human cells.

Keywords: Cell cycle; Intracellular pH; Mitosis; Quantitative imaging; Single-cell methods; pH biosensor.


Conflict of interest statement

Competing interests The authors declare no competing or financial interests.

Figures

Fig. 1.
Fig. 1.
Intracellular pH is heterogeneous in normal and cancerous lung cell lines and median pHi significantly increases in cancer cells. (A) Schematic of single-cell pHi measurements using a stably expressed pH biosensor, mCherry–pHluorin (mCh-pHl), and the protonophore nigericin to standardize the biosensor (see Materials and Methods for details). (B–D) Representative images of pHi measurements and standardization in (B) NL20, (C) A549, and (D) H1299 cells stably expressing mCh-pHl. Ratiometric display of pHluorin/mCherry fluorescence ratios. Scale bars: 50 μm. (E–G) Histograms of single-cell pHi in (E) NL20 (n=173, three biological replicates), (F) A549 (n=424, four biological replicates) and (G) H1299 (n=315, three biological replicates). Histograms are binned at 0.02 pH units. Above histograms, median±interquartile range is shown. Significance was determined by a Mann–Whitney test (***P<0.001 compared to NL20).
Fig. 2.
Fig. 2.
Intracellular pH is dynamic following G1 synchronization and correlates with cyclin levels. (A) Schematic of image acquisition after palbociclib synchronization. (B) Representative images of H1299-mCh-pHl cells at indicated time points after release. Ratiometric display of pHluorin/mCherry fluorescence ratios. Scale bar: 50 μm. (C) Histograms of single-cell pHi data collected as in B, from one biological replicate. Histograms binned at 0.02 pH units. Additional replicates in Fig. S3. (D) Table of pHi values from data in C (median±interquartile range). (E) Representative immunoblots for cyclin E1, A2, and B1 with actin loading controls. Scatter plots of (F) cyclin E1, (G) cyclin A2, and (H) cyclin B1 immunoblot data (three biological replicates; median and range indicated). Additional replicates in Fig. S3. (I) Violin plots of raw pHi (0 h, n=231; 4 h, n= 253; 8 h, n=262; 12 h, n=273; 24 h, n=338; 36 h, n=262; three biological replicates). Red lines are the median and dashed lines mark quartiles. In D and I, significance was determined by Kruskal–Wallis test with Dunn's multiple comparisons correction. In F–H, significance was determined by paired two-tailed t-test. In D and F–I, each time point was compared to the preceding time point and, in I, 0 h was additionally compared to 24 h (*P<0.05; ***P<0.001).
Fig. 3.
Fig. 3.
Intracellular pH is dynamic after release from early S phase in H1299-mCh-pHl cells and correlates with cyclin levels. (A) Schematic of image acquisition after a double-thymidine synchronization. (B) Representative images of H1299-mCh-pHl cells at indicated time points after release. Ratiometric display of pHluorin/mCherry fluorescence ratios. Scale bar: 50 μm. (C) Histograms of single-cell pHi data collected in B, from one biological replicate. Histograms binned at 0.02 pH units. Additional replicates in Fig. S4. (D) Table of pHi values from data in C (median±interquartile range). (E) Representative immunoblots for cyclin E1, A2, and B1 with respective actin loading controls. Box-and-whisker plots of (F) cyclin E1, (G) cyclin A2, and (H) cyclin B1 immunoblot data (4 biological replicates). Additional replicates in Fig. S4. Median indicated by line, the box shows the 25–75th percentiles, and the whiskers show minimum and maximum values. (I) Violin plots of raw pHi values (0 h, n=500; 4 h, n= 468; 8 h, n=517; 12 h, n=558; 24 h, n=652; 4 biological replicates). Red lines are the median and dashed lines mark quartiles. In D and I, significance was determined by a Kruskal–Wallis test with Dunn's multiple comparisons correction. In F–H, significance was determined by a paired two-tailed t-test. In D and F–I, each time point was compared to its preceding time point and in I, 0 h was additionally compared to 24 h (*P<0.05; **P<0.01; ***P<0.001).
Fig. 4.
Fig. 4.
Intracellular pH increases leading to G2/M, followed by rapid acidification prior to division and pHi recovery in daughter cells. (A) Representative stills from Movie 1 of a dividing H1299-mCh-pHl cell at indicated time (h). Top is Hoechst 33342 dye (DNA, cyan) and DIC merge. Bottom is ratiometric display of pHluorin/mCherry fluorescence ratios. Scale bars: 50 μm. Labels indicate prophase (P), metaphase (M), telophase (T), and cytokinesis (C). (B) Traces of calculated pHi values of the parent cell in A (black, solid line) and in daughter cells (red and blue dotted lines). (C) pHi changes in dividing cells, relative to pHi at prophase (P, vertical dashed line) for each individual cell (median±interquartile range, n=39, four biological replicates). Significance was determined by a one-sample Wilcoxon test compared to 0 (red points are P<0.05). (D) Representative stills from Movie 2 of a non-dividing H1299-mCh-pHl cell at indicated time (h). Top is Hoechst 33342 dye (DNA, cyan) and DIC merge. Bottom is ratiometric display of pHluorin/mCherry fluorescence ratios. Scale bars: 50 μm. (E) Trace of pHi values of cell in D (black, solid line) over time. (F) pHi changes in non-dividing cells, relative to pHi for each individual cell at experimental time t=15 h (vertical dashed line) (median±interquartile range, n=25, four biological replicates). Significance was determined by a one-sample Wilcoxon test compared to 0 (red points are P<0.05).
Fig. 5.
Fig. 5.
Cells released from S phase synchronization show pHi increases, leading to G2/M, rapid acidification prior to division and pHi recovery of daughter cells. (A) Representative stills from Movie 3 of a dividing H1299-mCh-pHl cell at indicated time (h). Top is Hoechst 33342 dye (DNA, cyan) and DIC merge. Bottom is ratiometric display of pHluorin/mCherry fluorescence ratios. Scale bars: 50 μm. Labels indicate prophase (P), metaphase (M), telophase (T), and cytokinesis (C). (B) Traces of calculated pHi values of the cell in A (black, solid line) and in daughter cells (red and blue dotted lines). (C) pHi changes in dividing cells, relative to pHi at prophase (P, vertical dashed line) for each individual cell (median±interquartile range, n=39, three biological replicates). Significance was determined by a one-sample Wilcoxon test compared to 0 (red points are P<0.05). (D) Representative stills from Movie 4 of a non-dividing H1299-mCh-pHl cell at indicated time (h). Top is Hoechst 33342 dye (DNA, cyan) and DIC merge. Bottom is a ratiometric display of pHluorin/mCherry fluorescence ratios. Scale bars: 50 μm. (E) Trace of pHi values of cell in D (black, solid line) over time. (F) pHi changes in non-dividing cells, relative to pHi for each individual cell at experimental time t=15h (vertical dashed line), the average time of prophase for dividing cells in this dataset (median±interquartile range, n=22, 3 biological replicates). Significance was determined by a one-sample Wilcoxon test compared to 0 (red points are P<0.05). (G) Scatter plot of max pHi change in individual dividing (D) and non-dividing (ND) cells (mean±s.d.). Significance was determined by an unpaired two-tailed t-test (**P<0.01).
Fig. 6.
Fig. 6.
Single-cell pHi manipulation shows that pHi dynamics are key regulators of the cell cycle. (A) Median plots of single-cell ΔpHi from synchronizations and asynchronous (Asynch.) time-lapses. Data reproduced from Figs 2I, 3I, and 4C (thymidine, normalized to 4 h, n=4; palbociclib, normalized to 12 h, n=3; Asynch., normalized to prophase, n=4). (B) Single-cell pHi of H1299-mCh-pHl cells treated for 24 h with 15 μM EIPA and 30 μM S0859 (E+S, n=233) or 1 μM concanamycin A (CMA, n=79) to lower pHi, untreated (CRL, n=602), or supplemented with 100 mM NaHCO3 (HCO3, n=146) or 20 mM ammonium chloride (NH4Cl, n=193) to raise pHi (see Materials and Methods for details). Additional treatment time points are shown in Fig. S8. (C) Representative stills from Movie 5. Shown is a single H1299-FUCCI cell with PIP–mVenus (green) and mCherry–Geminin (magenta) tracked through each cell cycle phase. Hoechst 33342 dye (DNA, cyan) and DIC merge shown. Scale bars: 50 μm. (D) Schematic of PIP-FUCCI reporter fluorescence during cell cycle phase transitions (Grant et al., 2018). (E) Successful phase entry of cells starting in G1, where each treatment is normalized to matched controls. E+S (n=27), CMA (n=13), HCO3 (n=13), NH4Cl (n=13). For B, scatter plots (median±interquartile range), with Mann–Whitney test to determine statistical significance (***P<0.001).
Fig. 7.
Fig. 7.
Single-cell FUCCI traces show low pHi is a cue for G1 exit, S phase requires high and low pHi, and S/G2 requires high pHi. (A) Schematic of PIP–mVenus (green) and mCherry–Geminin (magenta) fluorescence intensities during cell cycle phases. (B–D) Traces from single H1299-FUCCI cells treated as in Fig. 6B (E+S, 15 μM EIPA plus 30 μM S0859; NH4Cl, 20 mM NH4Cl). Traces aligned at time of division at 0 h, and daughter cells are indicated by dotted lines: (B) E+S, (n=23); (C) CRL (n=187); (D) NH4Cl (n=72) (CRL and NH4Cl, three biological replicates; E+S, two biological replicates). In A–D: a.u., arbitrary units. (E–H) Cell cycle phase durations from all cell populations (dividers and non-dividers). (E) G1 (E+S, n=22; CRL, n=151; NH4Cl, n=51), (F) S (E+S, n=3; CRL, n=88; NH4Cl, n=26), (G) G2 (CRL, n=90; NH4Cl, n=34), and (H) M (E+S, n=18; CRL, n=113; NH4Cl, n=33). For E–H, scatter plots (median±interquartile range), with Mann–Whitney test to determine statistical significance (***P<0.001; ns, not significant).
Fig. 8.
Fig. 8.
Single-cell pHi is dynamic during cell cycle progression and regulates G1 exit, S phase duration and S/G2 transition. During cell cycle progression, pHi decreases at the G1/S boundary, increases in mid-S phase before dropping in late S, increases through G2 and decreases in the period leading up to division. When pHi is experimentally decreased, cells have a shortened G1 and fewer S/G2 transitions. When pHi is experimentally increased, G1 and S phases are elongated. This suggests that low pHi cues G1 exit and high pH is necessary for G2 entry.

Similar articles

Cited by

References

    1. Aerts, R. J., Durston, A. J. and Moolenaar, W. H. (1985). Cytoplasmic pH and the regulation of the Dictyostelium cell cycle. Cell 43, 653-657. 10.1016/0092-8674(85)90237-5 - DOI - PubMed
    1. Bjursell, G. and Reichard, P. (1973). Effects of thymidine on deoxyribonucleoside triphosphate pools and deoxyribonucleic acid synthesis in Chinese hamster ovary cells. J. Biol. Chem. 248, 3904-3909. 10.1016/S0021-9258(19)43819-2 - DOI - PubMed
    1. Boedtkjer, E. and Pedersen, S. F. (2020). The acidic tumor microenvironment as a driver of cancer. Annu. Rev. Physiol. 82, 103-126. 10.1146/annurev-physiol-021119-034627 - DOI - PubMed
    1. Bolderson, E., Scorah, J., Helleday, T., Smythe, C. and Meuth, M. (2004). ATM is required for the cellular response to thymidine induced replication fork stress. Hum. Mol. Genet. 13, 2937-2945. 10.1093/hmg/ddh316 - DOI - PubMed
    1. Boron, W. F. (2004). Regulation of intracellular pH. Am. J. Physiol. Adv. Physiol. Educ. 28, 160-179. 10.1152/advan.00045.2004 - DOI - PubMed

Publication types