. 2023 Jul 26;43(7):BSR20222523.
doi: 10.1042/BSR20222523.

Prognostic value of the S100 calcium-binding protein family members in hepatocellular carcinoma

Affiliations

Prognostic value of the S100 calcium-binding protein family members in hepatocellular carcinoma

Ran Wei et al. Biosci Rep. .

Abstract

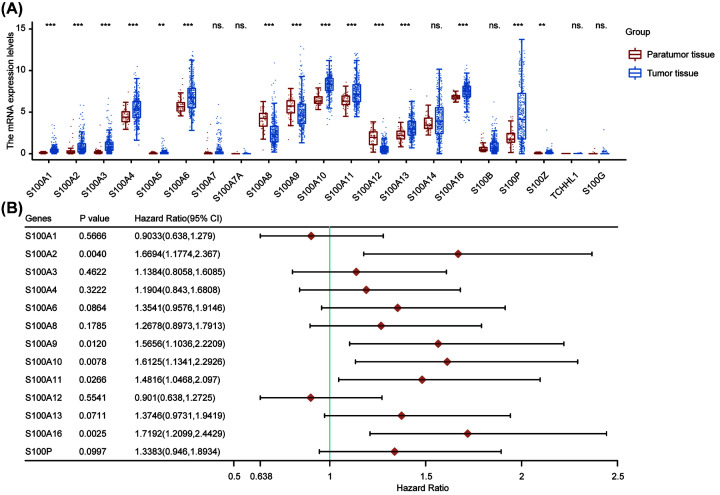
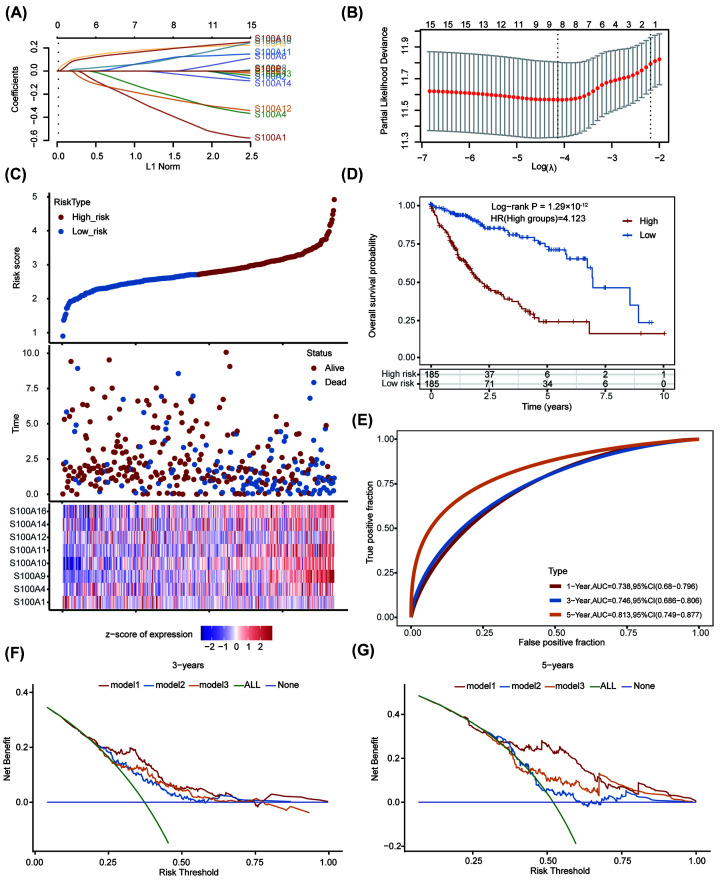
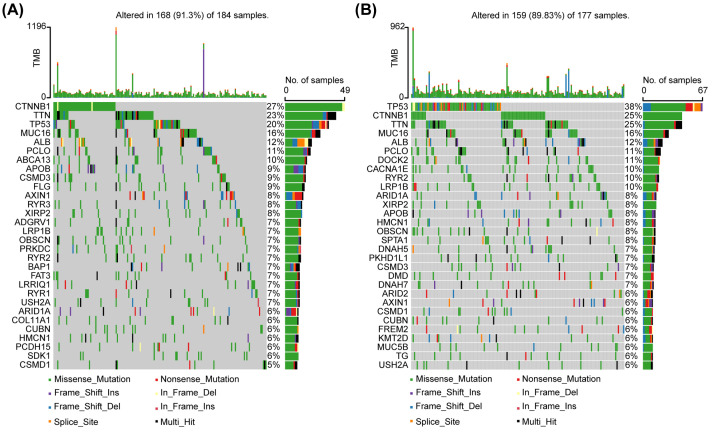
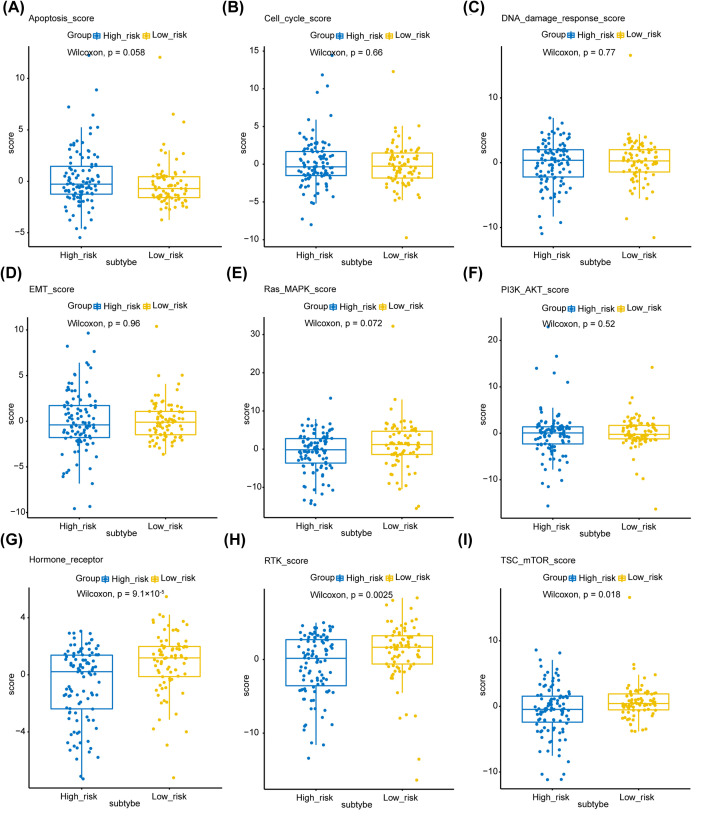
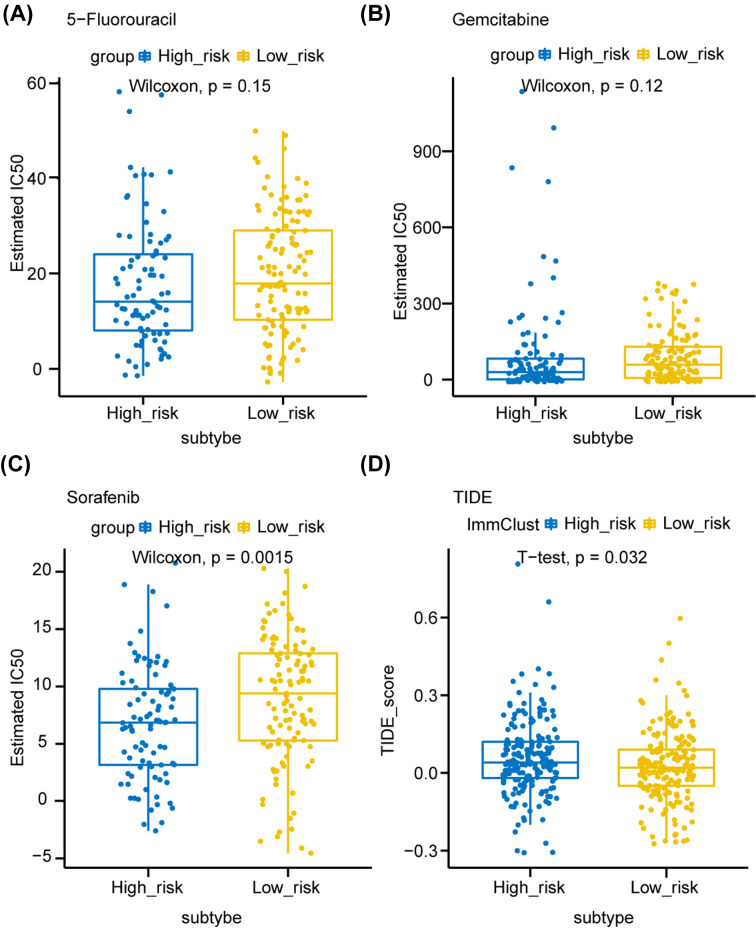
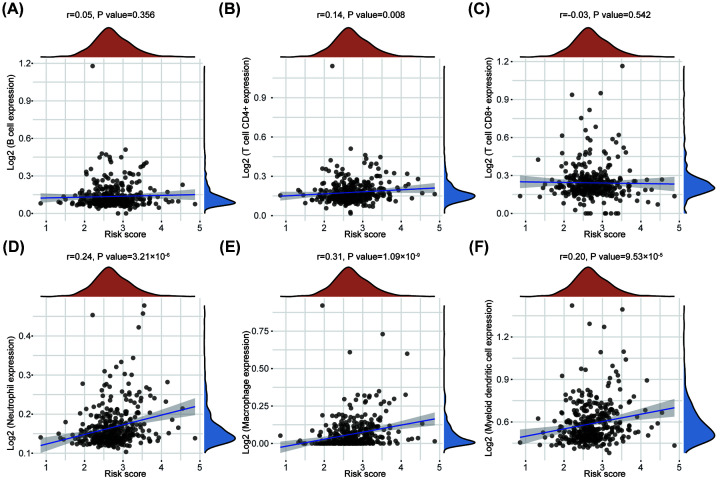
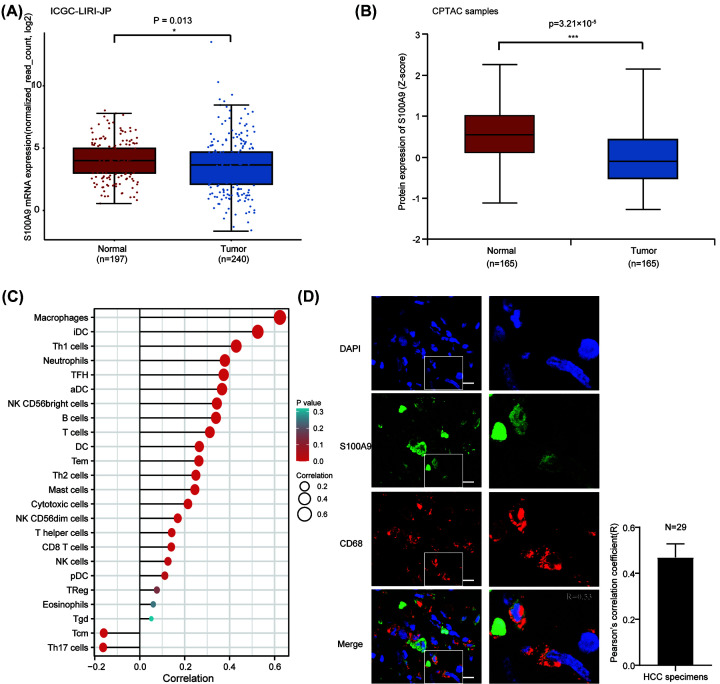
Hepatocellular carcinoma (HCC) remains a crucial public health problem around the world, and the outlook remains bleak. More accurate prediction models are urgently needed because of the great heterogeneity of HCC. The S100 protein family contains over 20 differentially expressed members, which are commonly dysregulated in cancers. In the present study, we analyzed the expression profile of S100 family members in patients with HCC based on the TCGA database. A novel prognostic risk score model, based on S100 family members, was developed using the least absolute shrinkage and selection operator regression algorithm, to analyze the clinical outcome. Our prediction model showed a powerful predictive value (1-year AUC: 0.738; 3-year AUC: 0.746; 5-year AUC: 0.813), while two former prediction models had less excellent performances than ours. And the S100 family members-based subtypes reveal the heterogeneity in many aspects, including gene mutations, phenotypic traits, tumor immune infiltration, and predictive therapeutic efficacy. We further investigated the role of S100A9, one member with the highest coefficient in the risk score model, which was mainly expressed in para-tumoral tissues. Using the Single-Sample Gene Set Enrichment Analysis algorithm and immunofluorescence staining of tumor tissue sections, we found that S100A9 may be associated with macrophages. These findings provide a new potential risk score model for HCC and support further study of S100 family members in patients, especially S100A9.

Keywords: S100 protein family; TCGA; hepatocellular carcinoma; risk score model.


Conflict of interest statement

The authors declare that there are no competing interests associated with the manuscript.

Figures

Figure 1
Figure 1. The prognostic value of S100 family members in HCC patients
(A) The mRNA expression of individual members of S100 family in HCC. (B) Forest plot showed individual S100 family member associated with HCC prognosis. **P<0.01, ***P<0.001, ns., no significance. Abbreviations: CI, confidence interval; HCC, hepatocellular carcinoma.
Figure 2
Figure 2. Construction of prognostic model based on S100 family genes
(A) LASSO coefficient profiles and (B) partial likelihood deviance for the LASSO regression. (C) The relationship among the risk score, survival time and survival status of HCC patients in TCGA dataset. The upper panel showed the scatter diagram of the risk score (from low to high), and different colors represented different risk groups (blue points indicated low-risk group and red points indicated high-risk group); the middle panel showed the distribution of patient survival status and survival time, depicted as a vertical scatter plot; the bottom panel represented the expression heat map of the genes included in the prognostic model. (D) Kaplan–Meier curve of prognostic model. (E) 1-year, 3-year and 5-year ROC curves of the prognostic model. (F and G) The decision curve analysis of prognostic model with previous published prognostic models for 3-year (F) and 5-year OS. Abbreviations: HCC, hepatocellular carcinoma; LASSO, least absolute shrinkage and selection operator; OS, overall survival; ROC, receiver operating characteristic; TCGA, The Cancer Genome Atlas.
Figure 3
Figure 3. Mutational landscape of low- and high-risk groups of HCC patients in TCGA dataset
(A and B) Top 30 mutational genes in individual group were shown. CTNNB1 (low-risk group) and TP53 (high-risk group) are reported as the most frequently mutated genes in separated cluster. Abbreviations: CTNNB1, cadherin-associated protein β1; No., number; TMB, tumor mutation burden; TP 53, tumor protein P53.
Figure 4
Figure 4. Phenotype heterogeneity among the S100 family members-based subtypes
Boxplots show differences in (A) apoptosis, (B) cell cycle, (C) DNA damage response, (D) EMT, (E) Ras/MAPK, (F) PI3K/AKT, (G) Hormone receptor, (H) RTK, and (I) TSC-mTOR scores from TCGA among S100 family members-based subtypes. The data from A–I were from RPPA data-based scores published by TCGA. The Kruskal–Wallis test was performed to calculate the P-value, and those associations with P-value < 0.05 were considered significant. Abbreviations: DNA, deoxyribonucleic acid; EMT, epithelial–mesenchymal transition; MAPK, mitogen-activated protein kinase; mTOR, mammalian target of rapamycin; RPPA, reverse-phase protein microarray; RTK, receptor tyrosine kinase; TCGA, TCGA, The Cancer Genome Atlas; TSC, tuberous sclerosis complex.
Figure 5
Figure 5. Predictive therapeutic response based on the risk score model
(A–C) The box plots showed the estimated half maximal inhibitory concentration (IC50) for 5-fluorouracil (A), gemcitabine (B) and sorafenib among S100 family members-based subtypes. (D) The box plot of TIDE scores of high- and low-risk groups, indicating the predictive therapeutic response to immune checkpoint blockage therapy. Comparisons between continuous variables were performed using the Wilcoxon rank-sum test or two-sample t-test depending on normality. Abbreviation: TIDE, tumor immune dysfunction and exclusion.
Figure 6
Figure 6. Correlation between risk score and tumor-infiltrating immune cells
(A–F) The correlations between risk score and immune score of different kinds of immune cells was analyzed with Spearman correlation. The horizontal axis represents the distribution of the risk score, and the longitudinal axis represents the distribution of the immune score of different immune cells. The right density curve showed the distribution of the immune scores among patients. The upper density curve represented the trend in distribution of the risk score.
Figure 7
Figure 7. S100A9 is highly expressed in macrophages
(A and B) S100A9 is predominantly expressed in normal tissues both in mRNA and protein levels. (C) The ssGSEA method quantifies the association of S100A9 expression with the abundance of 24 immune cells in the tumor immune microenvironment. (D) Co-immunofluorescent staining for S100A9 (in green) and the macrophage marker CD68 (in red) showed extensively co-localization in human HCC specimen. Pearson's correlation coefficient was calculated using JACoP tool in ImageJ. Scale bar represents 10 μm. Abbreviations: aDC, activated dendritic cell; CPTAC, Clinical Proteomic Tumor Analysis Consortium; ICGC, International Cancer Genome Consortium; iDC, immature dendritic cell; NK, natural killer cell; pDC, plasmacytoid dendritic cell; Tcm, central memory T cell; Tem, effector memory T cell; Tfh, follicular helper T cell; Tgd, gamma delta T cell; Th1, type I T helper cell; Treg, regulatory T cell.

References

    1. Sung H., Ferlay J., Siegel R., Laversanne M., Soerjomataram I., Jemal A.et al. . (2021) Global Cancer Statistics 2020: GLOBOCAN Estimates of Incidence and Mortality Worldwide for 36 Cancers in 185 Countries. CA Cancer J. Clin. 71, 209–249 10.3322/caac.21660 - DOI - PubMed
    1. Yang J., Hainaut P., Gores G., Amadou A., Plymoth A. and Roberts L. (2019) A global view of hepatocellular carcinoma: trends, risk, prevention and management. Nat. Rev. Gastroenterol. Hepatol. 16, 589–604 10.1038/s41575-019-0186-y - DOI - PMC - PubMed
    1. Granito A., Forgione A., Marinelli S., Renzulli M., Ielasi L., Sansone V.et al. . (2021) Experience with regorafenib in the treatment of hepatocellular carcinoma. Therapeutic Adv. Gastroenterol. 14, 17562848211016959 10.1177/17562848211016959 - DOI - PMC - PubMed
    1. Tovoli F., Dadduzio V., De Lorenzo S., Rimassa L., Masi G., Iavarone M.et al. . (2021) Real-Life Clinical Data of Cabozantinib for Unresectable Hepatocellular Carcinoma. Liver Cancer 10, 370–379 10.1159/000515551 - DOI - PMC - PubMed
    1. Granito A., Marinelli S., Terzi E., Piscaglia F., Renzulli M., Venerandi L.et al. . (2015) Metronomic capecitabine as second-line treatment in hepatocellular carcinoma after sorafenib failure. Digestive Liver Dis.: Off. J. Italian Soc. Gastroenterol. Italian Assoc. Study Liver 47, 518–522 10.1016/j.dld.2015.03.010 - DOI - PubMed

Publication types