. 2023 Jul 20;32(15):2441-2454.
doi: 10.1093/hmg/ddad069.

Multi-omics identifies large mitoribosomal subunit instability caused by pathogenic MRPL39 variants as a cause of pediatric onset mitochondrial disease

Affiliations

Multi-omics identifies large mitoribosomal subunit instability caused by pathogenic MRPL39 variants as a cause of pediatric onset mitochondrial disease

Sumudu S C Amarasekera et al. Hum Mol Genet. .

Abstract

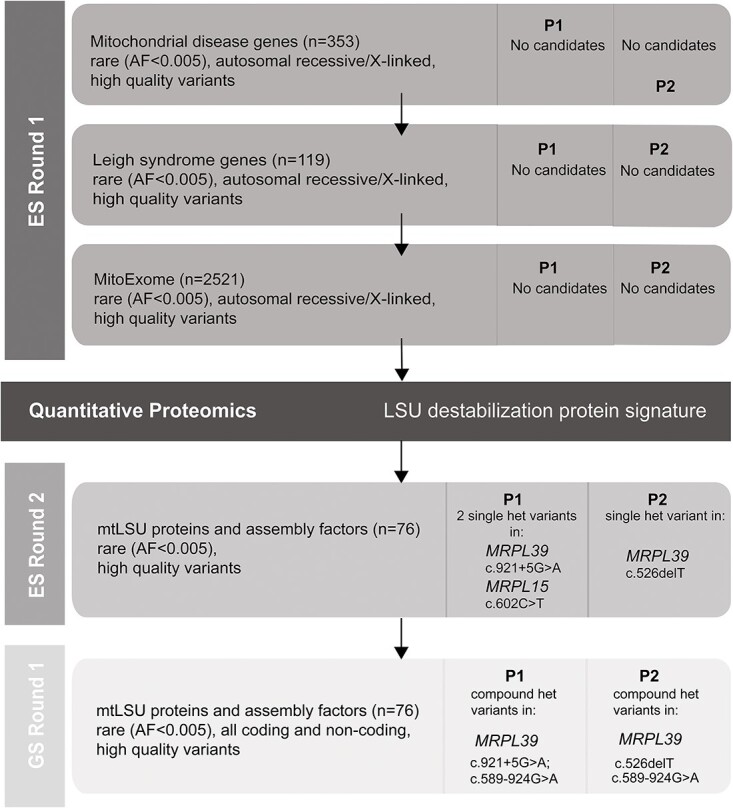
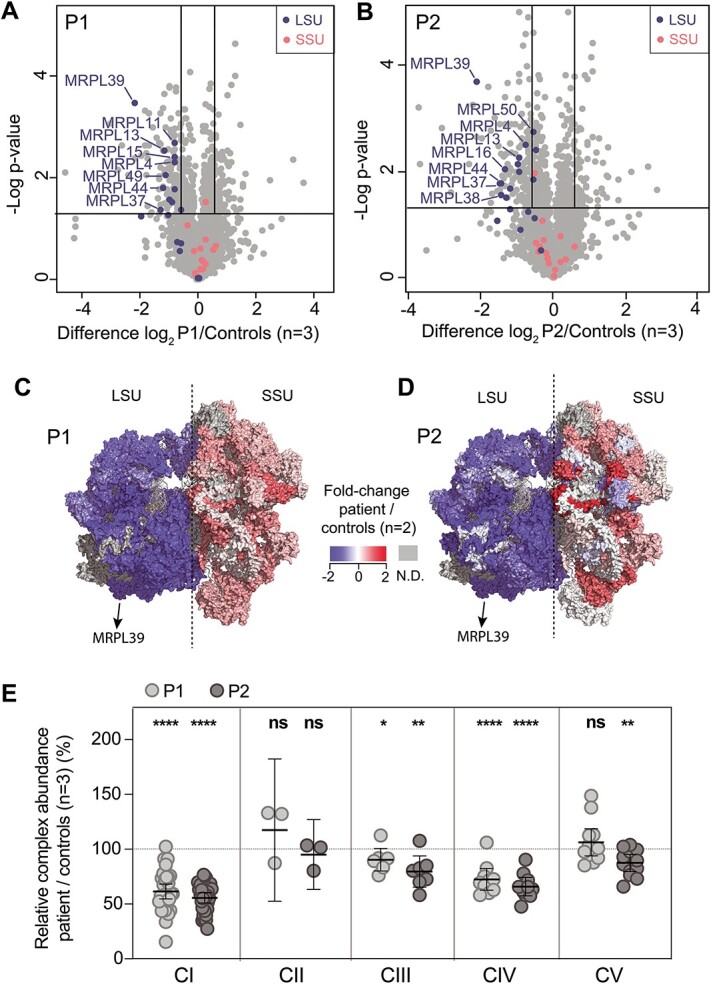
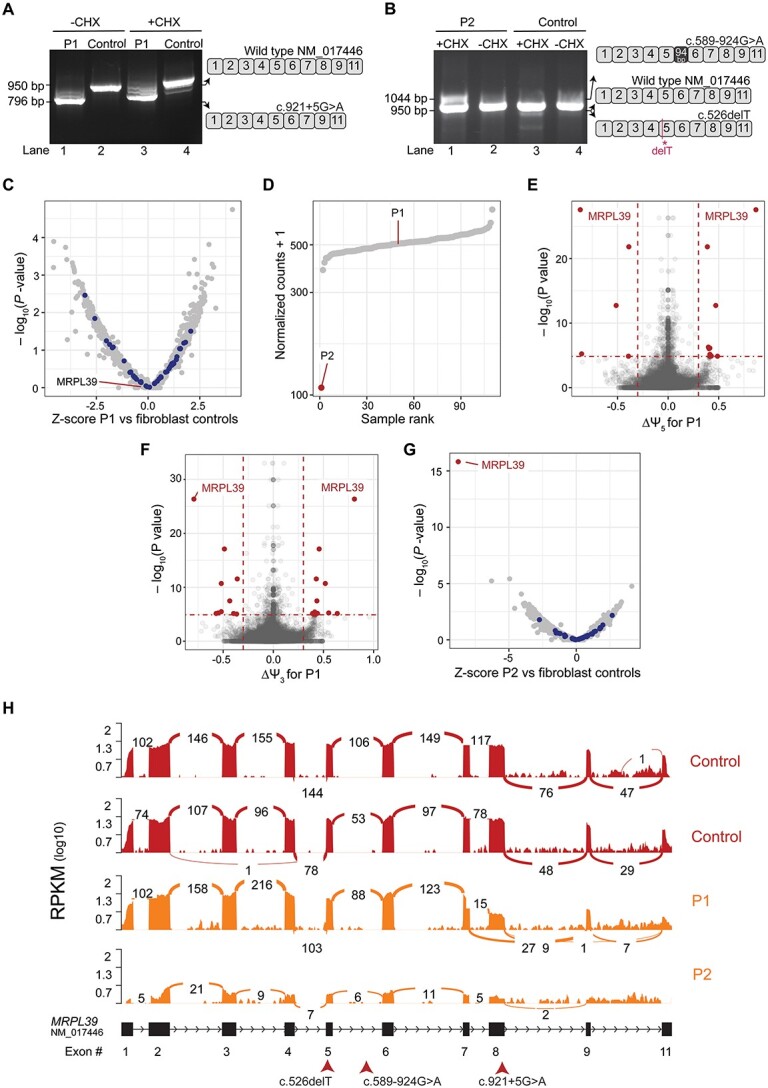
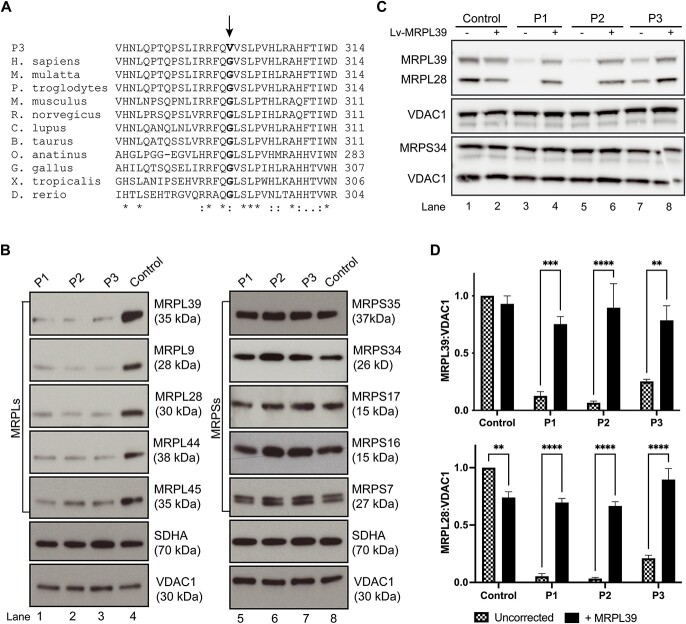
MRPL39 encodes one of 52 proteins comprising the large subunit of the mitochondrial ribosome (mitoribosome). In conjunction with 30 proteins in the small subunit, the mitoribosome synthesizes the 13 subunits of the mitochondrial oxidative phosphorylation (OXPHOS) system encoded by mitochondrial Deoxyribonucleic acid (DNA). We used multi-omics and gene matching to identify three unrelated individuals with biallelic variants in MRPL39 presenting with multisystem diseases with severity ranging from lethal, infantile-onset (Leigh syndrome spectrum) to milder with survival into adulthood. Clinical exome sequencing of known disease genes failed to diagnose these patients; however quantitative proteomics identified a specific decrease in the abundance of large but not small mitoribosomal subunits in fibroblasts from the two patients with severe phenotype. Re-analysis of exome sequencing led to the identification of candidate single heterozygous variants in mitoribosomal genes MRPL39 (both patients) and MRPL15. Genome sequencing identified a shared deep intronic MRPL39 variant predicted to generate a cryptic exon, with transcriptomics and targeted studies providing further functional evidence for causation. The patient with the milder disease was homozygous for a missense variant identified through trio exome sequencing. Our study highlights the utility of quantitative proteomics in detecting protein signatures and in characterizing gene-disease associations in exome-unsolved patients. We describe Relative Complex Abundance analysis of proteomics data, a sensitive method that can identify defects in OXPHOS disorders to a similar or greater sensitivity to the traditional enzymology. Relative Complex Abundance has potential utility for functional validation or prioritization in many hundreds of inherited rare diseases where protein complex assembly is disrupted.


Figures

Figure 1
Figure 1
Flowchart illustrating the filtering strategy and chronological steps used to analyze exome and genome sequencing data for P1 and P2. Each horizontal bar represents a step in the analysis process based on the gene list used and contains information on the filter parameters used and the details of any candidate genes (gene, inheritance, variant) identified for P1 and P2. The vertical columns indicate whether exome (ES) or genome (GS) sequence was utilized. The black horizontal bar represents the stage at which quantitative proteomics was used to identify candidate disease genes. MitoExome refers to genes encoding all known and candidate proteins targeted to the mitochondria primarily based on the MitoCarta3.0 inventory (72). AF: allele frequency.
Figure 2
Figure 2
Quantitative proteomics identifies the decreased abundance of the large subunit of the mitoribosome and OXPHOS complexes in P1 and P2 fibroblasts. Volcano plot of label-free quantitative proteomics data from whole-cell fibroblasts from (A) P1, and (B) P2, depicting a specific decrease in the relative abundance of proteins of the large ribosomal subunit (LSU) in both cell lines compared to controls. mtLSU = large ribosomal subunit, mtSSU = small ribosomal subunit. The horizontal lines in A and B represent p = 0.05 and the vertical lines represent an equivalent fold-change of ±1.5. Topographical heat mapping of label-free quantitative proteomics data from isolated mitochondria in (C) P1, and (D) P2, relative to controls (n = 2) utilizing the cryo-electron microscopy structure of the mitoribosome (6) PDB: 3J9M), N.D. = not detected. (E) RCA analysis of OXPHOS complexes from whole-cell quantitative proteomics for P1 and P2 relative to controls (n = 3). The middle bar represents the mean value for the complex, whereas the upper and lower bars represent the 95% confidence interval of the mean value. Each dot represents a single protein. * = p < 0.05, ** = p < 0.01, **** = p < 0.0001 and ns = not significant represent P-value significances from paired t-test. CI = Complex I, CII = Complex II, CIII = Complex III, CIV = Complex IV, CV = Complex V.
Figure 3
Figure 3
RNA-seq and cDNA studies show the deleterious effects of MRPL39 variants at a transcriptomic level. (A) cDNA analysis of P1 using RNA extracted from cycloheximide (CHX)-treated and -untreated fibroblasts. Gel electrophoresis of full-length PCR products amplified using cMRPL39_F (exon 1) and cMRPL39_R (exon 11) primers show aberrant and wildtype transcripts present. The wildtype and aberrantly spliced transcripts identified are depicted in the schematic diagram on the right. (B) cDNA analysis of P2 using RNA extracted from CHX-treated and -untreated fibroblasts as per A showing the aberrant and wildtype transcripts identified. The schematic diagram on the right depicts the aberrantly spliced transcripts identified in P2. (C) RNA expression volcano (significance -log10P value versus Z-score), a DROP analysis output, for P1 RNA-seq experiments performed on patient fibroblasts compared to GTEx fibroblast controls (n = 90) and patient fibroblast samples (n = 20). Each dot represents a transcript expressed in P1 compared to controls, showing normal expression for all the genes analyzed. MRPL gene transcripts are highlighted in blue, showing that they are expressed at normal levels. (D) RNA expression rank plot, generated from the DROP analysis pipeline, for P1 and P2 RNA-seq experiments performed on patient fibroblasts with normalized read counts for MRPL39 transcript plotted against all samples tested (90 GTEx controls + 21 patient fibroblast samples including both P1 and P2 samples) showing extremely low expression in P2 compared to all the other samples in the experiment and a normal expression level in P1. (E) Alternative accepter site usage (significance -log10P value versus effect ∆ψ5), a DROP analysis output, from P1 RNA-seq experiments revealed significant changes in acceptor site usage for MRPL39 depicted in red dots. Horizontal red dotted lines indicate the gene-level significance cutoff, and the vertical dotted lines represent the effect size cutoff. (F) Alternative donor site usage DROP analysis output (significance -log10P value versus effect ∆ψ3) for P1 showed a significant change in donor site usage for MRPL39 (red dots). (G) RNA expression volcano, significance -log10P value versus Z-score, for P2 with each dot representing a transcript expressed in P2 fibroblasts showing MRPL39 as a significant expression outlier compared to controls. All other MRPL genes, highlighted in blue, revealed normal expression levels. (H) MRPL39 sashimi plot of P1, P2 (orange) and two unaffected controls (red) illustrating the exon 8 skipping event in P1 and low expression in P2. RNA-seq read coverage is given as log10 RPKM (Reads Per Kilobase of transcript per Million mapped reads). Splicing is depicted by lines connecting exons with the number of split reads spanning a junction indicated on the line. A schematic of the MRPL39 transcript (NM_017446.4) expressed in fibroblasts along with the corresponding exon numbers are illustrated below the sashimi plot as well as the position of the patient variants indicated with arrows.
Figure 4
Figure 4
The p.(Gly299Val) variant identified in individual P3 changes a highly conserved amino acid residue and results in selective destabilization of the mitochondrial large ribosomal subunit, in agreement with results seen in individuals P1 and P2. (A) Protein sequence alignment of MRPL39 with 11 of its homologs including Homo sapiens and 10 other vertebrate species. Asterisks (*) depict conserved amino acids and colons (:) depict semi-conserved residues. The p.Gly299 residue is changed to a valine in individual P3 and is indicated in bold and is 100% conserved in vertebrate species from humans to Danio rerio. (B) Representative immunoblots of large (MRPL) and small (MRPS) mitoribosomal proteins extracted from fibroblasts revealed a substantial decrease in MRPL levels in all three affected individuals including in MRPL39, whereas the MRPS levels remained comparable to controls. SDHA and VDAC1 represent loading controls for mitochondrial content. (C) Fibroblasts from a control individual and P1, P2 and P3 were transduced with wild-type MRPL39 cDNA. Representative SDS-PAGE immunoblot demonstrates an increase in protein levels of large mitoribosomal protein subunits, MRPL39 and MRPL28, in transduced patient fibroblasts relative to untransduced cells, whereas the small mitoribosomal protein subunit MRPS34 was unchanged. VDAC1 was used as a loading control. (D) Densitometry analysis revealed that the increase after transduction was significant in each patient. Results were normalized to VDAC1 and presented as the percent of average untransduced control cells. The data shown are the mean of three independent transfections ± SEM. **p < 0.002, ***p< 0.0002, ****p < 0.0001.

References

    1. Frazier, A.E., Thorburn, D.R. and Compton, A.G. (2019) Mitochondrial energy generation disorders: genes, mechanisms, and clues to pathology. J. Biol. Chem., 294, 5386–5395. - PMC - PubMed
    1. Tang, J.X., Thompson, K., Taylor, R.W. and Oláhová, M. (2020) Mitochondrial OXPHOS biogenesis: co-regulation of protein synthesis, import, and assembly pathways. Int. J. Mol. Sci., 21, 3820. - PMC - PubMed
    1. Itoh, Y., Andréll, J., Choi, A., Richter, U., Maiti, P., Best, R.B., Barrientos, A., Battersby, B.J. and Amunts, A. (2021) Mechanism of membrane-tethered mitochondrial protein synthesis. Science, 371, 846–849. - PMC - PubMed
    1. Brown, A., Amunts, A., Bai, X.-C., Sugimoto, Y., Edwards, P.C., Murshudov, G., Scheres, S.H.W. and Ramakrishnan, V. (2014) Structure of the large ribosomal subunit from human mitochondria. Science, 346, 718–722. - PMC - PubMed
    1. Greber, B.J., Boehringer, D., Leitner, A., Bieri, P., Voigts-Hoffmann, F., Erzberger, J.P., Leibundgut, M., Aebersold, R. and Ban, N. (2014) Architecture of the large subunit of the mammalian mitochondrial ribosome. Nature, 505, 515–519. - PubMed

Publication types