. 2023 Jul;20(4):1154-1166.
doi: 10.1007/s13311-023-01382-4. Epub 2023 May 3.

Inhibition of ACSL4 Alleviates Parkinsonism Phenotypes by Reduction of Lipid Reactive Oxygen Species

Affiliations

Inhibition of ACSL4 Alleviates Parkinsonism Phenotypes by Reduction of Lipid Reactive Oxygen Species

Fei Tang et al. Neurotherapeutics. 2023 Jul.

Abstract

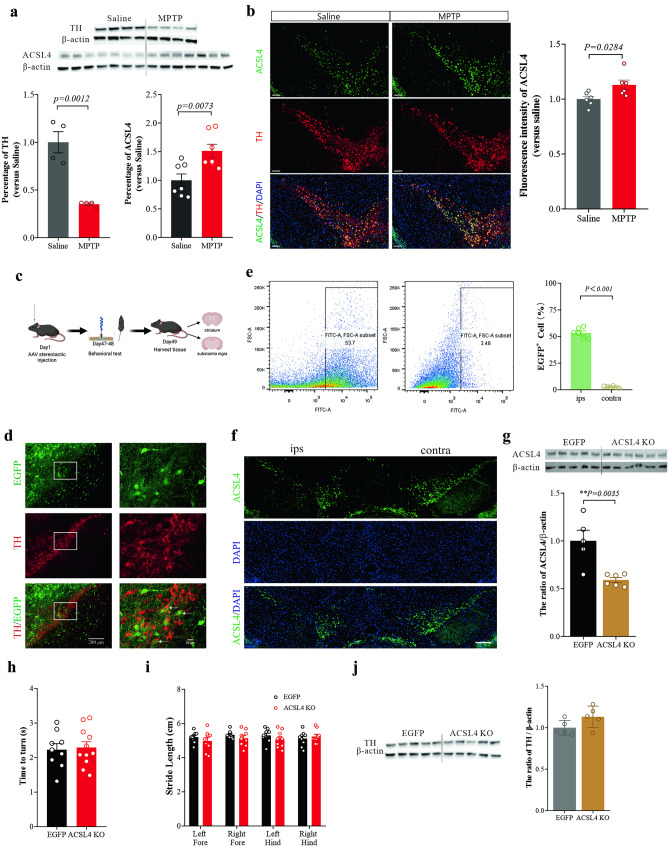
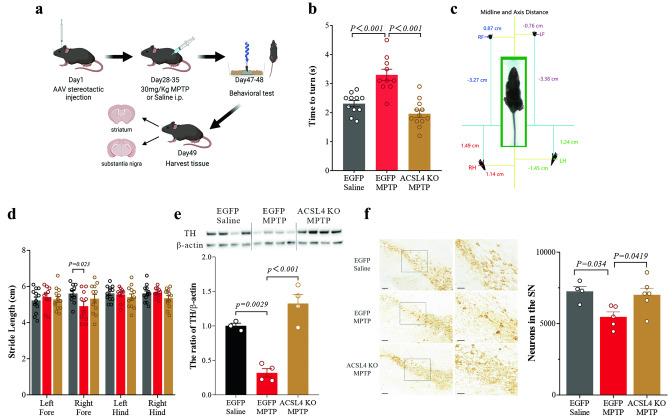
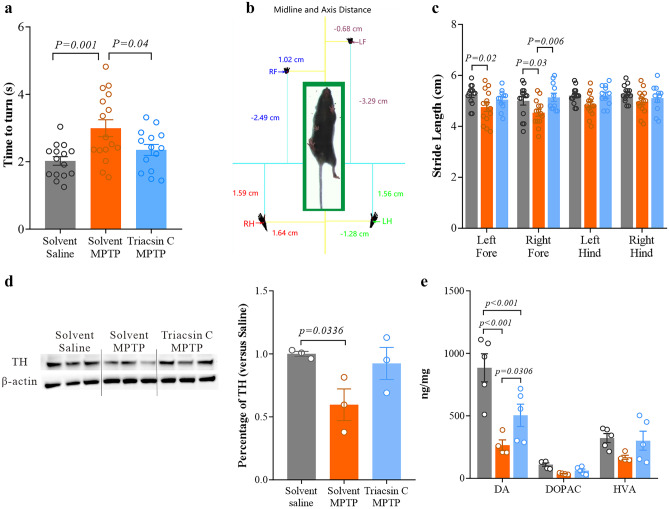
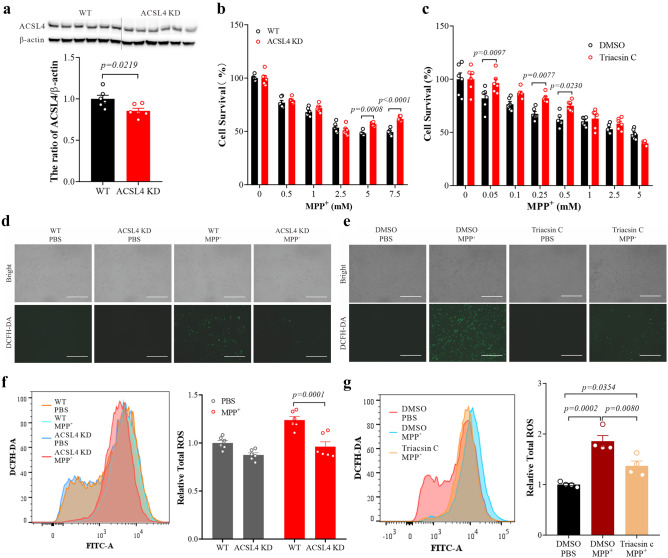
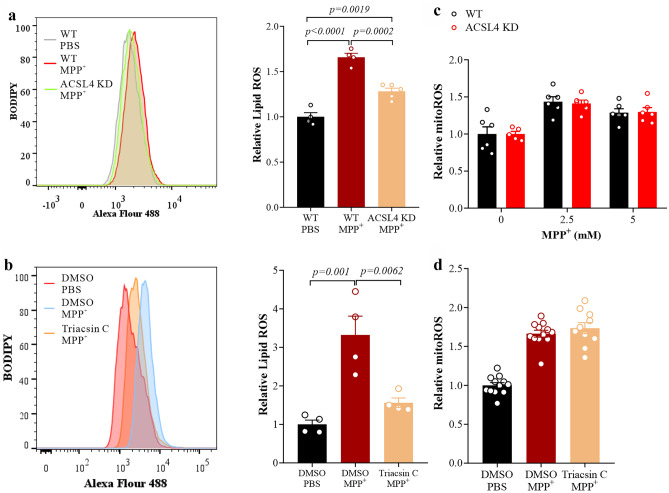
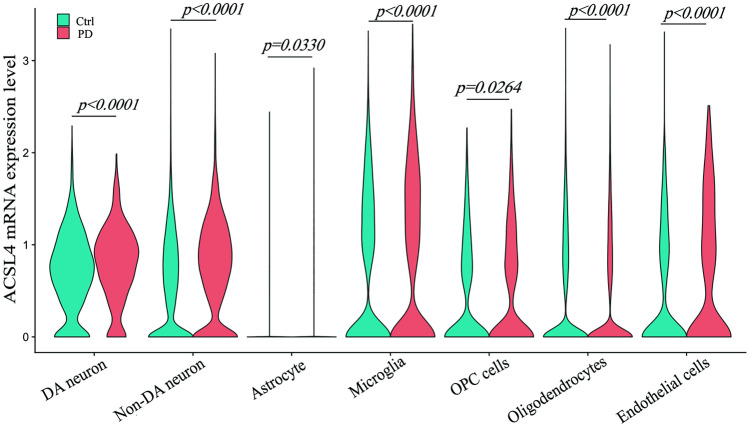
Ferroptosis is a programmed cell death pathway that is recently linked to Parkinson's disease (PD), where the key genes and molecules involved are still yet to be defined. Acyl-CoA synthetase long-chain family member 4 (ACSL4) esterifies polyunsaturated fatty acids (PUFAs) which is essential to trigger ferroptosis, and is suggested as a key gene in the pathogenesis of several neurological diseases including ischemic stroke and multiple sclerosis. Here, we report that ACSL4 expression in the substantia nigra (SN) was increased in a 1-methyl-4-phenyl-1,2,3,6-tetrahydropyridine (MPTP)-treated model of PD and in dopaminergic neurons in PD patients. Knockdown of ACSL4 in the SN protected against dopaminergic neuronal death and motor deficits in the MPTP mice, while inhibition of ACSL4 activity with Triacsin C similarly ameliorated the parkinsonism phenotypes. Similar effects of ACSL4 reduction were observed in cells treated with 1-methyl-4-phenylpyridinium (MPP+) and it specifically prevented the lipid ROS elevation without affecting the mitochondrial ROS changes. These data support ACSL4 as a therapeutic target associated with lipid peroxidation in PD.

Keywords: ACSL4; Ferroptosis; Lipid peroxidation; Neuroprotection; Parkinson’s disease.


Conflict of interest statement

The authors declare no competing interests.

Figures

Fig. 1
Fig. 1
Elevated ACSL4 expression levels in the SN in PD and the effects of SN ACSL4 KO in the brain. a TH and ACSL4 expressions in the SNs of MPTP-injected mice were determined by western blot analysis. b Representative images and the quantifications of ACSL4 and TH immunofluorescence staining in saline- or MPTP-treated mice. Scale bar = 200 μm. c Experimental scheme of AAV injection and the time point of phenotype detection. d Immunofluorescence staining has shown EGFP-positive cells and TH-positive neurons in the SN. The arrows indicate the co-labeled neurons. The scale bars represent 200 μm (left) and 20 μm (right). e Representative images (left, middle) and quantification (right) of EGFP-positive neurons in the ipsilateral and contralateral SN post-AAV-EGFP vector injection as detected with flow cytometry. f The expression of ACSL4 in the ipsilateral and contralateral SN post-AAV-ACSL4-KO vector injection. Scale bar = 200 μm. g ACSL4 was downregulated in the SN post-AAV-ACSL4-KO vector injection. h In the pole test, the time to turn was similar between the ACSL4-KO group and the EGFP group. i The gait parameters, stride length, were no different between the EGFP and ACSL4-KO groups. j The expression of TH was unaltered between the ACSL4-KO group and the EGFP group. The data are the means ± SEMs, and each point in the histogram represents a sample. t-Tests were performed. The p value is labeled in the histogram or is not displayed if it was higher than 0.05
Fig. 2
Fig. 2
Reducing ACSL4 expression ameliorates parkinsonism deficits. a Experimental scheme of AAV injection, model establishment, and phenotype detection. b Time to turn of pole test in the EGFP-saline, EGFP-MPTP, and ACSL4-KO-MPTP groups of mice. c Examples of footprints and the midline and axis distance were measured by the DigiGait™ analysis system and merged with a real picture of a mouse captured by the camera in the DigiGait apparatus. d The stride length was obtained from mice in the EGFP-saline, EGFP-MPTP, and ACSL4-KO-MPTP groups. The value on the Y-axis represents the raw data exported from the DigiGait™ analysis system. e The levels of TH expression in all three groups. The data are presented as the ratio of TH expression to β-actin expression and were normalized to the values in EGFP-saline mice. f Left, representative images of TH-positive neurons in the SN and magnified images of the ROI in each group. The scale bars represent 400 μm and 50 μm, respectively. Right, stereotactic counting of TH-positive dopaminergic neurons in the SN. Each point in the histogram represents a mouse. One-way ANOVA or two-way ANOVA followed by Tukey’s post hoc multiple comparison tests were performed. The p values are labeled in the histogram
Fig. 3
Fig. 3
Triacsin C pretreatment ameliorated parkinsonism deficits. a The time to turn of pole test in the solvent-saline, solvent-MPTP, and Triacsin C-MPTP groups of mice. b Examples of footprints and the midline and axis distance were measured by the DigiGait™ analysis system and merged with a real picture of a mouse captured by the camera in the DigiGait apparatus. c The stride length of DigiGait analysis for all three groups. The value on the Y-axis represents the raw data exported from the DigiGait™ analysis system. d The levels of TH expression in all three groups. The data were presented as the ratio of TH expression to β-actin expression and were normalized to the values in the solvent-saline mice. e Concentrations of DA, DOPAC, and HVA in the striatum were detected with LCMS/MS. Each point in the histogram represents a sample. One-way ANOVA or two-way ANOVA followed by Tukey’s post hoc multiple comparison tests were performed. The p values lower than 0.05 are labeled in the histogram; otherwise, the p values are not displayed
Fig. 4
Fig. 4
Knockdown or inhibition of ACSL4 ameliorated cell death and total ROS production induced by MPP+. a ACSL4 expressions in ACSL4-KD-N27 and WT-N27 cells. b Cell survival was discrepant between WT-N27 and ACSL4-KD-N27 cells when treated with increasing doses of MPP+. c Cellular survival was different between Triacsin C-pretreated and DMSO solvent-pretreated N27 cells under treatment with increasing doses of MPP+. de Representative brightfield white-light (top) and DCF fluorescence (bottom) schematics, showing DCFH-DA-labeled intracellular ROS in ACSL4-KD or Triacsin C-pretreated N27 cells after MPP+ treatment. Scale bar: 200 μm. fg Intracellular ROS production labeled with DCFH-DA in ACSL4-KD or Triacsin C-pretreated N27 cells was detected by flow cytometry after MPP+ incubation. Representative histogram plot for DCF fluorescence (left) and quantification results (right). Each point in the histogram represents a sample. One-way ANOVA or two-way ANOVA followed by Tukey’s post hoc multiple comparison tests or t-tests were performed. The p values lower than 0.05 are labeled in the histogram; otherwise, the p values are not displayed
Fig. 5
Fig. 5
Knockout or inhibition of ACSL4 ameliorated lipid ROS but not mitochondrial ROS production induced by MPP+. Lipid ROS levels in ACSL4 KD (a) or Triacsin C-pretreated (b) N27 cells after MPP+ treatment. Representative histogram plot for the fluorescence of oxidized BODIPY 581/591 C11 (left) and the results of quantification analysis expressed as the ratio of oxidized to reduced BODIPY 581/591 C11 mean fluorescence intensity (right). Quantification results of mitochondrial ROS detected with fluorescence microplate reader in ACSL4 KD (c) or Triacsin C-pretreated (d) N27 cells after MPP+ treatment. Each point in the histogram represents a sample. One-way ANOVA or two-way ANOVA followed by Tukey’s post hoc multiple comparison tests were performed. The p values lower than 0.05 are labeled in the histogram; otherwise, the p values are not displayed
Fig. 6
Fig. 6
ACSL4 is upregulated in human SNpc of PD. Violin plot of ACSL4 levels in different types of cells in the SNs of PD patients using data from GSE178265, which was reanalyzed with Seurat 4.0.5, package in R, version 4.1 (R Foundation)

Similar articles

Cited by

References

    1. GBD 2016 Neurology Collaborators Global, regional, and national burden of neurological disorders, 1990–2016: a systematic analysis for the Global Burden of Disease Study 2016. Lancet Neurol. 2019;18:459–480. doi: 10.1016/S1474-4422(18)30499-X. - DOI - PMC - PubMed
    1. Armstrong MJ, Okun MS. Diagnosis and treatment of Parkinson disease: a review. JAMA. 2020;323:548–560. doi: 10.1001/jama.2019.22360. - DOI - PubMed
    1. Mahoney-Sanchez L, Bouchaoui H, Ayton S, et al. Ferroptosis and its potential role in the physiopathology of Parkinson’s disease. Prog Neurobiol. 2021;196:101890. doi: 10.1016/j.pneurobio.2020.101890. - DOI - PubMed
    1. Venderova K, Park DS. Programmed cell death in Parkinson’s disease. Cold Spring Harb Perspect Med. 2012;2. - PMC - PubMed
    1. Yan HF, Zou T, Tuo QZ, et al. Ferroptosis: mechanisms and links with diseases. Signal Transduct Target Ther. 2021;6:49. doi: 10.1038/s41392-020-00428-9. - DOI - PMC - PubMed

Publication types