. 2023 May;49(5):545-553.
doi: 10.1007/s00134-023-07066-z. Epub 2023 May 3.

Intensivist physician-to-patient ratios and mortality in the intensive care unit

Affiliations

Intensivist physician-to-patient ratios and mortality in the intensive care unit

Jeremy M Kahn et al. Intensive Care Med. 2023 May.

Abstract

Purpose: A high daily census may hinder the ability of physicians to deliver quality care in the intensive care unit (ICU). We sought to determine the relationship between intensivist-to-patient ratios and mortality among ICU patients.

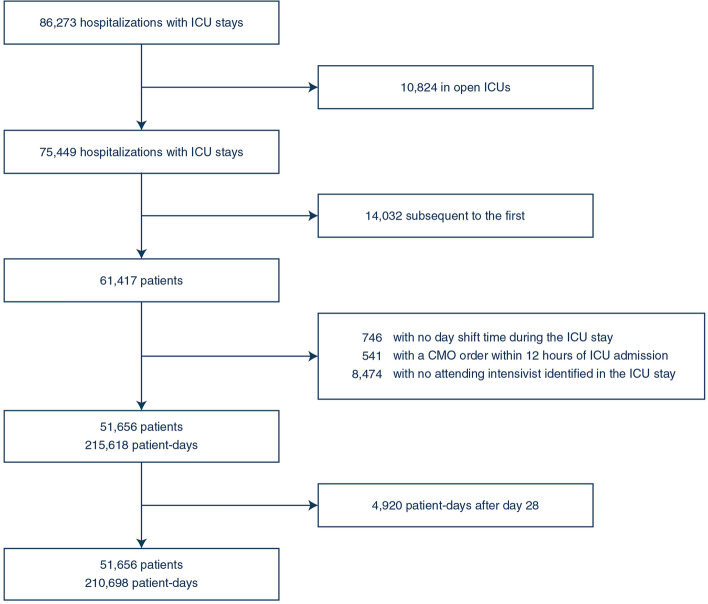
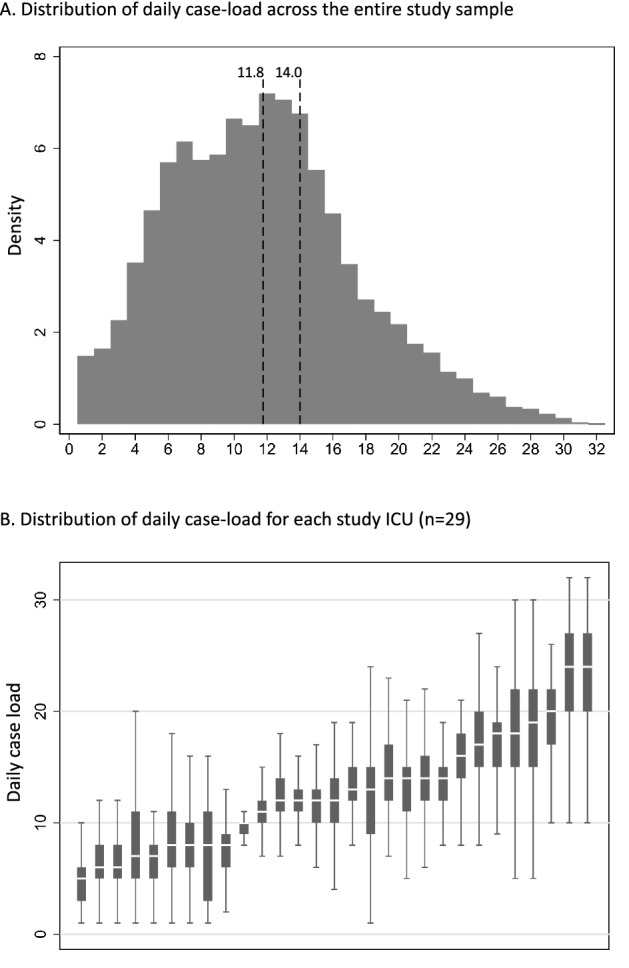
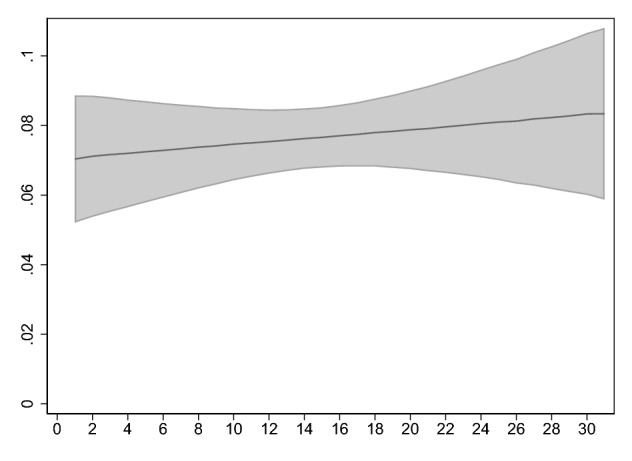
Methods: We performed a retrospective cohort study of intensivist-to-patient ratios in 29 ICUs in 10 hospitals in the United States from 2018 to 2020. We used meta-data from progress notes in the electronic health record to determine an intensivist-specific caseload for each ICU day. We then fit a multivariable proportional hazards model with time-varying covariates to estimate the relationship between the daily intensivist-to-patient ratio and ICU mortality at 28 days.

Results: The final analysis included 51,656 patients, 210,698 patient days, and 248 intensivist physicians. The average caseload per day was 11.8 (standard deviation: 5.7). There was no association between the intensivist-to-patient ratio and mortality (hazard ratio for each additional patient: 0.987, 95% confidence interval: 0.968-1.007, p = 0.2). This relationship persisted when we defined the ratio as caseload over the sample-wide average (hazard ratio: 0.907, 95% confidence interval: 0.763-1.077, p = 0.26) and cumulative days with a caseload over the sample-wide average (hazard ratio: 0.991, 95% confidence interval: 0.966-1.018, p = 0.52). The relationship was not modified by the presence of physicians-in-training, nurse practitioners, and physician assistants (p value for interaction term: 0.14).

Conclusions: Mortality for ICU patients appears resistant to high intensivist caseloads. These results may not generalize to ICUs organized differently than those in this sample, such as ICUs outside the United States.

Keywords: Critical care; Intensive care units; Physicians; Workforce; Workload.


Conflict of interest statement

The authors have no financial conflicts of interest to disclose.

Figures

Fig. 1
Fig. 1
Flow diagram. ICU intensive care unit, CMO comfort measures only
Fig. 2
Fig. 2
Distribution of intensivist-to-patient ratio across the entire sample (Panel A) and across individual intensive care units (Panel B). In Panel A, the histogram shows the distribution of daily intensivist-to-patient ratios across the entire sample. The dotted lines are provided at 11.8 and 14.0 representing the sample-wide average and currently recommended caseload cap, respectively. In Panel B, the box plots show medians, interquartile ranges, and total ranges at the level of the intensive care unit day, with outliers excluded for legibility. Intensive care units are ordered on the x-axis from lowest median ratio to highest median ratio
Fig. 3
Fig. 3
Relationship between average intensivist-to-patient ratio over the first two days of intensive care unit admission and in-hospital mortality. The figure shows point estimates and 95% confidence intervals for adjusted mortality derived from a logistic regression model in which the dependent variable was in-hospital mortality and the independent variable was the daily caseload averaged over the first two days, adjusting for age, gender, intensive care unit admission source, comorbidities, mechanical ventilation (maximum over the first two days), the presence of a physician-in-training, physician assistant, or nurse practitioner (maximum over the first two days), SOFA score (maximum over the first two days) and the count of new admissions (averaged over the first two days), using direct standardization (N = 44,235). Point estimates were calculated at the mean of all covariates

Similar articles

Cited by

References

    1. Kahn JM, Brake H, Steinberg KP. Intensivist physician staffing and the process of care in academic medical centres. Qual Saf Health Care. 2007;16:329–333. doi: 10.1136/qshc.2007.022376. - DOI - PMC - PubMed
    1. Wilcox ME, Chong CAKY, Niven DJ, et al. Do intensivist staffing patterns influence hospital mortality following ICU admission? A systematic review and meta-analyses. Crit Care Med. 2013;41:2253–2274. doi: 10.1097/CCM.0b013e318292313a. - DOI - PubMed
    1. Weled BJ, Adzhigirey LA, Hodgman TM, et al. Critical care delivery: the importance of process of care and ICU structure to improved outcomes. Crit Care Med. 2015;43:1520–1525. doi: 10.1097/CCM.0000000000000978. - DOI - PubMed
    1. Kohn R, Madden V, Kahn JM, et al. Diffusion of evidence-based intensive care unit organizational practices. A state-wide analysis. Ann Am Thorac Soc. 2017;14:254–261. doi: 10.1513/AnnalsATS.201607-579OC. - DOI - PMC - PubMed
    1. Erickson SE, Martin GS, Davis JL, et al. Recent trends in acute lung injury mortality: 1996–2005. Crit Care Med. 2009;37:1574. doi: 10.1097/CCM.0b013e31819fefdf. - DOI - PMC - PubMed

LinkOut - more resources