. 2023 Aug 7;220(8):e20221518.
doi: 10.1084/jem.20221518. Epub 2023 May 3.

SARS-CoV-2 infection and recovery in children: Distinct T cell responses in MIS-C compared to COVID-19

Affiliations

SARS-CoV-2 infection and recovery in children: Distinct T cell responses in MIS-C compared to COVID-19

Ksenia Rybkina et al. J Exp Med. .

Abstract

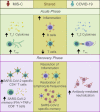
SARS-CoV-2 infection for most children results in mild or minimal symptoms, though in rare cases severe disease can develop, including a multisystem inflammatory syndrome (MIS-C) with myocarditis. Here, we present longitudinal profiling of immune responses during acute disease and following recovery in children who developed MIS-C, relative to children who experienced more typical symptoms of COVID-19. T cells in acute MIS-C exhibited transient signatures of activation, inflammation, and tissue residency which correlated with cardiac disease severity, while T cells in acute COVID-19 upregulated markers of follicular helper T cells for promoting antibody production. The resultant memory immune response in recovery showed increased frequencies of virus-specific memory T cells with pro-inflammatory functions in children with prior MIS-C compared to COVID-19 while both cohorts generated comparable antibody responses. Together our results reveal distinct effector and memory T cell responses in pediatric SARS-CoV-2 infection delineated by clinical syndrome, and a potential role for tissue-derived T cells in the immune pathology of systemic disease.


Conflict of interest statement

Disclosures: B.R. Anderson reported grants from Genentech and the National Institutes of Health outside the submitted work. J. Milner reported personal fees from Blueprint Medicines outside the submitted work. T.J. Connors reported grants from the National Institutes of Health during the conduct of the study and outside the submitted work. No other disclosures were reported.

Figures
None
Graphical abstract
Figure 1.
Figure 1.
Enrollment schematic for each subject over the course of the SARS-CoV-2 pandemic. Visual representation of each subject (MIS-C, n = 37; COVID-19, n = 52) recruited for this study superimposed on the wave during which they were infected. The number of weekly MIS-C cases is depicted in red (left y axis), and number of weekly COVID-19 cases depicted in blue (right y axis). Case data were sourced from the Center for Disease Control (https://covid.cdc.gov/covid-data-tracker/#mis-national-surveillance).
Figure 2.
Figure 2.
Distinct immune mediator profiles in acute MIS-C and COVID-19 are resolved in recovery. (A) Profiles of immune mediators present in plasma shown as a heatmap and stratified by cohort; acute MIS-C (n = 8), acute COVID (n = 15), MIS-C-R (n = 11), COVID-R (n = 4), seronegative (n = 7). Color intensity of each cell represents analyte concentration (maximum absolute scaled per row) within each cohort. Unsupervised clustering of cytokine expression was done using complete method (distance metric: Euclidean). (B) Analytes found to be elevated during acute MIS-C. (C) Analytes increased during acute COVID. (D) Analytes found to be elevated or reduced in both acute MIS-C and acute COVID. (B–D) Concentration of indicated immune mediators present in plasma. Statistical analyses were performed using Kruskal–Wallis test with Dunn’s correction. Line depicts median. *, P < 0.05; **, P < 0.01; ***, P < 0.00.
Figure 3.
Figure 3.
Similar alterations in immune cell frequencies during acute MIS-C and COVID are resolved during recovery. Lymphocyte subset frequencies were assessed from peripheral blood samples of acute MIS-C (n = 17), acute COVID (n = 8), MIS-C-R (n = 11), COVID-R (n = 5), and seronegative (n = 6). (A) Bar graph (left) depicting distributions of major lymphocyte populations with breakdown of lymphocyte subsets (right) organized by cohort. (B) Frequencies of CD3+ T cell subsets by cohort. (C) Frequencies of CD4+ (left) and CD8+ (right) T cell memory subsets based on expression of CD45RA and CCR7 delineating naive (CD45RA+CCR7+), central memory (TCM; CD45RACCR7+), terminal effector (TEMRA; CD45RA+CCR7), and effector-memory (TEM; CD45RACCR7) cells by cohort. Lines depict mean. Statistical analysis was performed using one-way ANOVA with Tukey’s correction. *, P < 0.05; **, P < 0.01; ***, P < 0.001; ****, P < 0.0001. NK/ILC, NK cell/innate lymphoid cell; DN, double-negative T cell.
Figure S1.
Figure S1.
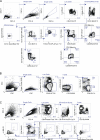
Gating strategy for flow cytometry and cell sorting. (A) Gating strategy for blood immunophenotyping. (B). Gating strategy used for cell sorting for RNAseq. (C) Gating strategy for identification of SARS-CoV-2–specific T cells. Numbers on flow cytometry plots represent % of cells within gate. FSC, forward scatter; SSC, side scatter.
Figure 4.
Figure 4.
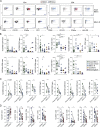
Distinct T cell phenotypes in acute disease groups suggest aberrant responses in MIS-C. (A) Representative flow cytometry plots of CD4+ (left) and CD8+ (right) T cells by expression of markers of activation (CD69, HLA-DR, PD-1) and tissue residency (CD49a, CD103) during acute MIS-C (top) and MISC-R (bottom). (B) Frequency of expression of selected markers on memory CD4+ (top) and CD8+ (bottom) T cells organized by cohort; acute MIS-C (n = 17), acute COVID (n = 8), MIS-C-R (n = 11), COVID-R (n = 5), and seronegative (n = 6) controls. TFH cells defined by co-expression of PD-1 and CXCR5. Lines represent median for each cohort. Statistical analyses were performed using ordinary one-way ANOVA with Tukey’s correction or Kruskal–Wallis testing with Dunn’s correction. (C) Paired analysis of marker expression on memory CD4+ (left) and CD8+ (right) T cells during acute MIS-C and following recovery. Statistical analyses were performed using paired t test. (D). Paired analysis of marker expression on CD49a+ and CD49a subsets in CD4+ (left) and CD8+ (right) T cells in acute MIS-C children. Statistical analyses were performed using paired t test. *, P < 0.05; **, P < 0.01; ***, P < 0.001; ****, P < 0.0001. Mem, memory.
Figure S2.
Figure S2.
Expression of activation and tissue residency markers on T cells during acute MIS-C are absent in recovery. (A) Paired analysis of marker expression on naive and memory CD4+ (top) and CD8+ (bottom) T cells during acute MIS-C (n = 17). (B). Paired analysis of marker expression on CD4+ (left) and CD8+ (right) T cells during acute MIS-C and following recovery (n = 8). Statistical analyses were performed using paired t test. *, P < 0.05; **, P < 0.01; ***, P < 0.001; ****, P < 0.0001.
Figure 5.
Figure 5.
Aberrant expression of TRM markers correlate with cardiac disease severity during acute MIS-C. (A) Paired serological and echocardiographic cardiac clinical data from MIS-C subjects at acute (n = 35–37) and recovery (2–6 mo; n = 32 and 6–19 mo; n = 17–18 after infection) timepoints. Dotted lines with gray shading represent normal ranges for each parameter. (B) Correlation analysis (n = 17) of T cell subsets (x axis) to cardiac testing (y axis); troponin T (top) or EF (bottom). Statistical testing was done with Pearson correlation.
Figure 6.
Figure 6.
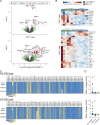
Distinct transcriptional signatures and TCR clonal expansions of MIS-C resolve following recovery. (A) Volcano plots of differentially expressed genes in CD4+ (top) and CD8+ (bottom) T cells between acute MIS-C (n = 7) and MIS-C-R 6–12 mo after infection (n = 7) subjects. Log fold change describes upregulation or downregulation of a given gene in acute MIS-C in comparison to MIS-C-R. (B) Heatmaps of normalized mean counts of significantly differentially expressed genes in CD4+ (top) and CD8+ (bottom) T cells between acute MIS-C (green) and MIS-C-R (blue) cohorts. Subjects in heatmaps were clustered by complete cluster function (see Materials and methods). Genes were significantly different if they had a log2FC ≥1 and an adjusted P value <0.05. (C) Heatmap depicting TCR Vβ-chain usage in CD4+ (top) and CD8+ (bottom) T cells isolated from peripheral blood of acute MIS-C children and following recovery compared to COVID-R. Color intensity represents frequency of chain usage as a percentage of the total repertoire. (D). Frequency of TRBV11-2 usage in CD4+ (top) and CD8+ (bottom) peripheral blood repertoires in acute MIS-C children, MISC-R, and COVID-R subjects. Lines depict median for each cohort. Statistical analyses were performed using Kruskal–Wallis test with Dunn’s correction. *, P < 0.05; **, P < 0.01.
Figure 7.
Figure 7.
Enhanced frequency and functionality of memory T cells in children who recovered from MIS-C versus COVID-19. (A) Representative flow cytometry data identifying SARS-CoV-2–specific CD4+ (left) and CD8+ (right) T cells using the AIM assay (see Materials and methods) based on the induction of OX40, 4-1BB, and CD40L. Data organized by cohort (row) and peptide pool (columns; CD4; MP_S, MP_CD4R or CD8; MP_S, MP_CD8A, MP_CD8B—see Materials and methods). (B) Frequency of epitope-specific CD4+ (top) and CD8+ (bottom) T cells grouped by clinical cohorts (MISC-R, n = 10; COVID-R, n = 17; seronegative, n = 4) in individual peptide pools and combined reactivity. Lines depict mean for each cohort. Statistical analyses were performed using one-way ANOVA with Tukey’s correction or Kruskal–Wallis test with Dunn’s correction. (C) Frequency of cytokine-positive CD4+ (top) and CD8+ (bottom) T cells following SARS-CoV-2 peptide stimulation from subjects shown in B. Line depicts median. Statistical analyses were performed using Kruskal–Wallis test with Dunn’s correction. *, P < 0.05; **, P < 0.01; ***, P < 0.001; ****, P < 0.0001. All samples were between 3–12 mo after infection.
Figure 8.
Figure 8.
Longitudinal profiling of antibody responses during acute disease and recovery. (A) SARS-CoV-2 antibody reactivities in acute MIS-C (n = 18–22), acute COVID-19 (n = 12–13), MIS-C recovered (MIS-C-R; n = 36), COVID recovered (COVID-R; n = 29–31), and seronegative controls (n = 16). Graphs depict IgG and IgA titers by area under curve (AUC) against SARS-CoV-2 Spike (S), RBD, and N proteins, stratified by clinical cohort. Lines depict median. Statistical analyses were performed using Kruskal–Wallis test with Dunn’s correction. (B) Log-transformed longitudinal analysis of SARS-CoV-2–specific antibodies in MISC-R (n = 36) and COVID-R (n = 24–25) cohorts. Line represents best fit with shading depicting 95% confidence bands. Statistical testing was performed with linear regression. (C) Compiled data from pseudotype neutralization assay (see Materials and methods) grouped by cohort (MISC-R, n = 20; and COVID-R, n = 15) and organized by variant vs. log-transformed AUC for neutralizing activity. Statistical testing within cohorts by one-way ANOVA with Tukey’s correction and across groups by variant using Mann–Whitney t test. *, P < 0.05; **, P < 0.01; ***, P < 0.001; ****, P < 0.0001.
Figure S3.
Figure S3.
SARS-CoV-2–specific antibodies in children with MIS-C do not vary by severity of MIS-C and are maintained in recovery. (A) SARS-CoV-2 antibody reactivity in children with MIS-C stratified by clinical severity during acute (top; mild, n = 4–6; moderate, n = 7–9; severe, n = 6–8) and following recovery (bottom; mild, n = 17; moderate, n = 11; severe, n = 8). Lines depict median. Statistical testing performed using Kruskal–Wallis test. (B) Longitudinal visualization of SARS-CoV-2–specific antibodies in children with MIS-C (n = 12). Color coordinated lines and dots depict individual MIS-C subjects. *, P < 0.05; **, P < 0.01; ***, P < 0.001; ****, P < 0.0001. Mod, moderate.

Similar articles

Cited by

References

    1. Amanat, F., Stadlbauer D., Strohmeier S., Nguyen T.H.O., Chromikova V., McMahon M., Jiang K., Arunkumar G.A., Jurczyszak D., Polanco J., et al. . 2020. A serological assay to detect SARS-CoV-2 seroconversion in humans. Nat. Med. 26:1033–1036. 10.1038/s41591-020-0913-5 - DOI - PMC - PubMed
    1. Bajaj, R., Sinclair H.C., Patel K., Low B., Pericao A., Manisty C., Guttmann O., Zemrak F., Miller O., Longhi P., et al. . 2021. Delayed-onset myocarditis following COVID-19. Lancet Respir. Med. 9:e32–e34. 10.1016/S2213-2600(21)00085-0 - DOI - PMC - PubMed
    1. Becker, Y. 2006. Respiratory syncytial virus (RSV) evades the human adaptive immune system by skewing the Th1/Th2 cytokine balance toward increased levels of Th2 cytokines and IgE, markers of allergy: A review. Virus Genes. 33:235–252. 10.1007/s11262-006-0064-x - DOI - PubMed
    1. Belhadjer, Z., Auriau J., Méot M., Oualha M., Renolleau S., Houyel L., and Bonnet D.. 2020. Addition of corticosteroids to immunoglobulins is associated with recovery of cardiac function in multi-inflammatory syndrome in children. Circulation. 142:2282–2284. 10.1161/CIRCULATIONAHA.120.050147 - DOI - PMC - PubMed
    1. Bolotin, D.A., Poslavsky S., Mitrophanov I., Shugay M., Mamedov I.Z., Putintseva E.V., and Chudakov D.M.. 2015. MiXCR: Software for comprehensive adaptive immunity profiling. Nat. Methods. 12:380–381. 10.1038/nmeth.3364 - DOI - PubMed

Publication types

Supplementary concepts