

Transcriptomic changes in porcine articular cartilage one year following disruption of the anterior cruciate ligament
- PMID: 37134114
- PMCID: PMC10156018
- DOI: 10.1371/journal.pone.0284777
Transcriptomic changes in porcine articular cartilage one year following disruption of the anterior cruciate ligament
Abstract
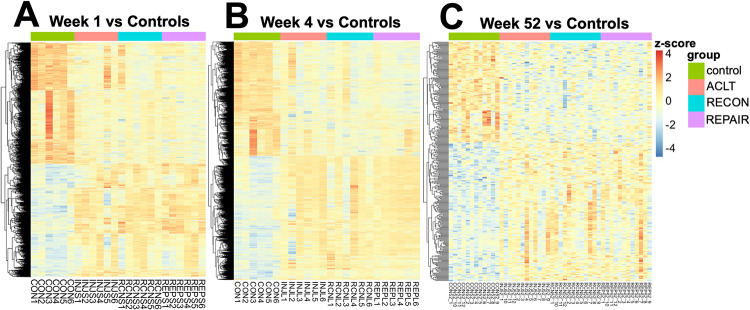
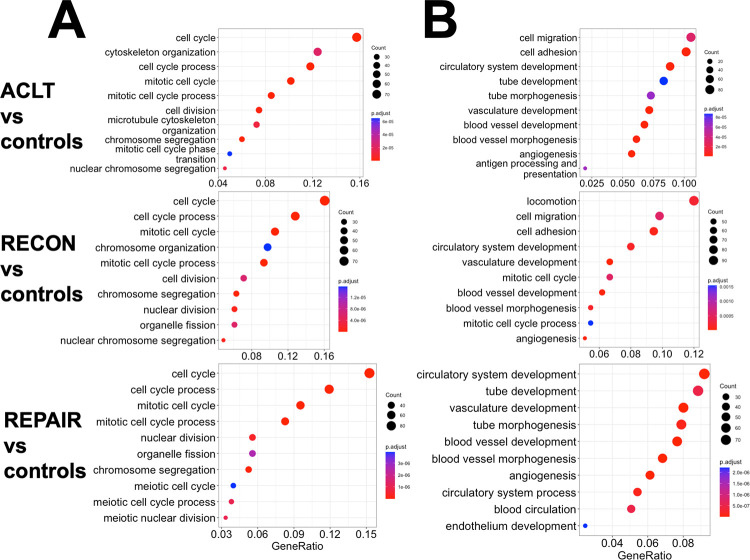
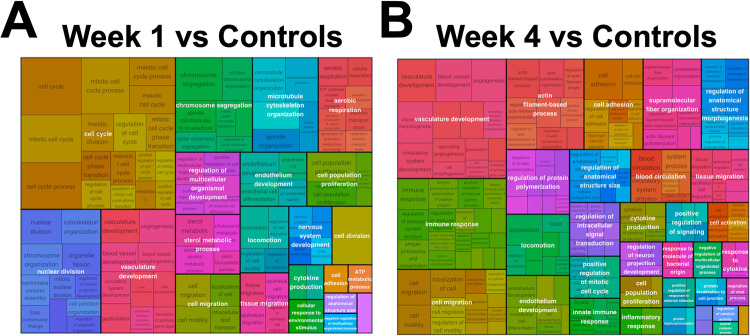
To determine the transcriptomic changes seen in early- to mid-stage posttraumatic osteoarthritis (PTOA) development, 72 Yucatan minipigs underwent transection of the anterior cruciate ligament. Subjects were randomized to no further intervention, ligament reconstruction, or ligament repair, followed by articular cartilage harvesting and RNA-sequencing at three different postoperative timepoints (1, 4, and 52 weeks). Six additional subjects received no ligament transection and provided cartilage tissue to serve as controls. Differential gene expression analysis between post-transection cartilage and healthy cartilage revealed an initial increase in transcriptomic differences at 1 and 4 weeks followed by a stark reduction in transcriptomic differences at 52 weeks. This analysis also showed how different treatments genetically modulate the course of PTOA following ligament disruption. Specific genes (e.g., MMP1, POSTN, IGF1, PTGFR, HK1) were identified as being upregulated in the cartilage of injured subjects across all timepoints regardless of treatment. At the 52-week timepoint, 4 genes (e.g., A4GALT, EFS, NPTXR, ABCA3) that-as far as we know-have yet to be associated with PTOA were identified as being concordantly differentially expressed across all treatment groups when compared to controls. Functional pathway analysis of injured subject cartilage compared to control cartilage revealed overarching patterns of cellular proliferation at 1 week, angiogenesis, ECM interaction, focal adhesion, and cellular migration at 4 weeks, and calcium signaling, immune system activation, GABA signaling, and HIF-1 signaling at 52 weeks.
Copyright: © 2023 Donnenfield et al. This is an open access article distributed under the terms of the Creative Commons Attribution License, which permits unrestricted use, distribution, and reproduction in any medium, provided the original author and source are credited.
Conflict of interest statement
Dr. Murray is a founder and equity holder, Dr. Proffen is a paid consultant and equity holder, and Dr. Fleming is a founder of Miach Orthopaedics, Inc, which was formed to upscale production of a scaffold for ACL restoration and is related to one of the ACL procedures described herein. Drs. Murray and Proffen maintain a conflict-of-interest management plan approved by Boston Children’s Hospital and Harvard Medical School. Dr. Fleming maintains a conflict-of-interest management plan with Rhode Island Hospital. This does not alter our adherence to PLOS ONE policies on sharing data and materials.
Figures


Similar articles
-
Microscopic and transcriptomic changes in porcine synovium one year following disruption of the anterior cruciate ligament.Osteoarthritis Cartilage. 2023 Dec;31(12):1554-1566. doi: 10.1016/j.joca.2023.07.014. Epub 2023 Sep 22. Osteoarthritis Cartilage. 2023. PMID: 37742942 Free PMC article.
-
Transcriptional profiling of articular cartilage in a porcine model of early post-traumatic osteoarthritis.J Orthop Res. 2018 Jan;36(1):318-329. doi: 10.1002/jor.23644. Epub 2017 Aug 3. J Orthop Res. 2018. PMID: 28671352 Free PMC article.
-
Bridge-Enhanced Anterior Cruciate Ligament Repair Leads to Greater Limb Asymmetry and Less Cartilage Damage Than Untreated ACL Transection or ACL Reconstruction in the Porcine Model.Am J Sports Med. 2021 Mar;49(3):667-674. doi: 10.1177/0363546521989265. Epub 2021 Feb 3. Am J Sports Med. 2021. PMID: 33534613 Free PMC article.
-
A Systematic Review of Basic Science and Animal Studies on the Use of Doxycycline to Reduce the Risk of Posttraumatic Osteoarthritis After Anterior Cruciate Ligament Rupture/Transection.Am J Sports Med. 2021 Jul;49(8):2255-2261. doi: 10.1177/0363546520965971. Epub 2020 Nov 20. Am J Sports Med. 2021. PMID: 33216621
-
The protective effect of anterior cruciate ligament reconstruction on articular cartilage: a systematic review of animal studies.Osteoarthritis Cartilage. 2019 Feb;27(2):219-229. doi: 10.1016/j.joca.2018.10.001. Epub 2018 Oct 11. Osteoarthritis Cartilage. 2019. PMID: 30317001
Cited by
-
Microscopic and transcriptomic changes in porcine synovium one year following disruption of the anterior cruciate ligament.Osteoarthritis Cartilage. 2023 Dec;31(12):1554-1566. doi: 10.1016/j.joca.2023.07.014. Epub 2023 Sep 22. Osteoarthritis Cartilage. 2023. PMID: 37742942 Free PMC article.
References
-
- CDC—Injury—ICRCs—CE001495 [Internet]. Centers for Disease Control and Prevention. Centers for Disease Control and Prevention; 2010. [cited 2022Dec19]. Available from: https://www.cdc.gov/injury/erpo/icrc/2009/1-R49-CE001495-01.html#print
Publication types
MeSH terms
Grants and funding
LinkOut - more resources
Full Text Sources
Medical
Miscellaneous
