. 2023 May 3;9(18):eadf0108.
doi: 10.1126/sciadv.adf0108. Epub 2023 May 3.

γδ-Enriched CAR-T cell therapy for bone metastatic castrate-resistant prostate cancer

Affiliations

γδ-Enriched CAR-T cell therapy for bone metastatic castrate-resistant prostate cancer

Jeremy S Frieling et al. Sci Adv. .

Abstract

Immune checkpoint blockade has been largely unsuccessful for the treatment of bone metastatic castrate-resistant prostate cancer (mCRPC). Here, we report a combinatorial strategy to treat mCRPC using γδ-enriched chimeric antigen receptor (CAR) T cells and zoledronate (ZOL). In a preclinical murine model of bone mCRPC, γδ CAR-T cells targeting prostate stem cell antigen (PSCA) induced a rapid and significant regression of established tumors, combined with increased survival and reduced cancer-associated bone disease. Pretreatment with ZOL, a U.S. Food and Drug Administration-approved bisphosphonate prescribed to mitigate pathological fracture in mCRPC patients, resulted in CAR-independent activation of γδ CAR-T cells, increased cytokine secretion, and enhanced antitumor efficacy. These data show that the activity of the endogenous Vγ9Vδ2 T cell receptor is preserved in CAR-T cells, allowing for dual-receptor recognition of tumor cells. Collectively, our findings support the use of γδ CAR-T cell therapy for mCRPC treatment.


Figures
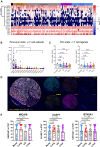
Fig. 1.
Fig. 1.. BTN expression and spontaneous gamma/delta T cell infiltration in prostate tumors.
(A) Bioinformatic analysis of TCR gamma variable regions (TRGV), BTN3A1, BTN2A1, ULBP1, MICA, MICB, and PSCA in bone and soft tissue biopsies from 118 individuals with mCRPC (SU2C/PCF dataset). (B) Specific comparison of TRGV expression in bone metastases. RPKM, reads per kilobase of transcript per million mapped reads. (C) BTN2A1 and BTN3A1 expression in bone, liver, lymph node (LN), and other soft tissue metastasis sites compared to primary prostate tumors. (D) Representative multiplex staining of bone metastasis sample from TMA containing 1-mm cores. (E) Expression of BTN3A1 and stress markers MICA/B and ULBP1 in tumor cells (PCK+) from a TMA containing samples from patients with metastatic prostate cancer in different tissues. Only samples with more than 100 PCK+ cells were considered for the analysis (n = 64, 27, 52, and 70 for bone, lung, lymph node, and liver samples, respectively). Each dot represents a sample. Bars represent means ± SEM. Linear mixed effect model was used for statistical analysis.
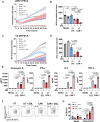
Fig. 2.
Fig. 2.. Impact of CAR endodomain design.
(A) Representative plot of the comparison of CAR expression in αβ versus γδ T cells from the same donor. Surface CAR expression assessed by flow cytometry after staining with Biotin-Protein L and streptavidin-PE. Gated on lymphoid, single, viable cells. (B) Representative plot of the phenotypic changes induced in γδ T cells by expression of CARs with different CAR hinge/transmembrane domains (CD8 or CD28). Gated on lymphoid, single, viable (DAPI), CD3+CD45+ , Vδ2 TCR T cells. (C) Real-time cytotoxicity assay (RTCA) analysis of C4-2B PSCA+ cells cocultured in the absence of T cells (Media), with UT γδ T cells, GFP-expressing γδ T cells, or γδ CAR-T cells (ratio 1:1 tumor:T cells), displaying different costimulatory domains (CD27, CD28, and 4-1BB) and the same transmembrane domain (CD8). Bars represent means ± SEM. Quantification of AUC is shown as bar graph with statistically significant differences calculated by one-way ANOVA with multiple comparisons. (D) Quantification of IFN-γ (ELISA) in supernatants from different γδ CAR-T cells cocultured with C4-2B PSCA+ cells overnight. Percentage of CAR+ cells was normalized across samples. Data from a representative donor of n = 3 are shown. Each dot represents a technical replicate. Statistically significant differences were calculated by two-way ANOVA with multiple comparisons.
Fig. 3.
Fig. 3.. Regression of intratibial prostate tumors induced by γδ-enriched CAR-T cells.
(A) Schematic of in vivo experimental design to test γδ CAR-T cells using an intratibial injection model of bone metastatic prostate cancer. (B) Representative bioluminescence images from control (untreated) and γδ CAR-T–treated C4-2B PSCA+ tumor-bearing mice. (C) Quantification of tumor bioluminescence presented as mean luminescence (photons s−1 cm−2 sr−1) from control and γδ CAR-T–treated C4-2B PSCA+ tumor-bearing mice (n = 5 mice per group). γδ CAR-T cells were delivered on day 0 as indicated by an arrow. The y axis is split to allow visibility of recurring tumors in γδ CAR-T–treated mice at late stages; see fig. S4 for same data graphed with the solid y axis. (D) Competing risk survival analysis comparing γδ CAR-T–treated C4-2B PSCA+ tumor-bearing mice to untreated control.
Fig. 4.
Fig. 4.. Mitigation of tumor-induced bone disease by γδ-enriched CAR-T cells.
(A) Three-dimensional reconstructions of trabecular bone (top-down view) from high-resolution μCT scanning of tumor-naïve, control (untreated), and γδ CAR-T cell–treated mice bearing C4-2B PSCA+ tumors. (B to E) Trabecular bone volume, trabecular thickness, trabecular number, and trabecular spacing measurements derived from μCT bone reconstructions. (F) Representative x-ray images illustrating osteolytic lesions (white arrows) in tibias from tumor-naïve, untreated control, and γδ CAR-T cell–treated mice. (G) Quantification of osteolytic lesion area from x-ray images, presented as ratio to total bone area. (H) Representative images of trichrome-stained paraffin-embedded tibia sections. Aquamarine staining indicates bone, light pink indicates tumor (labeled “T”), and dark pink indicates bone marrow (labeled “BM”). n = 2 for naïve and 5 for control and γδ CAR-T groups, respectively. Each dot represents a sample. Statistical analyses were performed by two-tailed t test, unpaired, between independent groups.
Fig. 5.
Fig. 5.. Dual recognition of tumor by γδ CAR-T cells.
(A) RTCA analysis of 22Rv1 PSCA+ cells, cocultured with γδ UT cells or anti-PSCA γδ CAR-T cells (ratio 1:2.5 tumor:T cells), in the presence or absence of 4 μM ZOL. (B) Quantification of AUC of the RTCA analysis shown in (A). (C) RTCA analysis of C4-2B PSCA+ cells (ratio 1:2.5 tumor:T cells), cocultured with UT γδ T cells or anti-PSCA γδ CAR-T cells, in the presence or absence of 4 μM ZOL. (D) Quantification of AUC of the RTCA analysis shown in (C). (E) Cytokine release upon coculture of C4-2B PSCA+cells with medium or the indicated T cell effectors (ratio 1:5 tumor:T cells) in the presence of 4 μM ZOL. Data from one representative donor of n = 3 are shown as means ± SEM. Each dot represents a technical replicate. Statistical analyses were performed by one-way ANOVA, Holm-Šídák test. (F) Representative dot plots of CD107a expression in γδ T cells after 24 hours of coculture with C4-2B PSCA+ cells. Cells were gated on lymphoid, single, viable, CD45+, CD3+, TCRγ/δ +. (G) Expression (%) of CD107a in γδ T cells cocultured with C4-2B PSCA+ for 24 hours. Graphs show data from three different donors. Statistical analyses were performed by two-way ANOVA.
Fig. 6.
Fig. 6.. Enhancement of γδ-enriched CAR-T cell–mediated regression of intratibial prostate tumors by ZOL.
(A) Schematic of in vivo experimental design to assess the antitumor efficacy of γδ CAR-T cells using an intratibial injection model of bone metastatic prostate cancer. (B) Representative bioluminescence images from control (untreated), γδ GFP, and γδ CAR-T–treated C4-2B PSCA+ tumor-bearing mice ± ZOL. (C) Quantification of tumor bioluminescence presented as mean luminescence (photons s−1 cm−2 sr−1) from control γδ GFP– and γδ CAR-T (± ZOL)–treated C4-2B PSCA+ tumor-bearing mice (n = 7 mice per group). γδ CAR-T cells were delivered on day 0 as indicated by an arrow. (D) Enlarged view of dashed inset from (C) highlighting rapid regression of tumors in γδ CAR-T– and γδ CAR-T + ZOL–treated mice relative to controls. Asterisks denote statistical significance between γδ CAR-T– and γδ CAR-T + ZOL–treated mice at specified imaging days. (E) Statistical comparisons from tumor growth curves presented in (C). Statistical analyses were performed by AUC calculation and two-sample t test between independent treatment groups, and significant findings are denoted with bold font.
Fig. 7.
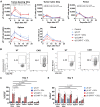
Fig. 7.. Accumulation of γδ CAR-T cells in tumor-bearing tibia.
(A) Number of γδ T cells after adoptive cell therapy (ACT) in the different locations. Results depicted as means ± SEM of n = 3 to 6 mice per time point (except for untreated group n = 2 mice per time point) in two different experiments. Statistical analyses were performed by two-way ANOVA. Significance with respect to the UT group is shown. Only significant values are shown. (B) Representative dot plots of CD25 expression in γδ T cells at day 5 in mice from UT and CAR groups. Cells were gated on lymphoid, single, viable, CD45+, CD3+, Vδ2+. (C) Expression (%) of CD25 in γδ T cells at day 5 after ACT in the different locations. (D) Representative dot plots of PD-1 expression in γδ T cells at day 5 in mice from UT and CAR groups. Cells were gated on lymphoid, single, viable, CD45+, CD3+, Vδ2+. (E) Expression (%) of PD-1 in γδ T cells at day 5 after ACT in the different locations. Results depicted as means ± SEM of n = 6 mice per time point in two different experiments. Statistical analyses were performed by two-way ANOVA. Significance with respect to the CAR group in the different locations is shown.
Fig. 8.
Fig. 8.. Enhancement of γδ-enriched CAR-T cell protection from tumor-induced osteolysis by ZOL.
(A) Three-dimensional reconstructions of trabecular bone (top-down view) from high-resolution μCT scanning of tumor-naïve, control (untreated), and γδ CAR-T cell (± ZOL)–treated mice. (B) Trabecular bone volume, (C) trabecular thickness, (D) trabecular number, and (E) trabecular spacing measurements derived from μCT bone reconstructions. (F) Representative x-ray images illustrating osteolytic lesions (arrowheads) in tibias from tumor-naïve, untreated control, and γδ CAR-T cell (± ZOL)–treated mice. (G) Quantification of osteolytic lesion area from x-ray images, presented as ratio to total bone area. (H) Trichrome-stained tibia sections illustrating trabecular bone area (aquamarine), tumor (indicated with “T,” light pink), and bone marrow (indicated with “BM,” purple). (I) Quantification of trabecular bone area in trichrome-stained tissue sections. Trabecular area was measured using ImageJ and presented as ratio to total area. n = 5 to 7. Each dot represents a sample. Statistical analyses were performed by two-tailed t test, unpaired.

References

    1. Bubendorf L., Schopfer A., Wagner U., Sauter G., Moch H., Willi N., Gasser T. C., Mihatsch M. J., Metastatic patterns of prostate cancer: An autopsy study of 1,589 patients. Hum. Pathol. 31, 578–583 (2000). - PubMed
    1. Frieling J. S., Basanta D., Lynch C. C., Current and emerging therapies for bone metastatic castration-resistant prostate cancer. Cancer Control 22, 109–120 (2015). - PMC - PubMed
    1. Arriaga J. M., Panja S., Alshalalfa M., Zhao J., Zou M., Giacobbe A., Madubata C. J., Kim J. Y., Rodriguez A., Coleman I., Virk R. K., Hibshoosh H., Ertunc O., Ozbek B., Fountain J., Jeffrey Karnes R., Luo J., Antonarakis E. S., Nelson P. S., Feng F. Y., Rubin M. A., De Marzo A. M., Rabadan R., Sims P. A., Mitrofanova A., Abate-Shen C., A MYC and RAS co-activation signature in localized prostate cancer drives bone metastasis and castration resistance. Cancer 1, 1082–1096 (2020). - PMC - PubMed
    1. Greenspan S. L., Coates P., Sereika S. M., Nelson J. B., Trump D. L., Resnick N. M., Bone loss after initiation of androgen deprivation therapy in patients with prostate cancer. J. Clin. Endocrinol. Metab. 90, 6410–6417 (2005). - PubMed
    1. Campbell S. C., Bhoopalam N., Moritz T. E., Pandya M., Iyer P., Vanveldhuizen P., Ellis N. K., Thottapurathu L., Garewal H., Warren S. R., Friedman N., Reda D. J., The use of zoledronic acid in men receiving androgen deprivation therapy for prostate cancer with severe osteopenia or osteoporosis. Urology 75, 1138–1143 (2010). - PubMed

Substances