. 2023 May 3;9(18):eadf0115.
doi: 10.1126/sciadv.adf0115. Epub 2023 May 3.

Acetylcarnitine shuttling links mitochondrial metabolism to histone acetylation and lipogenesis

Affiliations

Acetylcarnitine shuttling links mitochondrial metabolism to histone acetylation and lipogenesis

Luke T Izzo et al. Sci Adv. .

Abstract

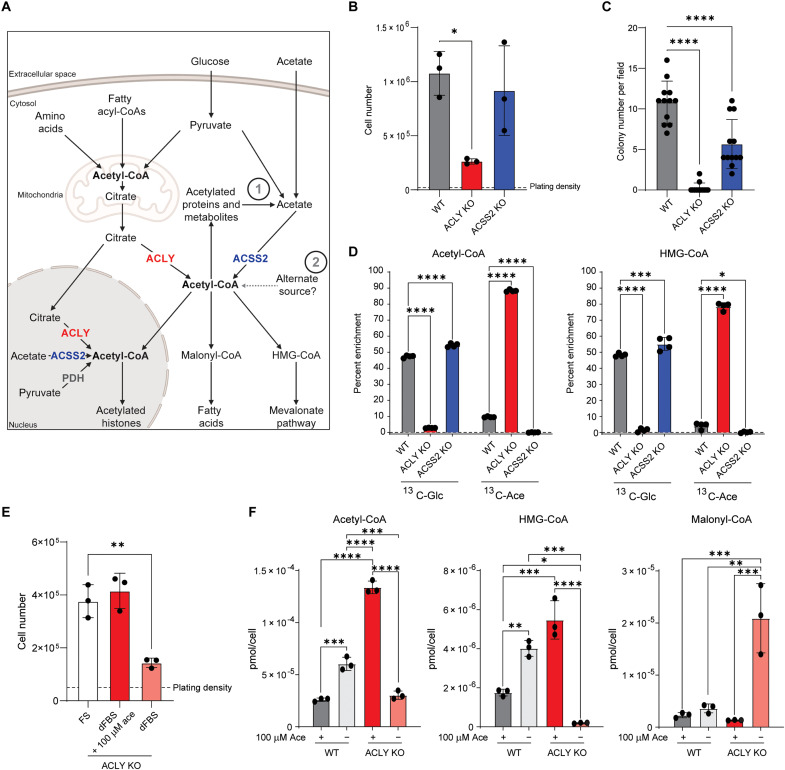
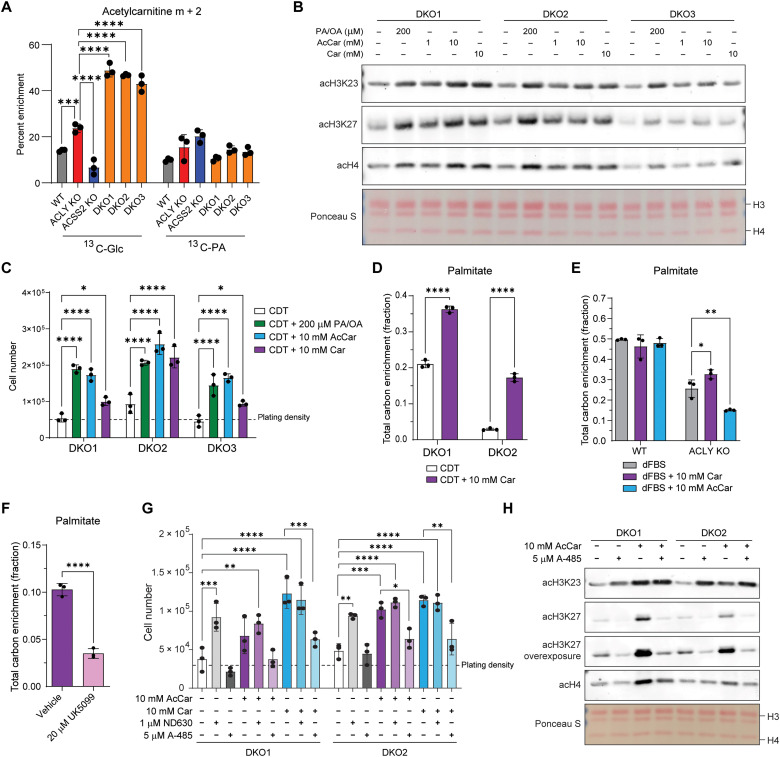
The metabolite acetyl-CoA is necessary for both lipid synthesis in the cytosol and histone acetylation in the nucleus. The two canonical precursors to acetyl-CoA in the nuclear-cytoplasmic compartment are citrate and acetate, which are processed to acetyl-CoA by ATP-citrate lyase (ACLY) and acyl-CoA synthetase short-chain 2 (ACSS2), respectively. It is unclear whether other substantial routes to nuclear-cytosolic acetyl-CoA exist. To investigate this, we generated cancer cell lines lacking both ACLY and ACSS2 [double knockout (DKO) cells]. Using stable isotope tracing, we show that both glucose and fatty acids contribute to acetyl-CoA pools and histone acetylation in DKO cells and that acetylcarnitine shuttling can transfer two-carbon units from mitochondria to cytosol. Further, in the absence of ACLY, glucose can feed fatty acid synthesis in a carnitine responsive and carnitine acetyltransferase (CrAT)-dependent manner. The data define acetylcarnitine as an ACLY- and ACSS2-independent precursor to nuclear-cytosolic acetyl-CoA that can support acetylation, fatty acid synthesis, and cell growth.


Figures

Fig. 1.
Fig. 1.. ACLY KO cancer cells proliferate in the absence of exogenous acetate.
(A) Schematic diagram of acetyl-CoA metabolism. Arrows represent biochemical conversions. Numbers refer to potential ACLY- and exogenous acetate-independent acetyl-CoA generating pathways in the nuclear-cytosolic compartment. Created with BioRender.com. (B) Proliferation of WT, ACLY KO, and ACSS2 KO HCC cell lines over 4 days in Dulbecco’s modified Eagle’s medium (DMEM) + 10% FS. Statistical significance was calculated by one-way analysis of variance (ANOVA). (C) Colony formation in soft agar of WT, ACLY KO, and ACSS2 KO HCC cells. Colonies were counted at ×4 magnification. Data are from three replicate wells with four fields counted per well. Statistical significance was calculated by one-way ANOVA. (D) Whole cell acetyl-CoA and HMG-CoA percent carbon enrichment in WT, ACLY KO, and ACSS2 KO HCC cells cultured in glucose- and glutamine-free DMEM + 10% dFBS + either 10 mM 13C6-glucose (13C-Glc) + 100 μM acetate or 10 mM glucose + 100 μM 13C2-acetate (13C-Ace) for 6 hours. Statistical significance was calculated by two-way ANOVA. (E) ACLY KO proliferation in DMEM + 10% FS, DMEM + 10% dFBS, or DMEM + 10% dFBS ± 100 μM acetate for 96 hours. Statistical significance was calculated by one-way ANOVA. (F) Whole-cell acyl-CoA measurements of WT and ACLY KO cells grown in DMEM + 10% dFBS or DMEM + 10% dFBS ± 100 μM acetate for 24 hours. Statistical significance was calculated by two-way ANOVA comparing all conditions and genotypes. FS, full serum (10% calf serum); dFBS, dialyzed FBS. Each point represents a biological replicate, and error bars represent SD. *P ≤ 0.05; **P ≤ 0.01; ***P ≤ 0.001; ****P ≤ 0.0001.
Fig. 2.
Fig. 2.. ACLY/ACSS2 DKO cancer cells are viable and maintain a cytosolic pool of acetyl-CoA.
(A) Western blot for ACLY and ACSS2 in WT, ACLY KO, ACSS2 KO, and three DKO cell lines. (B) Proliferation of ACLY KO and DKO HCC cell lines after 5 days in DMEM + 10% FS. Data are represented as mean of three replicates ± SD. Statistical significance was calculated by one-way ANOVA between samples. (C) Whole-cell acyl-CoA measurements in WT, ACLY KO, ACSS2 KO, and DKO cell lines grown in DMEM + 10% dFBS + 100 μM acetate for 24 hours. Statistical significance was calculated by one-way ANOVA. (D) Acyl-CoA quantitation using SILEC-SF performed on DKO1 cells grown in DMEM + 10% dFBS + 100 μM acetate for 24 hours. 3H(I)B-CoA, 3-HB-CoA, and (iso)butyryl-CoA are not resolved and are represented together. Acyl-CoA species marked with n.d. were not detected in n = 4 samples. Abundance of acyl-CoAs within a given compartment can be compared to one another. Each point represents a biological replicate, and error bars represent SD. *P ≤ 0.05; ***P ≤ 0.001; ****P ≤ 0.0001.
Fig. 3.
Fig. 3.. ACLY and ACSS2 deficiency alters fatty acid metabolism and causes reliance on exogenous fatty acids.
(A) Heatmap of all differentially expressed genes between all four genotypes, log2 fold change > 2 and an adjusted P value < 0.01 expressed as row Z-score. DESeq counts were log2-transformed before clustering. Row clusters (red, orange, blue, light gray, and dark gray) represent groups of genes commonly differentially regulated by sample cluster. See table S1 for gene list by cluster. (B) The top six up-regulated and down-regulated Hallmarks gene sets from GSEA analysis comparing DKO cells to all other genotypes. ES, enrichment score; NES, normalized enrichment score. (C) Genes from the hallmarks fatty acid metabolism gene set commonly up-regulated across DKO1 samples. Cluster expanded from fig. S3D. DESeq counts were log2-transformed before clustering. (D and E) Cell proliferation after 96 hours. Cells were plated in DMEM/F12 media overnight and then cultured in DMEM + 10% FS or CDT serum with or without the addition of metabolites. PA/OA is 100 μM of each fatty acid conjugated to bovine serum albumin (BSA; 200 μM total). BSA condition is equal volume of fatty acid–free BSA as added to PA/OA condition. Statistical significance was calculated by two-way ANOVA. (F) Western blot analysis of cells cultured in DMEM + 10% CDT serum with or without PA/OA. PA/OA is 100 μM of each fatty acid conjugated to BSA (200 μM total). Without PA/OA conditions contain fatty acid–free BSA. PARP, poly(adenosine diphosphate–ribose) polymerase. (G) Isotopologue enrichment of palmitate measured by GC-MS. Cells were cultured in DMEM + 10% D2O + 10% dFBS +100 μM acetate for 24 hours. Bars represent mean of three or four biological replicates for each cell line. Statistical analysis performed on total hydrogen enrichment. Statistical significance was calculated by one-way ANOVA. CDT, charcoal dextran treated. Each point represents a biological replicate, and error bars represent SD. *P ≤ 0.05; **P ≤ 0.01; ***P ≤ 0.001; ****P ≤ 0.0001.
Fig. 4.
Fig. 4.. Fatty acid availability modulates histone acetylation independent of ACLY and ACSS2.
(A) Fraction of the total quantified H3K23 residues acetylated by LC-MS. Statistical significance was calculated by one-way ANOVA. (B) Fraction of the total quantified H3K14 residues acetylated by LC-MS. Statistical significance was calculated by one-way ANOVA. (C) Acid-extracted histone Western blot from cells grown in DMEM + 10% FS and treated with 500 nM TSA over a time course. Ponceau S stain for total protein in histone extracts used for Western blot. (D) Whole-cell protein extract Western blot from cells grown in DMEM + 10% FS and treated with 500 nM TSA and 500 μM nicotinamide (NAM) over a time course. Ponceau S stain for total protein in histone extracts used for Western blot. (E) Acid-extracted histone Western blot from cells cultured in DMEM + 10% FS or CDT for 24 hours. Ponceau S stain for total protein in histone extracts used for Western blot. (F) Acid-extracted histone Western blot from cells cultured for 24 hours in DMEM + 10% CDT and supplemented with PA/OA. PA/OA is 100 μM of each fatty acid conjugated to BSA (200 μM total). Ponceau S stain for total protein in histone extracts used for Western blot. Each point represents a biological replicate, and error bars represent SD. **P ≤ 0.01; ****P ≤ 0.0001.
Fig. 5.
Fig. 5.. Fatty acids and glucose can supply acetyl-CoA for histone acetylation in a manner independent of ACLY and ACSS2.
(A) Schematic depicting glucose, palmitate, and acetate carbon tracing into acetyl-CoA and histone acetylation. Created with BioRender.com. (B) 13C-Glc and 13C16-palmitate tracing into acetyl-CoA analyzed by LC-MS. Cells were cultured in glucose- and glutamine-free DMEM + 10% CDT supplemented with 4 mM glutamine and either 10 mM 13C-Glc and 100 μM palmitate conjugated to BSA or 10 mM glucose and 100 μM 13C16-palmitate conjugated to BSA for 2 hours. Statistical significance was calculated by two-way ANOVA. (C) Acetyl-CoA and malonyl-CoA enrichment from 13C-Glc or 13C-Ace. Cells were cultured in glucose- and glutamine-free DMEM + 10% dFBS supplemented with 4 mM glutamine and either 10 mM 13C-Glc and 100 μM acetate or 10 mM glucose and 100 μM 13C-Ace for 6 hours. Statistical significance was calculated by two-way ANOVA. (D) 13C-Glc and 13C16-palmitate tracing into acetylation on extracted histones, analyzed by LC-MS. Cells were cultured in glucose- and glutamine-free DMEM + 10% CDT supplemented with 4 mM glutamine and either 10 mM 13C-Glc and 100 μM palmitate conjugated to BSA or 10 mM glucose and 100 μM 13C16-palmitate conjugated to BSA for 24 hours. Statistical significance was calculated by two-way ANOVA. (E) 13C-Glc and 13C16-palmitate tracing into TCA cycle intermediates, analyzed by GC-MS. Cells were cultured in glucose- and glutamine-free DMEM + 10% CDT supplemented with 4 mM glutamine and either 10 mM 13C-Glc and 100 μM palmitate conjugated to BSA or 10 mM glucose and 100 μM 13C16-palmitate conjugated to BSA for 6 hours. Statistical significance was calculated by two-way ANOVA. Each point represents a biological replicate, and error bars represent SD. All tests compared to ACLY KO as the control. *P ≤ 0.05; **P ≤ 0.01; ***P ≤ 0.001; ****P ≤ 0.0001.
Fig. 6.
Fig. 6.. Carnitine facilitates histone acetylation and DNL from glucose-derived carbon.
(A) 13C-Glc and 13C16-palmitate tracing into acetylcarnitine, analyzed by LC-MS. Cells were cultured in glucose- and glutamine-free DMEM + 10% CDT with 4 mM glutamine and either 10 mM 13C-Glc and 100 μM palmitate or 10 mM glucose and 100 μM 13C16-palmitate for 6 hours. Statistical significance was calculated by two-way ANOVA. (B) Acid-extracted histone Western blot from cells cultured in DMEM + 10% CDT for 24 hours supplemented with PA/OA, acetylcarnitine, or carnitine. PA/OA is 100 μM of each fatty acid (200 μM total). Ponceau S stain for total protein in histone extracts used for Western blot. (C) Cell proliferation after 96 hours. Cells were plated in DMEM/F12 media overnight then cultured in DMEM + 10% CDT serum with or without the addition of metabolites. PA/OA is 100 μM of each fatty acid (200 μM total). Statistical significance was calculated by two-way ANOVA. (D to F) 13C-Glc tracing into palmitate measured by GC-MS. Cells were cultured in glucose- and glutamine-free DMEM + 10% CDT or dFBS supplemented with 4 mM glutamine and 10 mM 13C-Glc with or without 10 mM carnitine (D and E) or with 10 mM carnitine with vehicle control or 20 μM UK5099 (F) for 48 hours. Statistical significance was calculated by unpaired t tests (D and F) or two-way ANOVA (E). (G) Cell proliferation after 96 hours as in (C) or without the addition of metabolites or inhibitors. Statistical significance was calculated by two-way ANOVA comparing all conditions within genotypes, and not all significant comparisons are shown. (H) Acid-extracted histone Western blot as in (B) supplemented with acetylcarnitine and/or p300 inhibition. Each point represents a biological replicate, and error bars represent SD. *P ≤ 0.05; **P ≤ 0.01; ***P ≤ 0.001; ****P ≤ 0.0001.
Fig. 7.
Fig. 7.. Acetylcarnitine shuttling provides acetyl-units to the nuclear cytosolic compartment.
(A and B) Cell proliferation after 96 hours. Cells were plated in DMEM/F12 media overnight and then cultured in DMEM + 10% dFBS ± 100 μM acetate (A) or DMEM + 10% dFBS ± 1 mM acetate and or the ACSS2 inhibitor VY-3-135 (B). Statistical significance was calculated by two-way ANOVA (A) or two-way ANOVA comparing all conditions within genotypes (B). (C) 13C-Glc tracing into fatty acids measured by GC-MS. Cells were cultured in glucose- and glutamine-free DMEM + 10% dFBS supplemented with 4 mM glutamine and 10 mM 13C-Glc with or without 10 mM carnitine for 48 hours. Statistical significance was calculated by unpaired t tests. (D) 13C-Glc tracing into acetylcarnitine, analyzed by LC-MS. Cells were cultured in glucose- and glutamine-free DMEM + 10% dFBS supplemented with 4 mM glutamine and 10 mM 13C-Glc for 6 hours. Statistical significance was calculated by one-way ANOVA. (E) Mitochondrial fractionation of HCC cells and Western blotting for CrAT, a cytosolic marker (FASN), and mitochondrial markers (HSP60, CS, and VDAC). The band above CrAT is nonspecific. (F) Acid-extracted histone Western blot from cells cultured in DMEM + 10% dFBS supplemented with or without carnitine or acetylcarnitine for 24 hours. (G) Deuterium tracing into palmitate measured by GC-MS. Cells were cultured in DMEM + 10% D2O + 10% dFBS ± 10 mM acetate, carnitine, or acetylcarnitine for 24 hours. Statistical significance was calculated by two-way ANOVA. (H) In vitro CrAT activity assay. Production of acetyl-CoA from acetylcarnitine is shown over time. (I) Schematic depicting CrAT-dependent acetylcarnitine shuttling out of the mitochondria for acetyl-CoA generation in the nuclear-cytosolic compartment. Created with BioRender.com. Each point represents a biological replicate, and error bars represent SD. *P ≤ 0.05; **P ≤ 0.01; ***P ≤ 0.001; ****P ≤ 0.0001.

References

    1. D. A. Guertin, K. E. Wellen, Acetyl-CoA metabolism in cancer. Nat. Rev. Cancer 23, 156–172 (2023). - PMC - PubMed
    1. S. Bose, V. Ramesh, J. W. Locasale, Acetate metabolism in physiology, cancer, and beyond. Trends Cell Biol. 29, 695–703 (2019). - PMC - PubMed
    1. B. Batchuluun, S. L. Pinkosky, G. R. Steinberg, Lipogenesis inhibitors: Therapeutic opportunities and challenges. Nat. Rev. Drug Discov. 21, 283–305 (2022). - PMC - PubMed
    1. S. Zhao, A. M. Torres, R. A. Henry, S. Trefely, M. Wallace, J. V. Lee, A. Carrer, A. Sengupta, S. L. Campbell, Y.-M. Kuo, A. J. Frey, N. Meurs, J. M. Viola, I. A. Blair, A. M. Weljie, C. M. Metallo, N. W. Snyder, A. J. Andrews, K. E. Wellen, ATP-citrate lyase controls a glucose-to-acetate metabolic switch. Cell Rep. 17, 1037–1052 (2016). - PMC - PubMed
    1. C. M. Calejman, S. Trefely, S. W. Entwisle, A. Luciano, S. M. Jung, W. Hsiao, A. Torres, C. M. Hung, H. Li, N. W. Snyder, J. Villén, K. E. Wellen, D. A. Guertin, mTORC2-AKT signaling to ATP-citrate lyase drives brown adipogenesis and de novo lipogenesis. Nat. Commun. 11, 575 (2020). - PMC - PubMed

LinkOut - more resources