. 2023 May 3;9(18):eadf4896.
doi: 10.1126/sciadv.adf4896. Epub 2023 May 3.

Density declines, richness increases, and composition shifts in stream macroinvertebrates

Affiliations

Density declines, richness increases, and composition shifts in stream macroinvertebrates

Samantha L Rumschlag et al. Sci Adv. .

Abstract

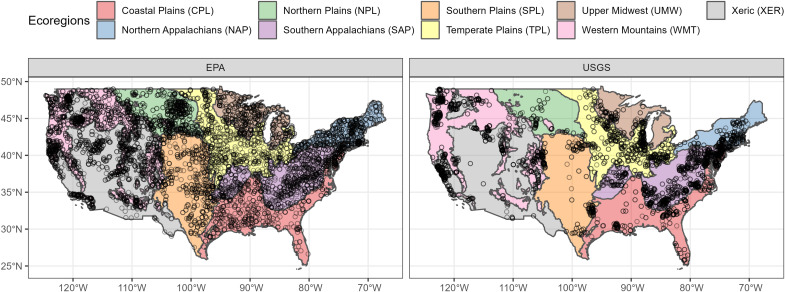
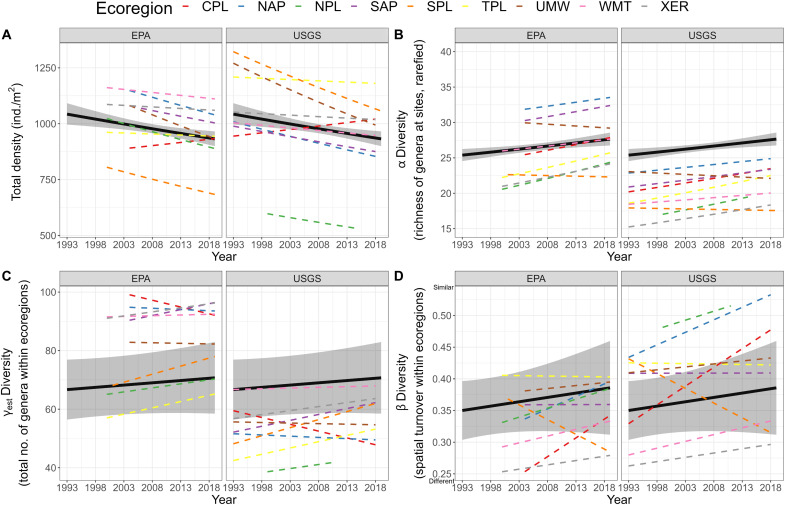
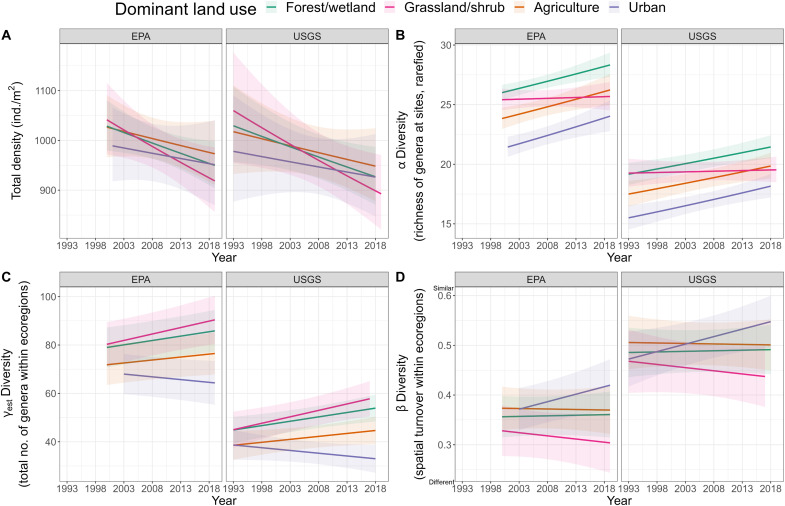
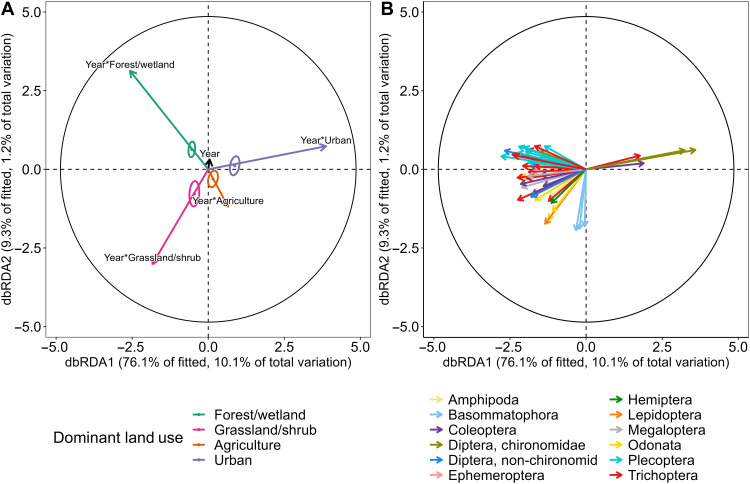
Documenting trends of stream macroinvertebrate biodiversity is challenging because biomonitoring often has limited spatial, temporal, and taxonomic scopes. We analyzed biodiversity and composition of assemblages of >500 genera, spanning 27 years, and 6131 stream sites across forested, grassland, urban, and agricultural land uses throughout the United States. In this dataset, macroinvertebrate density declined by 11% and richness increased by 12.2%, and insect density and richness declined by 23.3 and 6.8%, respectively, over 27 years. In addition, differences in richness and composition between urban and agricultural versus forested and grassland streams have increased over time. Urban and agricultural streams lost the few disturbance-sensitive taxa they once had and gained disturbance-tolerant taxa. These results suggest that current efforts to protect and restore streams are not sufficient to mitigate anthropogenic effects.


Figures

Fig. 1.
Fig. 1.. The spatial distribution of sites within ecoregions that were used to calculate site-level biodiversity metrics (total densities and α diversity) and regional biodiversity metrics (α¯, γest, and β diversities).
We used a newly derived dataset that combines 27 years of standardized stream macroinvertebrate monitoring conducted by the EPA and USGS. For an additional detailed map, see fig. S1.
Fig. 2.
Fig. 2.. Temporal biodiversity trends of macroinvertebrate communities.
Trends show (A) decreases in total density of macroinvertebrates identified to genus [conditional coefficient of determination (R2), 0.81; marginal R2, 0.77; F(Year), 8.4; P(Year), 0.004], (B) increases in α diversity [conditional R2, 0.68; marginal R2, 0.34; χ2 (Year), 68.0; P(Year), <0.0001], and no change in (C) γest diversity [conditional R2, 0.82; marginal R2, 0.05; F(Year), 0.7; P(Year), 0.424] or (D) β diversity [conditional R2, 0.72; marginal R2, 0.03; F(Year), 1.0; P(Year), 0.344]. Here, greater values of β diversity specify increasingly similar communities. Additional statistical output provided in table S2. Ecoregion abbreviations provided in Fig. 1.
Fig. 3.
Fig. 3.. Temporal biodiversity trends of macroinvertebrate communities across dominant land use types.
There was (A) no variation in total density across land use types [conditional R2, 0.81; marginal R2, 0.77; F(Year), 0.7; P(Year), 0.418; F(Land use), 0.4; P(Land use), 0.748; F(Year*Land use), 0.4; P(Year*Land use), 0.717], (B) lower α diversity in urban streams than all other land use types [conditional R2, 0.63; marginal R2, 0.36; χ2 (Year), 6.5; P(Year), 0.011; χ2 (Land use), 65.7; P(Land use), <0.0001; χ2 (Year*Land use), 9.4; P(Year*Land use), similar different 0.024], (C) decreases in γest diversity for urban streams, no change for agricultural streams, and increases for forest/wetland and grassland/shrub [conditional R2, 0.74; marginal R2, 0.68; F(Year), 2.7; P(Year), 0.103; F(Land use), 1.3; P(Land use), 0.299; F(Year*Land use), 4.7; P(Year*Land use), 0.003], and (D) urban stream communities homogenize through time, although these trends did not vary significantly in comparison to other land use types [conditional R2, 0.43; marginal R2, 0.28; F(Year), 0.02; P(Year), 0.878; F(Land use), 0.5; P(Land use), 0.655; F(Year*Land use), 2.0; P(Year*Land use), 0.111]. Additional statistical output is provided in table S4.
Fig. 4.
Fig. 4.. Partial distance-based redundancy analysis (accounting for agency, ecoregion, and improvements in taxonomic identification) demonstrating that composition of macroinvertebrate communities has changed differentially through time according to land use.
(A) Plot of model predictors showing the additive and interactive effects of land use and year. Individual points and circles are the centroids and 95% confidence intervals of ecoregion-year combinations according to dominant land use. (B) Corresponding vector overlay of model responses. Individual vectors are either families for all non-chironomid macroinvertebrates or subfamilies for chironomids. As shown in the legend, non-chironomid macroinvertebrate vectors are colored by order, and chironomid vectors are colored by family. Vectors with lengths less than 0.3 have been excluded. In both plots, the black circles correspond to vector lengths that would have a correlation coefficient of one with each axis. The entire dbRDA model explains 44.6% of the variance. Additional statistical output included in table S6.

References

    1. Strayer D. L., Dudgeon D., Freshwater biodiversity conservation: Recent progress and future challenges. J. North Am. Benth. Soc. 29, 344–358 (2010).
    1. Baron J. S., Poff N. L. R., Angermeier P. L., Dahm C. N., Gleick P. H., Hairston N. G. Jr., Jackson R. B., Johnston C. A., Richter B. D., Steinman A. D., Meeting ecological and societal needs for freshwater. Ecol. Appl. 12, 1247–1260 (2002).
    1. He F., Zarfl C., Bremerich V., David J. N. W., Hogan Z., Kalinkat G., Tockner K., Jähnig S. C., The global decline of freshwater megafauna. Glob. Chang. Biol. 25, 3883–3892 (2019). - PubMed
    1. van Klink R., Bowler D. E., Gongalsky K. B., Swengel A. B., Gentile A., Chase J. M., Meta-analysis reveals declines in terrestrial but increases in freshwater insect abundances. Science 368, 417–420 (2020). - PubMed
    1. Dirzo R., Young H. S., Galetti M., Ceballos G., Isaac N. J. B., Collen B., Defaunation in the Anthropocene. Science 345, 401–406 (2014). - PubMed