. 2023 Aug 1;146(8):3542-3557.
doi: 10.1093/brain/awad090.

Speech- and language-linked FOXP2 mutation targets protein motors in striatal neurons

Affiliations

Speech- and language-linked FOXP2 mutation targets protein motors in striatal neurons

Hsiao-Ying Kuo et al. Brain. .

Abstract

Human speech and language are among the most complex motor and cognitive abilities. The discovery of a mutation in the transcription factor FOXP2 in KE family members with speech disturbances has been a landmark example of the genetic control of vocal communication in humans. Cellular mechanisms underlying this control have remained unclear. By leveraging FOXP2 mutation/deletion mouse models, we found that the KE family FOXP2R553H mutation directly disables intracellular dynein-dynactin 'protein motors' in the striatum by induction of a disruptive high level of dynactin1 that impairs TrkB endosome trafficking, microtubule dynamics, dendritic outgrowth and electrophysiological activity in striatal neurons alongside vocalization deficits. Dynactin1 knockdown in mice carrying FOXP2R553H mutations rescued these cellular abnormalities and improved vocalization. We suggest that FOXP2 controls vocal circuit formation by regulating protein motor homeostasis in striatal neurons, and that its disruption could contribute to the pathophysiology of FOXP2 mutation/deletion-associated speech disorders.

Keywords: basal ganglia; endosome trafficking; microtubule; striatum; vocalization.


Conflict of interest statement

The authors report no competing interests.

Figures

Figure 1
Figure 1
FOXP2 transcriptionally represses Dctn1 in striatal neurons. (A and B) Quantitative RT-PCR and western blotting show that Dctn1 mRNA (A) and protein (B) levels were upregulated in the striatum of Foxp2 KO mice. (CE) Overexpression of Foxp2 suppresses DCTN1 expression in cultured striatal neurons (C, C′, E) compared with control neurons (D, D′ and E). Three independent experiments were performed. (F) Schematic drawing of the reporter gene construct containing intron 1 region of mouse Dctn1. Putative FOXP DNA-binding sites are indicated by red lines. (G) The ChIP assay shows positive signals with immunoprecipitation of Foxp2 antibody, but not control IgG antibody. PCR primer pair s1-as2 flank the DNA fragment containing the putative Foxp2 motifs at −1891 to −1652 bp (predicted size, 700 bp); s4-as3 flank the fragment containing the putative motifs at −512 to −490 bp (predicted size, 560 bp). (H) Luciferase reporter gene assay in ST14A cells shows that overexpression of WT Foxp2 repressed luciferase activity. By contrast, overexpression of Foxp2R552H mutants failed to suppress luciferase activity. *P < 0.05, **P < 0.01. Student's t-test was used in A, B and E. One-way ANOVA with Tukey's honest significant difference (HSD) post hoc test was used in H. Data are mean ± SEM.
Figure 2
Figure 2
Dendritic trafficking of TrkB-mRFP-labelled endosomes is impaired in Foxp2 KO striatal neurons. (AD) TrkB-mRFP-labelled vesicles were transported within proximal dendrites of cultured striatal neurons. The video snapshots show tracing of TrkB-mRFP vesicles every 6 s for 1 min (Supplementary Videos 1–4). The triangles indicate the positions of vesicles in the dendrite, with the same colours of triangles tracking the same vesicles. The motility of TrkB-mRFP vesicles was reduced in Foxp2 KO neurons (C) compared with WT neurons (A). (A′D′) Kymographs generated from time-lapse video microscopy of trajectories of TrkB-mRFP-labelled vesicles for 180 s. Kymographs of live imaging video show the traces of each vesicle in the 3-min recording. (E and F) The abnormalities in the distance (E) and speed (F) of TrkB-mRFP-labelled vesicles were rescued by shDctn1 knockdown in Foxp2 KO neurons (D). Cultured cells in each group were prepared from at least four litters of P0 neonatal mice. *P < 0.05, **P < 0.01. One-way ANOVA followed by Tukey's HSD post hoc test. Data are mean ± SEM.
Figure 3
Figure 3
Microtubule dynamics are impaired in dendrites of Foxp2 KO striatal neurons. (AD) The microtubule dynamics were monitored in proximal dendrites of cultured striatal neurons with time-lapse video microscopy. The video snapshots show tracing of EB3-tdTomato-labelled particles every 3 s (Supplementary Videos 5–8). The triangles indicate the positions of particles in the dendrite, with the same colours of triangles tracking the same particles. The microtubule dynamics were reduced in Foxp2 KO neurons (C) compared with Foxp2 WT neurons (A). The reduction in microtubule dynamics was rescued by knocking down Dctn1 in Foxp2 KO neurons (D). (A′D′) Kymographs generated from time-lapse video microscopy of trajectories of EB3-tdTomato comet for 1 min. (EG) The abnormalities in density (E), distance (F) and speed (G) of tdTomato-EB3 particles in Foxp2 KO neurons were rescued by shDctn1 knockdown in Foxp2 KO neurons. Cultured cells in each group were prepared from at least three litters of P0 neonatal mice. *P < 0.05, **P < 0.01, ***P < 0.001. Kruskal–Wallis one-way ANOVA followed by Dunn's pairwise multiple comparisons test is used in E. One-way ANOVA with Tukey's HSD post hoc test is used in F and G. Data are median ± interquartile range in E and mean ± SEM in F and G.
Figure 4
Figure 4
The integrity of the dynein-dynactin protein complex is compromised in Foxp2 KO striatal neurons. (AE) PLA-generated fluorescent signals using rabbit anti-DIC and mouse anti-DCTN1 antibodies are shown in striatal cultured cells at 7-days in vitro. Signals of fluorescent puncta (red) indicating physical interaction between DIC and DCTN1 proteins are detected in the soma and neurite of WT striatal cells (A). Few fluorescent puncta were found in Foxp2 KO cells (B). (C) Positive control with mouse anti-DCTN1 and rabbit anti-Dctn1 antibodies. (D and E) Negative controls with mouse anti-DCTN1 antibody alone (D) or rabbit anti-DIC antibody alone (E). (AE) Striatal cells containing signals of fluorescent puncta (red) are imaged with differential interference contrast (Nomarski) showing the morphology of soma and neurites (white). (F and G) Quantification of PLA fluorescent puncta in Foxp2 WT and KO group. Cultured striatal cells in each group were prepared from at least four litters of P0 newborn mice. (H and I) Photomicrographs of double immunostaining of DCTN1 and DIC in cultured striatal neurons of Foxp2 WT and KO mice shown with maximal intensity projection of STED images on the z-axis. (H′ and I′) High-magnification images of the regions marked with squares in H and I. (H′ and I′) Images of immunoreactive particles in H′ and I′ were processed by the Spots module of Imaris. Scale bars = 5 µm in A and B; 2 µm in H, I, H′ and I′. High magnification images of H′, I′, H′′ and I′′ are shown at the bottom. Arrows and arrowheads indicate DCTN1-immunoreactive particles that are adjacent and non-adjacent to DIC-immunoreactive particles, respectively. (J) The cumulative plot of the association index. The association index is the number of particles with a DIC-Dctn1 distance less than or equal to every interval (10 nm) normalized to the total number of analysed DCTN1 particles. The association index was decreased in Foxp2 KO striatal neurons (n = 6 cells/group from two independent experiments). (K and L) The sucrose gradient sedimentation experiment shows that in Foxp2 WT neurons, peak signals of DCTN1, DCTN2 and ACTR1A proteins were detected in Fractions 7 and 8 (K). In Foxp2 KO neurons, abnormal patterns of dynein-dynactin protein components were found across different fractions compared with that of WT neurons (L). (MP) Quantitative analysis. *P < 0.05, **P < 0.01 and ***P < 0.001. Mann-Whitney-U test is used in F and G. Two-way ANOVA is used in J. Student's t-test is used in MP. Data-points with median ± interquartile range are shown in F and G. Data are mean ± SEM in J. Data-points are shown with symbols and the means of each fraction are plotted as connected lines in MP.
Figure 5
Figure 5
Dctn1 knockdown rescues impaired neurite outgrowth of Foxp2 KO striatal neurons in vitro. (A and C) Neurite outgrowth was decreased in cultured Foxp2 KO striatal neurons (C) compared with Foxp2 WT striatal neurons (A). (B and D) Dctn1 knockdown significantly increased neurite outgrowth of Foxp2 KO striatal neurons (D). (E) Neurite complexity was analysed by Sholl analysis. The somata of analysed neurons were placed at the centre of concentric circles with the arithmetic progression of radius. (F) The number of neurites that intersected the circles was counted at different radii. The blue and ivory colour shedding indicate the quantification at the proximal (0–50 μm) and distal neurites (50–100 μm), respectively. (GJ) The reductions in the neurite lengths (G), the length of longest neurite (H), the number of branch points (I) and the number of terminal points (J) in Foxp2 KO neurons were reversed by Dctn1 knockdown. Two independent experiments from at least two litters for each experiment were performed. *P < 0.05, **P < 0.01, ***P < 0.001. Two-way ANOVA with Tukey's HSD post hoc test was used in F. Kruskal–Wallis one-way ANOVA followed by Dunn's pairwise multiple comparisons test are used in GJ. Data are mean ± SEM in F and median ± interquartile range in GJ.
Figure 6
Figure 6
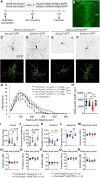
Dctn1 knockdown recovers dendritic arborization of striatal neurons in vivo and partially rescues the USV function of Foxp2 cKO mice. (A) The flow chart of the experiment. (B) Microinjection site of viruses in the neonatal striatum. (CF) Dendritic arborization was decreased in Drd1a-Cre;Foxp2fl/fl cKO striatal neurons (C) compared with Drd1a-Cre;Foxp2+/+ control mice (A). Dctn1 knockdown rescues dendritic arborization of Foxp2 cKO striatal neurons (D). The numbers of intersections are higher with warm colours. (G) Sholl analysis of dendritic complexity. The heatmap of each neuron represents a 3D volumetric colour rendering of the image stack while each new path segment is traced. (H) The reductions in dendritic lengths were rescued by Dctn1 knockdown in Drd1a-Cre;Foxp2fl/fl cKO neurons. (IR) Dctn1 knockdown rescued the impairments in the number of events (G), frequency jump (H) and duration (I) of USV features in Drd1a-Cre;Foxp2fl/fl cKO mice. *P < 0.05, **P < 0.01, ***P < 0.001. Two-way ANOVA with Tukey's HSD post hoc test for G. Kruskal–Wallis one-way ANOVA followed by Dunn's pairwise multiple comparisons test was used in H. One-way ANOVA with Tukey's HSD post hoc test for IR. Data are mean ± SEM in G and IR, and median ± interquartile range in H. Cx = cortex; Sep = septum.
Figure 7
Figure 7
FOXP2R553H mutation impairs intracellular endosome transport and neurite outgrowth of striatal neurons, which is rescued by the knockdown of Dctn1. (A) The flow chart of the experiment in EH. (BE) Time-lapse video microscopy showing trafficking of TrkB-RFP endosomes in dendrites of cultured striatal neurons. The kymographs show trajectories of TrkB-RFP vesicles during a 3-min recording. Triangles with the same colours indicate the positions of the same vesicles in the dendrite. The distance and speed of TrkB-RFP vesicles were reduced in FOXP2R553H-expressing neurons (D) compared with control FOXP2WT-expressing neurons (B). The abnormalities of TrkB-RFP-labelled vesicle transport were rescued by knocking down Dctn1 in FOXP2R553H-expressing neurons (E). (B′E′) Kymographs generated from time-lapse video microscopy of trajectories of TrkB-mRFP vesicles for 180 s. (F and G) Quantitative analysis of TrkB-RFP endosome transport. Cultured cells in each group were prepared from at least four litters of P0 neonatal mice. (H) The flow chart of the experiment in IN. (IK) The dendritic complexity (J) and total lengths (K) were reduced in FOXP2R553H-expressing striatal neurons (I′) compared with FOXP2WT-expressing striatal neurons (I) in vivo. The heatmap of each neuron represents a 3D volumetric colour rendering of the image stack while each new path segment is traced. (LN) The reductions in dendritic arborization (M) and total lengths (N) were rescued in shDctn1;FOXP2R553H-expressing striatal neurons (L′) compared with control shLacZ;FOXP2R553H-expressing striatal neurons (L) in vivo. *,#P < 0.05, **,##P < 0.01, ***,###P < 0.001. One-way ANOVA with Tukey's HSD post hoc test was used in FG. Two-way ANOVA with Tukey's HSD post hoc test was used in J and M. Significant differences between groups in J and M were quantified by the simple main effect of two-way ANOVA. Student's t-test was used in K and N. Data are mean ± SEM.
Figure 8
Figure 8
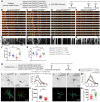
Dctn1 knockdown restores dendritic arborization of striatal neurons and concomitantly partially rescues vocalization in a mouse model of FOXP2R553H mutation. (A) The flow chart of the experiment. (BD) Dendritic arborization (C) and total lengths (D) were decreased in striatal neurons of shLacZ;FOXP2R553H-infected Foxp2H/− mice (B′) compared with control shLacZ;FOXP2WT-infected Foxp2H/− mice (B). The dendritic reductions were reversed by Dctn1 knockdown (B′). The heat map of each neuron represents a 3D volumetric colour rendering of the image stack while each new path segment is traced. (E) Whole cell patch-clamp electrophysiological shows that the frequency, but not amplitude, of mEPSCs was reduced in striatal neurons of shLacZ;FOXP2R553H-infected Foxp2H/− mice. Knocking down Dctn1 in FOXP2R553H-expressing neurons reverses the decreased mEPSC frequency. (FK) The events, frequency jump and duration of USV features were reduced in shLacZ;FOXP2R553H-infected Foxp2H/− mice compared with shLacZ;FOXP2WT-infected Foxp2H/− mice at P8. Decreased USV events in shLacZ;FOXP2R553H-infected Foxp2H/− mice were reversed in shDctn1;FOXP2R553H-infected mice. (L) Schematic drawings summarize the major findings in the present study. *,#,†P < 0.05, **,##,††P < 0.01, ***,###,†††P < 0.001. In C, asterisk indicates the significant difference between Foxp2H/;shLacZ;FOXP2WT and Foxp2H/;shLacZ;FOXP2R553H groups; number sign indicates the significant difference between Foxp2H/;shLacZ;FOXP2R553H and Foxp2H/;shDctn1;FOXP2R553H groups; dagger indicates the significant difference between Foxp2H/;shLacZ;FOXP2WT and Foxp2H/;shDctn1;FOXP2R553H groups. One-way ANOVA with Tukey's HSD post hoc test was used in D, G, H and J. Two-way ANOVA with Tukey's HSD post hoc test were used in C. Significant differences between groups in C were tested by the simple main effect of two-way ANOVA. Kruskal–Wallis one-way ANOVA followed by Dunn's pairwise multiple comparisons test was used in E, F and I. Data are mean ± SEM in C, D, G, H and J, and median ± interquartile range in E, F and I.

Similar articles

Cited by

References

    1. Vargha-Khadem F, Watkins KE, Price CJ, et al. . Neural basis of an inherited speech and language disorder. Proc Natl Acad Sci USA. 1998;95:12695–12700. - PMC - PubMed
    1. Lai CS, Fisher SE, Hurst JA, Vargha-Khadem F, Monaco AP. A forkhead-domain gene is mutated in a severe speech and language disorder. Nature. 2001;413:519–523. - PubMed
    1. Reuter MS, Riess A, Moog U, et al. . FOXP2 Variants in 14 individuals with developmental speech and language disorders broaden the mutational and clinical spectrum. J Med Genet. 2017;54:64–72. - PubMed
    1. Liégeois FJ, Hildebrand MS, Bonthrone A, et al. . Early neuroimaging markers of FOXP2 intragenic deletion. Sci Rep. 2016;6:35192. - PMC - PubMed
    1. MacDermot KD, Bonora E, Sykes N, et al. . Identification of FOXP2 truncation as a novel cause of developmental speech and language deficits. Am J Hum Genet. 2005;76:1074–1080. - PMC - PubMed

Publication types

Substances