. 2023 May 4;14(1):2559.
doi: 10.1038/s41467-023-38101-8.

The Fgf/Erf/NCoR1/2 repressive axis controls trophoblast cell fate

Affiliations

The Fgf/Erf/NCoR1/2 repressive axis controls trophoblast cell fate

Andreas Lackner et al. Nat Commun. .

Abstract

Placental development relies on coordinated cell fate decisions governed by signalling inputs. However, little is known about how signalling cues are transformed into repressive mechanisms triggering lineage-specific transcriptional signatures. Here, we demonstrate that upon inhibition of the Fgf/Erk pathway in mouse trophoblast stem cells (TSCs), the Ets2 repressor factor (Erf) interacts with the Nuclear Receptor Co-Repressor Complex 1 and 2 (NCoR1/2) and recruits it to key trophoblast genes. Genetic ablation of Erf or Tbl1x (a component of the NCoR1/2 complex) abrogates the Erf/NCoR1/2 interaction. This leads to mis-expression of Erf/NCoR1/2 target genes, resulting in a TSC differentiation defect. Mechanistically, Erf regulates expression of these genes by recruiting the NCoR1/2 complex and decommissioning their H3K27ac-dependent enhancers. Our findings uncover how the Fgf/Erf/NCoR1/2 repressive axis governs cell fate and placental development, providing a paradigm for Fgf-mediated transcriptional control.


Conflict of interest statement

The authors declare no competing interests.

Figures

Fig. 1
Fig. 1. Erf interacts with NCoR1/2 complexes in differentiating TSCs.
a A diagram showing that trophoblast stem cells (TSCs) can be derived from the polar trophectoderm (pTE) and the extraembryonic ectoderm (ExE) of the mouse embryo and self-renew in the presence of Fgf. Treatment with the Mek inhibitor PD0325901 (PD) results in exiting self-renewal and their differentiation (DIFF.). b Phosphoproteomic analysis of TSCs treated for 1.5, 5, 15, and 30 min with 3 µM Mek inhibitor, compared to the untreated (0') and displayed as fold change. Analysis based on two biological replicates (n = 2). Representative clusters 5 and 9 are shown. Mapk1 and Mapk3 serve as positive controls. c Phosphorylation sites found in the Erf protein. Sites identified in our phosphoproteome dataset are depicted in black, those regulated are additionally bolded. Sites that were mutated in the phosphomutants are indicated in green (M5 construct) and red (M6 construct). d Confocal images (representative of two biological replicates n = 2) of Erf-KO cell lines carrying doxycycline (dox) inducible transgenes of Erf WT, M5 (S21A, S185A, S190A, S534A, S327A) and M6 (S161A, T529A, S246A, S251A, T357A, T148A) phospho-mutants cultured in SR conditions in the presence of (+d) dox. WT cells differentiated in PD serve as positive control. Erf in red, DAPI in inset in blue. e, f Erf interactomes identified by mass spectrometry after 3 h (e) and 24 h (f) PD treatment in differentiating TSCs expressing Erf-3xFlag and compared to an empty vector control line (n = 3, each). Erf is marked in red, components of the NCoR1/2 complex in blue. Each plot represents three biological replicates of the Erf-3xFlag (n = 3) and the empty vector (n = 3) pair. g, h Tbl1x interactomes identified by mass spectrometry after 3 h PD (g) and 48 h CM/Fgf withdrawal and CH treatment (h) in differentiating TSCs expressing Tbl1x-3xFlag and compared to an empty vector control line (n = 3, each). Erf is marked in red, components of the NCoR1/2 complex in blue. Each plot represents three biological replicates of the Tbl1x-3xFlag (n = 3) and the empty vector (n = 3) pair. i Endogenous Tbl1x immunoprecipitates analysed by Western blot with indicated antibodies. IgG serves as a negative control; SN: supernatant. Representative of three biological replicates (n = 3). j AlphaFold2-Multimer protein interaction plot for Erf as bait and NCoR1/2, SWI/SNF, NuRD complex components, and WD40 proteins showing the iPTM (interface) score for a likely interaction and the PTM (predicted TM) score reflecting the global predicted structure accuracy. k A diagram indicating that Erf interacts with the NCoR1/2 complex.
Fig. 2
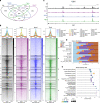
Fig. 2. Erf and NCoR1/2 complexes co-occupy target regions.
a Venn diagram depicting the overlap between regions bound by Erf, Ncor1, Ncor2, and Tbl1x as identified by ChIP-seq in TSCs treated for 24 h with PD. Based on IDR analysis of two biological replicates. Overlapping regions were merged. b Heat-map of the normalised ChIP-seq signal of Erf, Ncor1, Ncor2, and Tbl1x in regions defined by the peak overlap in (a). c Genome browser tracks of Erf, Tbl1x, Ncor1, and Ncor2 signal at the Fgfr2 locus in TSCs after 24 h of PD0325901 treatment. d Feature distribution of regions occupied and co-occupied by indicated factors. e KEGG Pathway enrichment analysis of genes co-bound by Erf and at least one of the Ncor1, Ncor2, and Tbl1x factors. Fisher’s exact test with Benjamini–Hochberg correction was used.
Fig. 3
Fig. 3. Erf recruits NCoR1/2 complexes to its target regions.
ac Heat maps of normalised Ncor1, Ncor2, and Tbl1x ChIP-seq signals in PD-specific, PD/SR-common, and SR-specific peaks for each factor, shown for WT, Erf-KO, and Erf-KO_rescue lines. dg MA plots of differentially enriched regions for Ncor1 (d), Ncor2 (e, g), and Tbl1x (f) in Erf-KO vs WT (df) and Erf-KO_rescue vs WT (g) TSCs. Log2 fold change is plotted as a function of the log normalised ChIP-seq read counts. Regions with an FDR < 0.5 are indicated in magenta. All regions bound by any factor (based on the IDR filtered peak-sets) were included in the analysis. h Boxplot of the log2 fold changes of Ncor1, Ncor2, and Tbl1x signals in groups determined by combinatorial changes. Regions with FDR < 0.5 for at least one of the three factors were included. Box boundaries show the 25th to 75th percentile with the median as centre and whiskers representing the calculated maximum and minimum. Outliers are depicted by the dots. i Heat maps of the Ncor1, Ncor2, and Tbl1x ChIP-seq signal in regions with specific or combinatorial reduction of Ncor1, Ncor2, and/or Tbl1x binding in differentiating Erf-KO TSCs (as shown in h), displayed in differentiating WT, Erf-KO, and Erf-KO_rescue lines. j Euler diagram depicting the overlap of ETNN regions and regions with concomitant loss of signal of Ncor1, Ncor2, and Tbl1x (TNN loss) in differentiating Erf-KO cells. k KEGG Pathway enrichment of genes associated with TNN loss regions in differentiating Erf-KO TSCs. Fisher’s exact test with Benjamini–Hochberg correction was used.
Fig. 4
Fig. 4. Erf/NCoR1/2 controls expression of key trophoblast genes.
a Principal component analysis (PCA) based on global gene expression (QuantSeq) in WT, Erf-KO, Erf-KO_rescue, Tbl1x-KO, and Tbl1x-KO_rescue lines in self-renewal (SR, triangle) and after 24 h of PD0325901 treatment (PD, circle). b MA plot of differentially expressed genes between Erf-KO (n = 4 biological replicates) and WT (n = 4 biological replicates) lines treated for 24 h with PD. Analysis (cut-off: |log2FC | >1, p adj < 0.05, Wald-test with Benjamini–Hochberg correction) revealed 719 upregulated and 661 down-regulated genes in Erf-KO lines compared to WT. Significantly up- (UP, red) and downregulated (DOWN, blue) genes are indicated in red and blue, respectively. NS: not significant, grey. Important trophoblast-related factors are labelled. c MA plot of differentially expressed genes between Tbl1x-KO (n = 4 biological replicates) and WT (n = 4 biological replicates) lines treated for 24 h with PD. Analysis (cut-off: |log2FC | >1, p adj < 0.05, Wald-test with Benjamini–Hochberg correction) revealed 526 upregulated (UP, red) and 389 down-regulated (DOWN, blue) genes in Erf-KO lines compared to WT. NS: not significant, grey. Important trophoblast-related factors are labelled. d Euler diagram showing the intersection of up- and down-regulated genes (cut-off: |log2FC | >1, p adj <0.05 compared to WT) in differentiating Erf-KO and Tbl1x-KO cells. e Upset plot depicting the overlap between ETNN target genes, genes that were upregulated (red) and downregulated (blue) in Erf-KO and Tbl1x-KO lines after 24 h PD treatment and genes that were upregulated or down-regulated during wild-type differentiation (based on QuantSeq analysis). Groups of genes that are conversely regulated in WT and KOs are indicated as green lines in the matrix. f Fractions of cell type signatures found in deconvoluted bulk QuantSeq data of WT, Erf-KO, and Erf-KO_Rescue cells in SR, 24 h PD, and 48 h Fgf/CM withdrawal+CH based on a snRNAseq reference dataset from Marsh and Belloch. The mean fraction (n = 4 biological replicates) is shown on the y-axis. g PCA based on global gene expression (QuantSeq) in WT, Erf-KO, Erf-KO_rescue, Tbl1x-KO, and Tbl1x-KO_rescue lines along a time course of Fgf/CM withdrawal (WD) for 6 days. d0: circle; d2: triangle; d4: square; d6: cross. h Heatmap showing the expression (Z-score) of previously identified markers,,– of placental cell types in WT cells and in Erf-KO cells along the differentiation time course of Fgf/CM withdrawal for 6 days, clustered by row and column. ETNN targets marked in bold. i Aggregated gene expression (n = 3 biological replicates) in WT and Erf-KO cells during a 6-day WD differentiation time course of the 4 clusters identified by hierarchical clustering of the 3000 top variance genes (in WT WD and PD). Box boundaries show the 25th to 75th percentile with the median as centre and whiskers representing the calculated maximum and minimum. Outliers are depicted by the dots. j Gene ontology overrepresentation analysis of the 4 clusters (from i) identified by hierarchical clustering of the 3000 top variance genes. k Boxplots showing the log2 fold changes of the 4 clusters (from i) separated by ETNN and non-ETNN targets in differentiating Erf-KO compared to WT cells at d2 of WD (n = 3 biological replicates) and 24 h PD treatment (n = 4 biological replicates). P-values of the Wilcoxon test are indicated. Box boundaries show the 25th to 75th percentile with the median as centre and whiskers representing the calculated maximum and minimum. Outliers are depicted by the dots.
Fig. 5
Fig. 5. Erf depletion affects H3K27ac on target genes during differentiation.
a MA-plot showing differentially trimethylated H3K4 on ETNN regions in differentiated Erf-KO TSCs (n = 2 biological replicates) compared to WT TSCs. Significant regions are indicated in pink (cut-off: |log2FC | >1, p adj < 0.05, Wald-test with Benjamini–Hochberg correction). b MA-plot showing differentially acetylated H3K27 on ETNN regions in differentiated Erf-KO TSCs (n = 2 biological replicates) compared to WT TSCs. Significant regions are indicated in pink (cut-off: |log2FC | >1, p adj < 0.05, Wald-test with Benjamini–Hochberg correction). c, d Correlation of differential gene expression and significant changes of H3K4me3 (c) and H3K27ac (d) in differentiated Erf-KO versus WT cells. Error bars indicate the 95% confidence limit of the linear regression model. Spearman correlation coefficient and p-value are indicated. e, f Correlation of differential gene expression and significant changes of H3K4me3 (e) and H3K27ac (f) on ETNN-bound promoter regions in differentiated Erf-KO versus WT cells. Error bars indicate the 95% confidence limit of the linear regression model. Spearman correlation coefficient and p-value are indicated. g, h Correlation of differential gene expression and significant changes of H3K4me3 (g) and H3K27ac (h) on ETNN-bound regulatory regions in differentiated Erf-KO versus WT cells. Error bars indicate the 95% confidence limit of the linear regression model. Spearman correlation coefficient and p-value are indicated. i Intersection of ETNN targets that are upregulated in Erf-KO with the respective significant changes in H3K4me3 and H3K27ac. j Intersection of ETNN targets that are downregulated in Erf-KO with the respective significant changes in H3K4me3 and H3K27ac.
Fig. 6
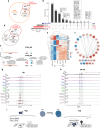
Fig. 6. Erf/NCoR1/2 regulates key super enhancers during TSC differentiation.
a Overlap of genes associated with enhancers (ALL_enhancers) including super enhancers (SEs) found in self-renewing and differentiating WT TSCs with genes that are deregulated in differentiating Erf-KO cells. b Overlap of genes associated with ETNN bound enhancers (ETNN_ALL_enhancers) including SEs (ETNN_SEs) found in self-renewing and differentiating WT TSCs with genes that are deregulated in differentiating Erf-KO cells. c Overrepresentation analysis of genes deregulated in differentiating Erf-KO and associated with ETNN_REs (top) and ETNN_SEs (bottom). Enrichment of GOMF, KEGG and WP database terms was measured by gProfiler2. Multiple testing was done with the internal gSCS algorithm. Only significant terms (padj ≤ 0.05) are shown. d Upset plot depicting intersections between genes associated with the ETNN_REs, genes associated with the ETNN_SEs, genes deregulated in differentiating Erf-KO and genes of TFs identified by Lee et al.. e Heatmap of Z-score based on mean variance stabilised counts (n = 4) of the 31 ETNN_SE-associated TFs shared between this study and Lee et al. during differentiation induced by PD treatment. f Minimal Erf/Ncor1/2-targeted trophoblast TF network as determined by protein-protein interactions found in the STRING database. Colour scale indicates mean LFC of expression in PD treated differentiating Erf-KO compared to differentiating WT TSCs (blue, downregulated; red, upregulated, n = 4). g, h Genome browser tracks of Erf, Ncor1, Ncor2, Tbl1x, H3K4me3, and H3K27ac signal at the ETNN_SE-associated Esrrb locus in WT and Erf-KO cells in (g) self-renewing (SR) and (h) differentiating (PD) TSCs. i Model of Erf/NCor1/2 function in differentiating TSCs. In self-renewing TSCs, Fgf signalling leads to phosphorylation of Erf and its cytoplasmic location and expression of TSC SR marker genes. Upon abrogation of Fgf signalling, the unphosphorylated nuclear Erf recruits the NCoR1/2 complex to super enhancers (SEs) of TSC genes causing their transcriptional silencing and TSC differentiation. N:nucleus, C:cytoplasm.

Similar articles

Cited by

References

    1. Latos PA, Hemberger M. From the stem of the placental tree: trophoblast stem cells and their progeny. Development. 2016;143:3650–3660. doi: 10.1242/dev.133462. - DOI - PubMed
    1. Arman E, Haffner-Krausz R, Chen Y, Heath JK, Lonai P. Targeted disruption of fibroblast growth factor (FGF) receptor 2 suggests a role for FGF signaling in pregastrulation mammalian development. Proc. Natl Acad. Sci. USA. 1998;95:5082–5087. doi: 10.1073/pnas.95.9.5082. - DOI - PMC - PubMed
    1. Bissonauth V, Roy S, Gravel M, Guillemette S, Charron J. Requirement for Map2k1 (Mek1) in extra-embryonic ectoderm during placentogenesis. Development. 2006;133:3429–3440. doi: 10.1242/dev.02526. - DOI - PubMed
    1. Saba-El-Leil MK, et al. An essential function of the mitogen-activated protein kinase Erk2 in mouse trophoblast development. EMBO Rep. 2003;4:964–968. doi: 10.1038/sj.embor.embor939. - DOI - PMC - PubMed
    1. Tanaka S, Kunath T, Hadjantonakis AK, Nagy A, Rossant J. Promotion of trophoblast stem cell proliferation by FGF4. Science. 1998;282:2072–2075. doi: 10.1126/science.282.5396.2072. - DOI - PubMed

Publication types

Substances