. 2023 May 3;14(1):2554.
doi: 10.1038/s41467-023-37903-0.

A blueprint for a synthetic genetic feedback optimizer

Affiliations

A blueprint for a synthetic genetic feedback optimizer

Andras Gyorgy et al. Nat Commun. .

Abstract

Biomolecular control enables leveraging cells as biomanufacturing factories. Despite recent advancements, we currently lack genetically encoded modules that can be deployed to dynamically fine-tune and optimize cellular performance. Here, we address this shortcoming by presenting the blueprint of a genetic feedback module to optimize a broadly defined performance metric by adjusting the production and decay rate of a (set of) regulator species. We demonstrate that the optimizer can be implemented by combining available synthetic biology parts and components, and that it can be readily integrated with existing pathways and genetically encoded biosensors to ensure its successful deployment in a variety of settings. We further illustrate that the optimizer successfully locates and tracks the optimum in diverse contexts when relying on mass action kinetics-based dynamics and parameter values typical in Escherichia coli.


Conflict of interest statement

The authors declare no competing interests.

Figures

Fig. 1
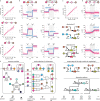
Fig. 1. Genetic optimizers can ensure maximal cellular performance.
Simulation parameters and further details are provided in Supplementary Section 5. a Population-level production of a target gene is maximized when growth rate and cellular synthesis rate are balanced. The corresponding optimal concentration of a regulator may depend on both cellular and environmental conditions, and can be automatically adjusted by a genetic optimizer. b Gradient-based optimization can successfully track the time-varying optimum, but cannot be immediately translated to a genetic circuit because it may result in infeasible negative quantities. Decreasing ϵx yields faster convergence at the expense of greater control inputs u1 and u2. c Calculating u1 and u2 based on the trend of x and y ensures convergence to the optimum x*. In the four panels at right, ϵy increases by an order of magnitude going from left to right (leading to slower y dynamics), and the delay td increases by an order of magnitude going from top to bottom.
Fig. 2
Fig. 2. The delay module ensures tracking of the regulator and the reporter signals.
Light, medium, and dark red correspond to ϵd = ϵy/2, ϵd = ϵy, and ϵd = 2ϵy, respectively. The panel in the top left corner corresponds to ϵy = ϵx/100, and ϵy increases towards the lower right panel where ϵy = ϵx/10 (sample points are spaced equidistantly on a logarithmic scale). Simulation parameters and further details are provided in Supplementary Section 5.
Fig. 3
Fig. 3. The comparator module generates the indicator signals based on the actual and delayed signals for both the regulator and the reporter.
Simulation parameters and further details are provided in Supplementary Section 5. a The signal c alternates between two states (c = 0 and c = 1) with period τ, activating two different sets of regulatory interactions. b During phase 1, (x+, x) tracks the reference (x, xd), whereas during phase 2, (x+, x) converges to either of the stable fixed points based on the sign of x − xd. c The signals x+ and x switch between their ON and OFF states depending on whether x < xd or x > xd (phase 1 is depicted in gray). d Closed loop performance is largely unaffected by the value of αc,2.
Fig. 4
Fig. 4. The logic module combines the indicator signals to generate the control signals.
The dynamic range of the signals in the input, middle (between the AND and OR gates), and output layer of the logic module is denoted by ρ, ρ, and ρu, respectively. While selecting the dissociation constants K and K in the geometric mean of the respective dynamic ranges may be an intuitive choice (yielding the dark gray lines), the performance of the optimizer displays significant robustness to deviations from this particular baseline choice when tracking the optimum value x* (blue). Colored circles correspond to different choices of αc,2 (affecting the input dynamic range ρ), together with substantial perturbations in the dissociation constants compared to the above specified baseline choice. Simulation parameters and further details are provided in Supplementary Section 5.
Fig. 5
Fig. 5. Closed loop performance and accuracy with the simplified dynamics.
Simulation parameters and further details are provided in Supplementary Section 5. a In the absence of additive noise (dark red and dark green), trajectories are confined within the gray region around the time-varying optimum x* (blue) when ϵy = 0 (Supplementary Section 1.5). In the presence of stochastic noise (light red and light green), closed loop trajectories may temporarily leave this region. The value of ϵd is 10-times greater for (light and dark) green than for (light and dark) red. b Performance decreases as the tracking error in the delay module increases. c Shaded regions correspond to initial conditions such that trajectories converge to an incorrect stable fixed point.
Fig. 6
Fig. 6. Genetic layout of the optimizer module.
The realization relies on genetic parts and modules that are already available, in particular: (i) protein-based transcriptional control; (ii) inducible degradation via the M. florum Lon protease and ssrA tag,; (iii) a repressilator-based oscillator,; (iv) CRISPRi-based toggle switches; and (v) STAR-based logic gates,. The mass action kinetics-based mathematical model underpinning the dynamics of the integrated system is included in Supplementary Section 2.1, together with detailed discussion of the typical range of model parameters in Supplementary Section 2.2, and their selected values in Supplementary Table 1. Here, we assume that the host genome is already equipped with a dCas9 expression cassette, otherwise the optimizer must also include it.
Fig. 7
Fig. 7. The genetic optimizer can be successfully deployed in diverse contexts.
Detailed mathematical models and additional data are provided in Supplementary Section 3, together with simulation parameters in Supplementary Section 5. In a, c, mean and error bars denote the average of x and its standard deviation, averaged over 100 independent simulations with randomly selected initial conditions. In b, d, thin red curves correspond to 30 independent closed loop trajectories with random initial points. a The optimizer locates the static optimum. b The optimizer tracks the time-varying optimum (blue) as parameters fluctuate (indicated by the arrowheads). c The expression of y~ can be maximized by minimizing y. d The optimizer tracks the time-varying optimum (blue) even when y is regulated by multiple species. The thick red curves denote the average of 30 independent simulations. e Genetic layout of the multi-dimensional optimizer re-using and modifying the modules originally featured in Fig. 6.
Fig. 8
Fig. 8. The genetic optimizer can be deployed to maximize cellular growth rate.
Detailed mathematical model and additional data are provided in Supplementary Section 3, together with simulation parameters in Supplementary Section 5. Blue curves indicate performance when SpoTH is exogenously optimized by adjusting the inducer concentration. Green and purple curves denote trajectories with zero and maximal induction of SpoTH. Closed loop performance is evaluated in the presence of stochastic noise impacting the kinetics of all species. Cellular stress is modulated via βp. a Growth rate is negatively impacted by rising levels of the alarmone (p)ppGpp (p) as it downregulates the production of ribosomes (z). Cellular stress results in elevated RelA (r) expression, which upregulates the synthesis of (p)ppGpp via the increased production rate constant βp. Conversely, (p)ppGpp concentration can be decreased via SpoTH (s) by activating its expression either exogenously or by placing its promoter under the control of the regulator x. The dashed red flat headed arrows from SpoTH represent the load that SpoTH expression places on ribosomes as its mRNA is translated. b Expression of SpoTH results in sequestration of shared cellular resources, thus the metabolic burden due to SpoTH overexpression can counteract the positive impact of (p)ppGpp removal on growth rate, resulting in a non-monotonic relationship. c Closed loop performance is evaluated based on 100 independent simulations with random initial conditions during the second half of each simulation by considering the average of y and its standard deviation. Red curve and red shaded region denote the mean of these averages and standard deviations, respectively. d The optimizer successfully tracks the time-varying optimum in response to both abrupt and gradual changes in βp representing cellular stress. Red curves and shaded regions correspond to the mean and standard deviation of trajectories considering 100 independent simulations with random initial conditions. For individual trajectories, see Supplementary Fig. 17.

References

    1. Csete M, Doyle J. Reverse engineering of biological complexity. Science. 2002;295:1664–1669. doi: 10.1126/science.1069981. - DOI - PubMed
    1. Purnick PEM, Weiss R. The second wave of synthetic biology: from modules to systems. Nat. Rev. Mol. Cell Biol. 2009;10:410–422. doi: 10.1038/nrm2698. - DOI - PubMed
    1. Del Vecchio, D., Dy, A. J. & Qian, Y. Control theory meets synthetic biology. J. R. Soc. Interface13, 20160380 (2016). - PMC - PubMed
    1. Brophy JAN, Voigt CA. Principles of genetic circuit design. Nat. Methods. 2014;11:508–520. doi: 10.1038/nmeth.2926. - DOI - PMC - PubMed
    1. Smanski MJ, et al. Functional optimization of gene clusters by combinatorial design and assembly. Nat. Biotechnol. 2014;32:1241–1249. doi: 10.1038/nbt.3063. - DOI - PubMed

Publication types