. 2023 May 3;14(1):2533.
doi: 10.1038/s41467-023-38148-7.

Identification of biomarkers for glycaemic deterioration in type 2 diabetes

Roderick C Slieker #  1   2 Louise A Donnelly #  3 Elina Akalestou #  4 Livia Lopez-Noriega  4 Rana Melhem  5 Ayşim Güneş  6 Frederic Abou Azar  5 Alexander Efanov  7 Eleni Georgiadou  4 Hermine Muniangi-Muhitu  4 Mahsa Sheikh  4 Giuseppe N Giordano  8 Mikael Åkerlund  8 Emma Ahlqvist  8 Ashfaq Ali  9 Karina Banasik  10 Søren Brunak  10 Marko Barovic  11 Gerard A Bouland  2 Frédéric Burdet  12 Mickaël Canouil  13 Iulian Dragan  12 Petra J M Elders  14 Celine Fernandez  8 Andreas Festa  15   16 Hugo Fitipaldi  8 Phillippe Froguel  13   17 Valborg Gudmundsdottir  18   19 Vilmundur Gudnason  18   19 Mathias J Gerl  20 Amber A van der Heijden  14 Lori L Jennings  21 Michael K Hansen  22 Min Kim  9   23 Isabelle Leclerc  4   5 Christian Klose  20 Dmitry Kuznetsov  12 Dina Mansour Aly  8 Florence Mehl  12 Diana Marek  12 Olle Melander  8 Anne Niknejad  12 Filip Ottosson  8   24 Imre Pavo  15 Kevin Duffin  7 Samreen K Syed  7 Janice L Shaw  7 Over Cabrera  7 Timothy J Pullen  4   25 Kai Simons  20 Michele Solimena  11   26 Tommi Suvitaival  9 Asger Wretlind  9 Peter Rossing  9   27 Valeriya Lyssenko  28   29 Cristina Legido Quigley  9   23 Leif Groop  8   30 Bernard Thorens  31 Paul W Franks  8   32 Gareth E Lim  5 Jennifer Estall  6 Mark Ibberson  12 Joline W J Beulens  1   33 Leen M 't Hart  34   35   36 Ewan R Pearson  37 Guy A Rutter  38   39   40
Affiliations

Identification of biomarkers for glycaemic deterioration in type 2 diabetes

Roderick C Slieker et al. Nat Commun. .

Abstract

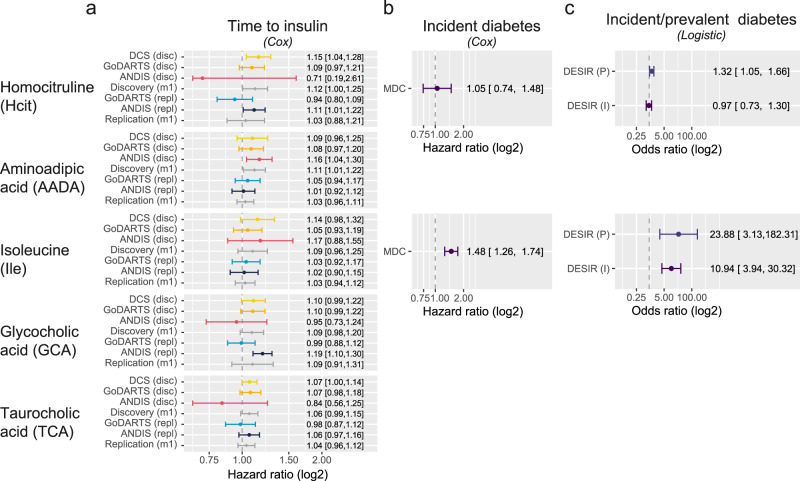
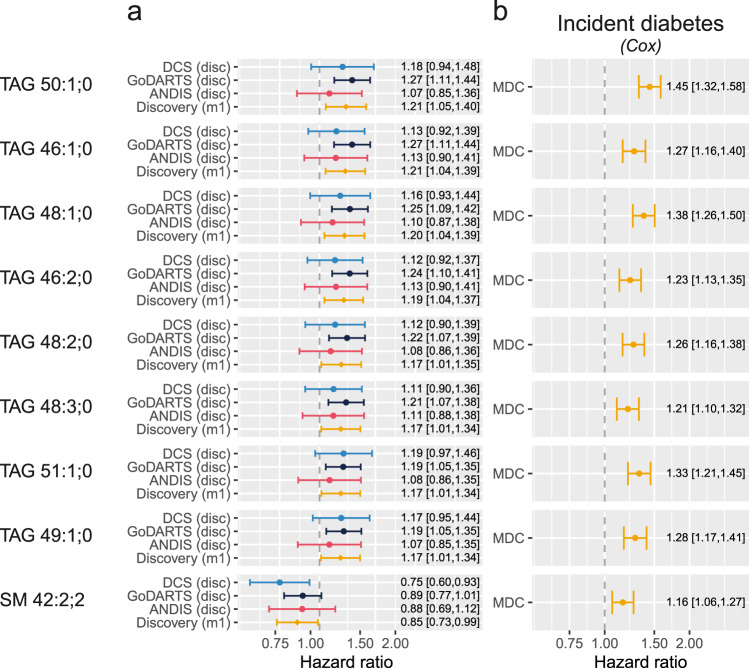
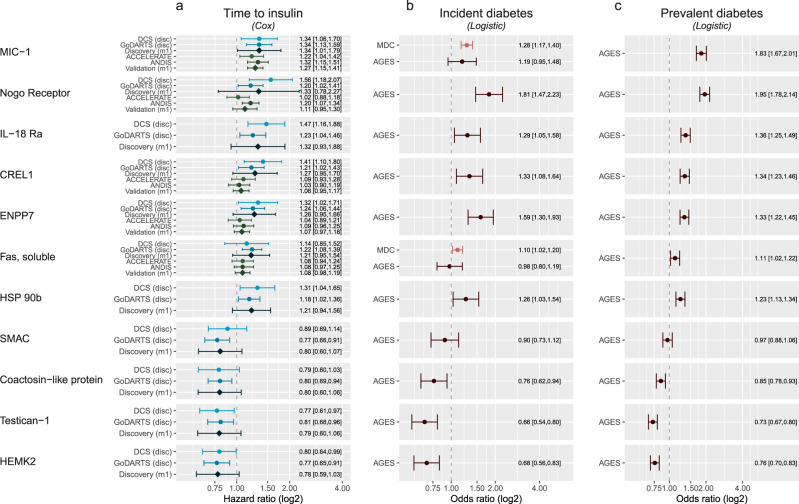
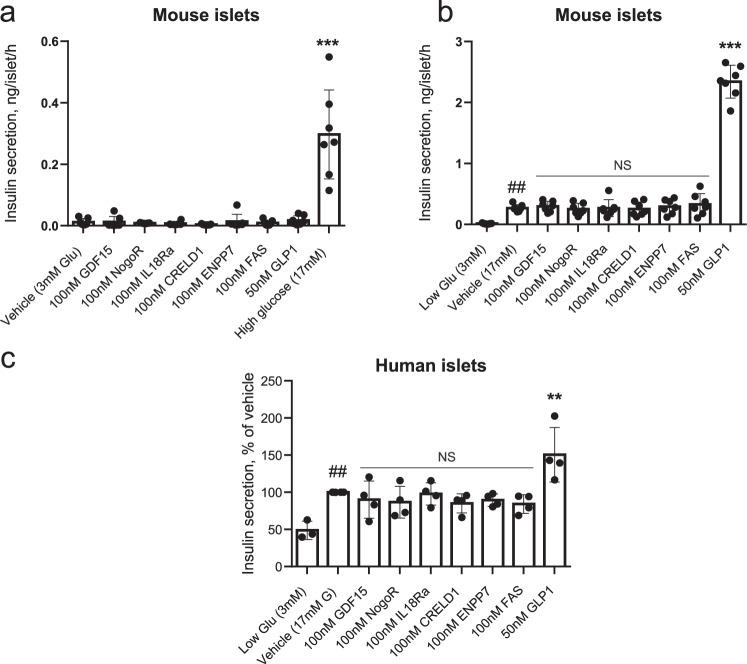
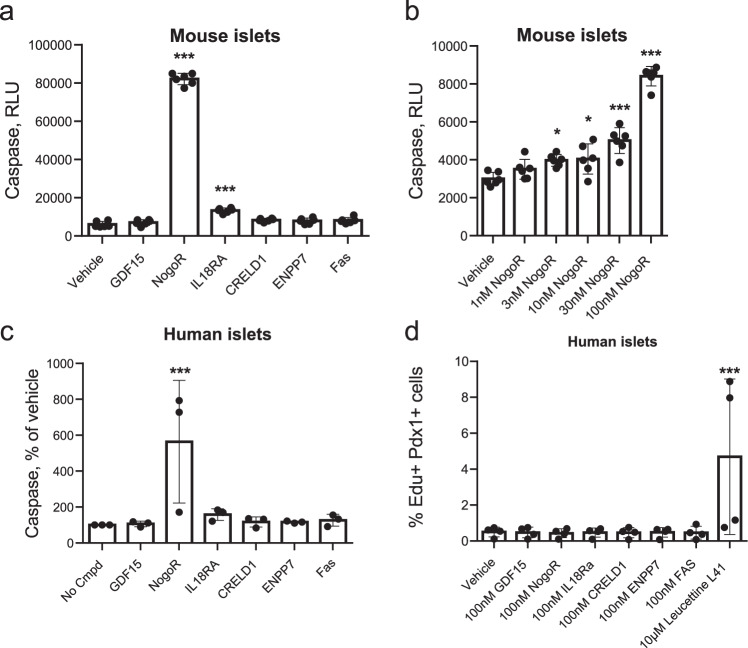
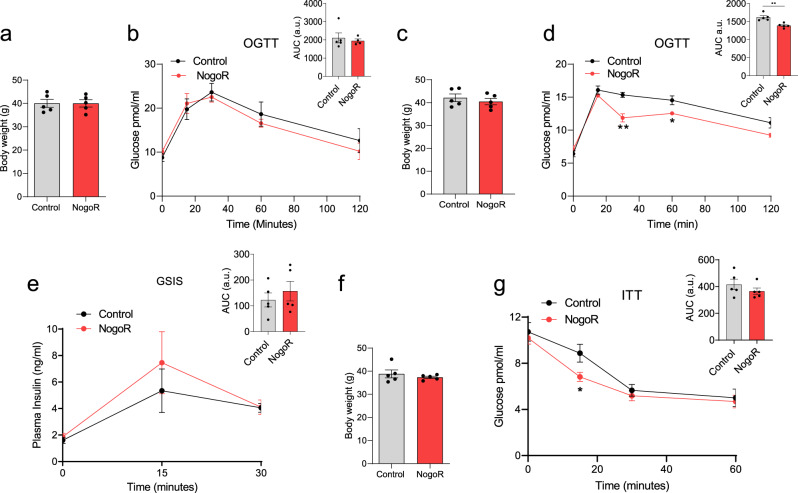
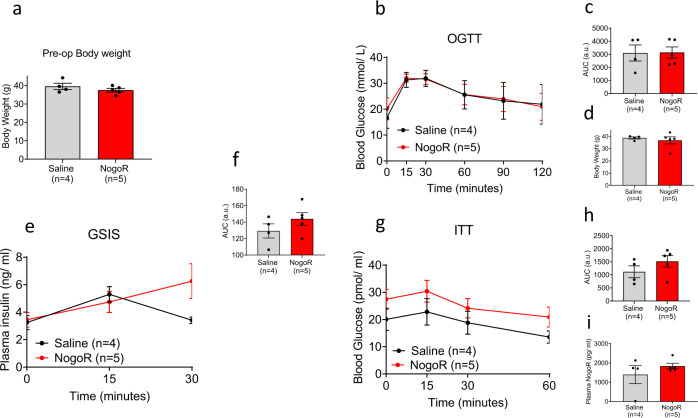
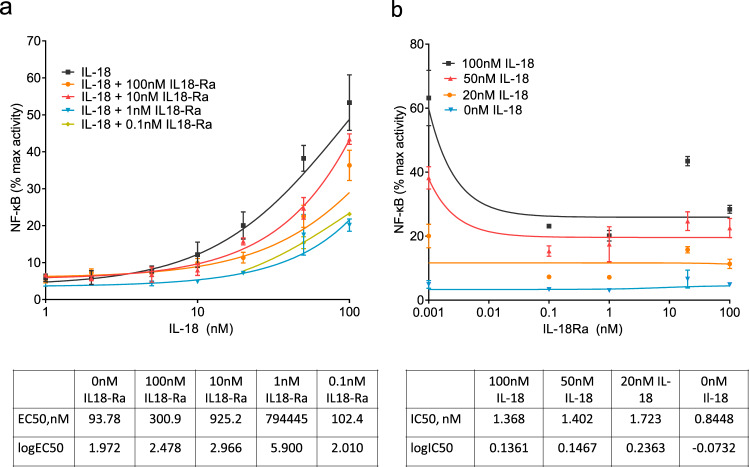
We identify biomarkers for disease progression in three type 2 diabetes cohorts encompassing 2,973 individuals across three molecular classes, metabolites, lipids and proteins. Homocitrulline, isoleucine and 2-aminoadipic acid, eight triacylglycerol species, and lowered sphingomyelin 42:2;2 levels are predictive of faster progression towards insulin requirement. Of ~1,300 proteins examined in two cohorts, levels of GDF15/MIC-1, IL-18Ra, CRELD1, NogoR, FAS, and ENPP7 are associated with faster progression, whilst SMAC/DIABLO, SPOCK1 and HEMK2 predict lower progression rates. In an external replication, proteins and lipids are associated with diabetes incidence and prevalence. NogoR/RTN4R injection improved glucose tolerance in high fat-fed male mice but impaired it in male db/db mice. High NogoR levels led to islet cell apoptosis, and IL-18R antagonised inflammatory IL-18 signalling towards nuclear factor kappa-B in vitro. This comprehensive, multi-disciplinary approach thus identifies biomarkers with potential prognostic utility, provides evidence for possible disease mechanisms, and identifies potential therapeutic avenues to slow diabetes progression.


Conflict of interest statement

K.S. is the CEO of Lipotype GmbH. K.S. and C.K. are shareholders of Lipotype GmbH. M.J.G. is employee of Lipotype GmbH. GAR has received grant funding and consultancy fees from Sun Pharmaceuticals and Les Laboratoires Servier. M.K.H. is an employee of Janssen Research & Development, LLC. A.F. and I.P. are employees of Eli Lilly Regional Operations GmbH. The AGES-Reykjavik proteomics study was supported by the Novartis Institute for Biomedical Research, and protein measurements for the AGES-Reykjavik cohort were performed at SomaLogic. L.L.J. is an employee and stockholder of Novartis. PR (Peter Rossing) has received honoraria to Steno Diabetes Center Copenhagen for consultancy and teaching from Astellas, Astra Zeneca, Boehringer Ingelheim, Bayer, Novo Nordisk, Sanofi, Gilead and Vifor and research grants from Novo Nordisk and Astra Zeneca. The remaining authors declare no competing interests.

Figures

Fig. 1
Fig. 1. Metabolites associated with diabetes development and progression.
a Hazards of a time to insulin model in the three discovery cohorts plus two replication sets in two of three discovery  cohorts and their respective meta-analyses (Model 1). The figure shows the five nominally significant metabolites, with Hcit and AADA being also significant after multiple testing. Data are presented as hazard ratios with 95% confidence intervals. N = 1,267 individuals for DCS, n = 897 individuals for GoDARTS discovery, n = 699 individuals for GoDARTS validation, n = 811 individuals for ANDIS discovery, n = 1969 individuals for ANDIS validation. b Hazards of incident diabetes in MDC based on a Cox proportional hazards model adjusted for age, sex, and BMI. Data are presented as hazard ratios with 95% confidence intervals. N = 3423 individuals c Odds ratios of incident and prevalent diabetes in DESIR based on a logistic regression model adjusted for age, sex and BMI. Data are presented as odds ratios with 95% confidence intervals. N = 1087 individuals for DESIR.
Fig. 2
Fig. 2. Lipids associated with diabetes development and progression.
a Hazards of a time to insulin model in the three discovery cohorts and the meta-analysed hazards (Model 1). The figure shows the nine significant lipids after multiple testing. Data are presented as hazard ratios with 95% confidence intervals. N = 900 individuals for DCS, n = 899 individuals for GoDARTS, n = 809 for ANDIS. b Hazard models of incident diabetes in MDC based on a Cox proportional hazards model. Data are presented as hazard ratios with 95% confidence intervals. N = 3667 individuals.
Fig. 3
Fig. 3. Proteins in plasma or serum associated with time to insulin requirement.
a Top proteins associated with time to insulin requirement. Shown is the top 10 based on P-value plus Nogo receptor, which showed the largest risk of the top hundred proteins. X-axis, hazard ratio on a log2 scale and studies on the y-axis. Data are presented as hazard ratios with 95% confidence intervals. N = 589 individuals for DCS, n = 899 individuals for GoDARTS, n = 1992 individuals for ANDIS validation, n = 1850 individuals for ACCELERATE validation. b Association between protein levels and incident diabetes. X-axis, odds ratio on a log2 scale. Data are presented as odds ratios with 95% confidence intervals. N = 4915 individuals for MDC-CC and n = 5438 individuals for AGES. c Association between protein levels and prevalent diabetes. X-axis, odds ratio on a log2 scale. Data are presented as odds ratios with 95% confidence intervals. N = 5438 individuals for AGES.
Fig. 4
Fig. 4. Impact of identified biomarkers on insulin secretion from mouse (a, b) and human (c) islets.
Incubations were performed for 30 min. at the indicated concentrations of glucose, and secreted insulin measured using an electrochemiluminescence assay. a ***p = 3.19·10-14 for the effects of 17 mM vs 3 mM glucose. b ##p = 0.0074 for the effects of 17 mM vs 3 mM glucose and ***p < 2.2·10-16 for the effects of 50 nM GLP-1 vs 17 mM glucose. c **p = 0.0053 for the effects of 50 nM GLP-1 vs 17 mM glucose and ##p = 0.0097 for the effects of 17 vs 3 mM glucose. Comparisons by one-way ANOVA in each case. Data points n = 7 replicates per treatment using islets from 16 mice (a, b) or those from individual human subjects (n = 4; c). Error bars represent means ± S.D. Other details are given in the Methods Section. Source data are provided as a Source Data file.
Fig. 5
Fig. 5. Impact of identified biomarkers on apoptosis (a–c) (n = 4 replicates from four independent mouse islet preparations; 16 mice per preparation) or proliferation (n = 4 individual donors for human islets) (d) in mouse or human islets as indicated.
Test compounds were added at 100 nM unless otherwise indicated. a ***p < 2.2·10-16 for the effects of NogoR vs vehicle and ***p = 5.45·10-8 for the effects of IL18Ra vs vehicle; b *p = 0.0196, 0.0117 for the effects of 3 nM and 10 nM NogoR, respectively versus vehicle by one-way ANOVA; ***p = 1.67·10-6 and p < 2.2·10-16 for the effects of 30 and 100 nM NogoR, respectively. c ***p = 0.0009; d ***p = 0.0015. The DYRK1A/DYRK2/CLK kinase inhibitor leucettine L41 was used as a positive control. Error bars represent means ± S.D. See Methods for other details. Source data are provided as a Source Data file.
Fig. 6
Fig. 6. NogoR enhances glucose clearance and insulin sensitivity in HFD mice.
Two separate cohorts of wild-type male C57BL/6 J mice were maintained on a high-fat diet for 6 weeks, then injected for 14 consecutive days with saline or 100 ng (2.1 pmol/animal) recombinant NogoR. a, b Body weights of cohort one and circulating glucose levels during an oral glucose tolerance test (OGTT;2 g/kg) pre-NogoR treatment n = 5. c, d Body weights and blood glucose levels after an oral glucose load (2 g/kg) of cohort one after NogoR treatment. n = 5. d **p = 0.0013; *p = 0.023 by multiple unpaired t-test. AUC **p = 0.0021 by two-tailed unpaired Student’s t-test. e Plasma insulin levels after an oral glucose load (2 g/kg) in cohort 1. n = 5 per group. f, g Post-treatment body weights of cohort 2 (n = 5 mice) and circulating glucose levels after receiving an intraperitoneal injection of 1 IU/kg of insulin. (i) *p = 0.0462 by multiple unpaired Student’s t-test. Data are mean ± SEM. Source data are provided as a Source Data file.
Fig. 7
Fig. 7. NogoR has marginal effects on glucose clearance and insulin sensitivity in db/db mice.
a Body weights of db/db cohort pre-NogoR treatment n = 4–5. bd Body weights, blood glucose levels and Area Under the Curve (AUC) after an oral glucose load (2 g/kg) 4 weeks after continuous NogoR treatment. n = 4–5. e, f Corresponding plasma insulin levels and AUC after oral glucose load (2 g/kg) shown in b. n = 4–5 per group. g, h Circulating glucose levels and corresponding AUC after receiving an intraperitoneal injection of 1 IU/kg of insulin. i Circulating NogoR levels 4 weeks after continuous treatment. Data are mean ± SEM. Source data are provided as a Source Data file. Data in b, e, and g were analyzed by multiple unpaired Student’s t-test, and those in a, c, d, f, h, i by Mann–Whitney test. No significant statistical differences were detected.
Fig. 8
Fig. 8. NF-κB activation in HEK293 cells overexpressing IL-18R and co-stimulated with Il-18 and IL-18Rα.
IL-18R HEK cells stimulated for 6 h with 100, 50, 20, 10, 5, 2 and 1 nM of IL-18 alone, and also with 100, 10, 1 and 0.1 nM of IL-18Rα. IL-18 and IL-18Rα concentrations were tested in triplicate and NF-κB activation was measured using dual luciferase reporter assay. Data (means ± S.E.M.) are from three fully independent experiments. Curve fitting was done using non-linear regression with GraphPad Prism 9.0.0 for log(agonist) vs. response (a) and inhibitor vs. response (b). Source data are provided as a Source Data file.

References

    1. International Diabetes Federation. Diabetes Facts and Figures. https://worlddiabetesday.org/about/facts-figures/ (2019).
    1. Chung WK, et al. Precision medicine in diabetes: a consensus report from the American Diabetes Association (ADA) and the European Association for the Study of Diabetes (EASD) Diabetes Care. 2020;43:1617–1635. doi: 10.2337/dci20-0022. - DOI - PMC - PubMed
    1. Ahluwalia TS, Kilpeläinen TO, Singh S, Rossing P. Editorial: Novel biomarkers for type 2 diabetes. Front Endocrinol. (Lausanne) 2019;10:649. doi: 10.3389/fendo.2019.00649. - DOI - PMC - PubMed
    1. Kolberg JA, et al. Development of a type 2 diabetes risk model from a panel of serum biomarkers from the Inter99 cohort. Diabetes Care. 2009;32:1207–1212. doi: 10.2337/dc08-1935. - DOI - PMC - PubMed
    1. Thakarakkattil Narayanan Nair A, et al. The impact of phenotype, ethnicity and genotype on progression of type 2 diabetes mellitus. Endocrinol. Diabetes Metab. 2020;3:e00108. doi: 10.1002/edm2.108. - DOI - PMC - PubMed

Publication types