. 2023 May 4;14(1):2560.
doi: 10.1038/s41467-023-38177-2.

Lung endothelial cells regulate pulmonary fibrosis through FOXF1/R-Ras signaling

Affiliations

Lung endothelial cells regulate pulmonary fibrosis through FOXF1/R-Ras signaling

Fenghua Bian et al. Nat Commun. .

Abstract

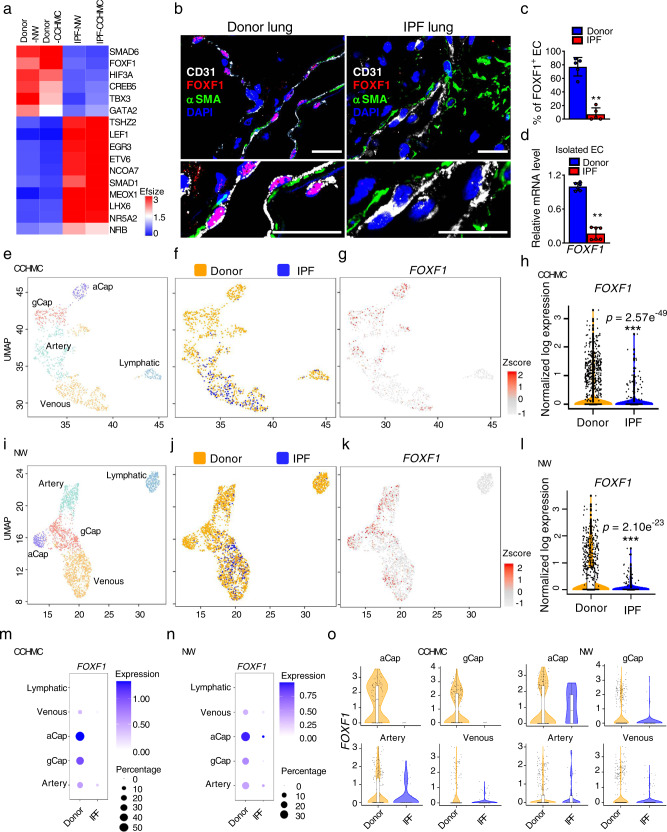
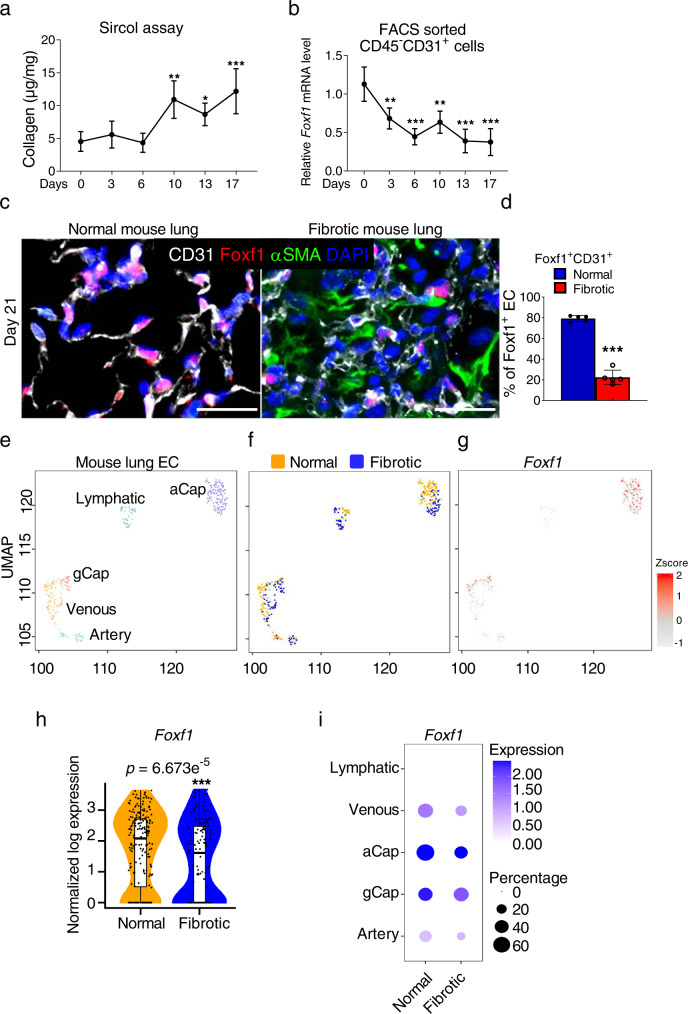
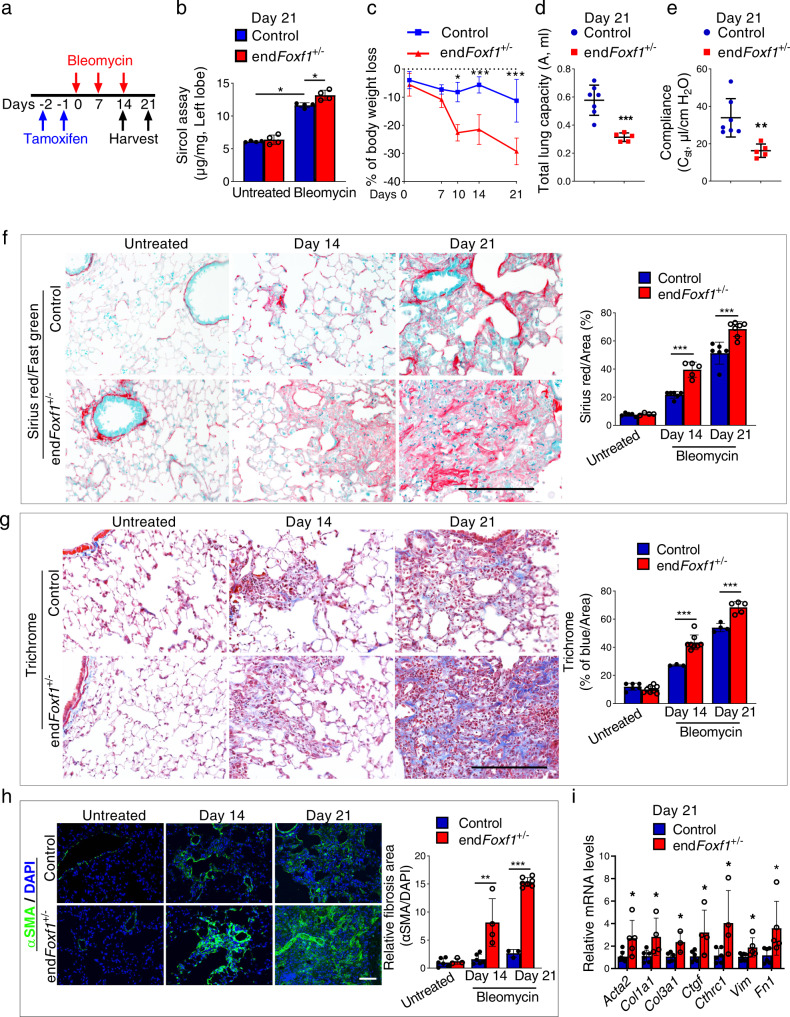
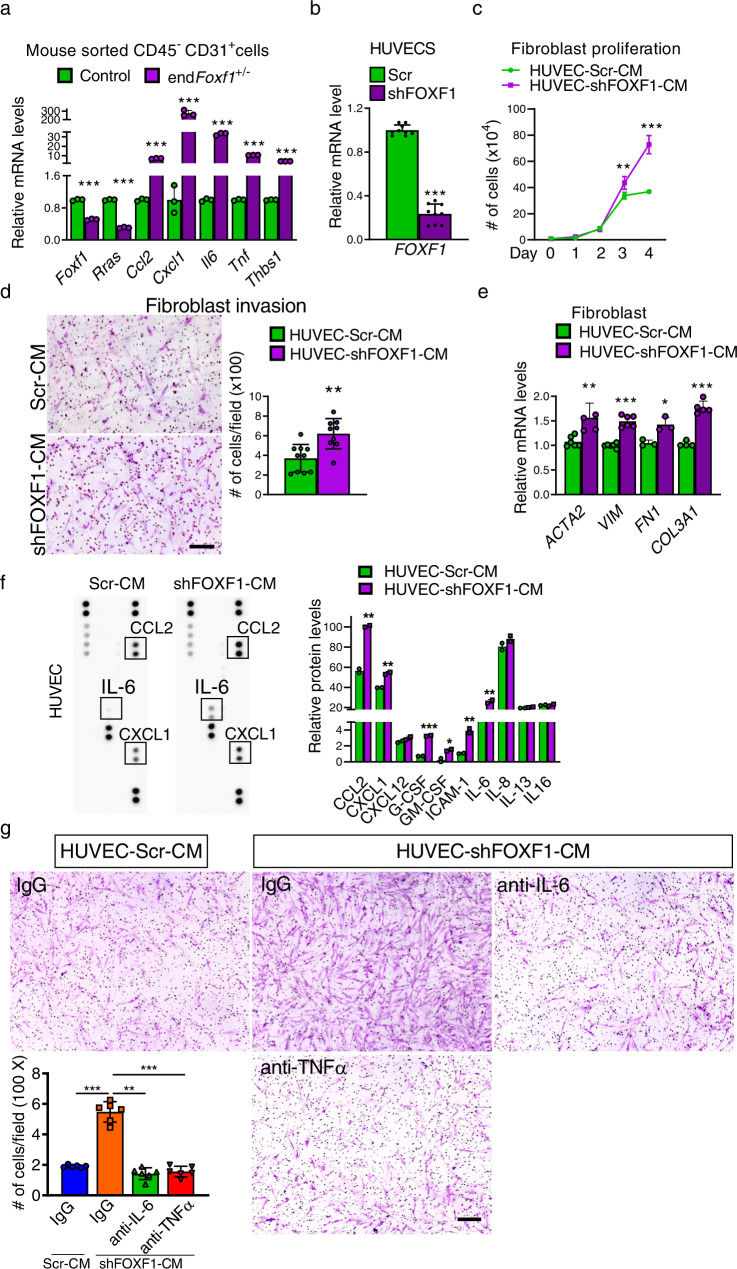
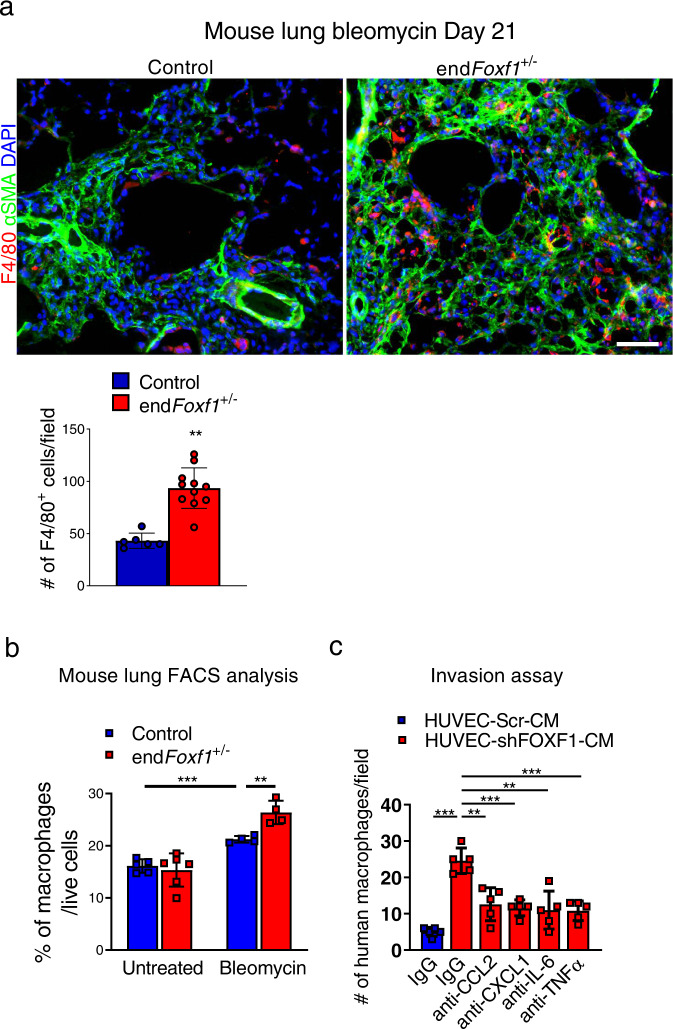
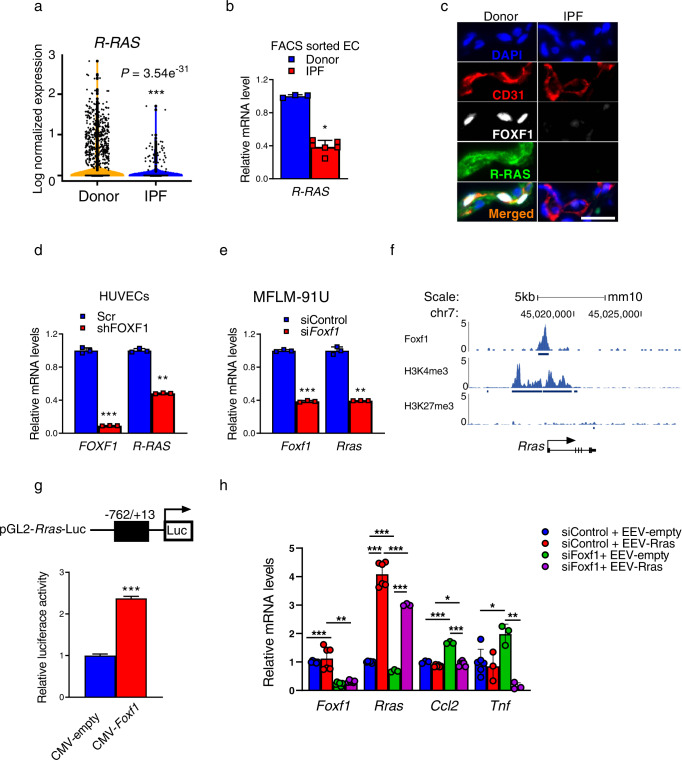
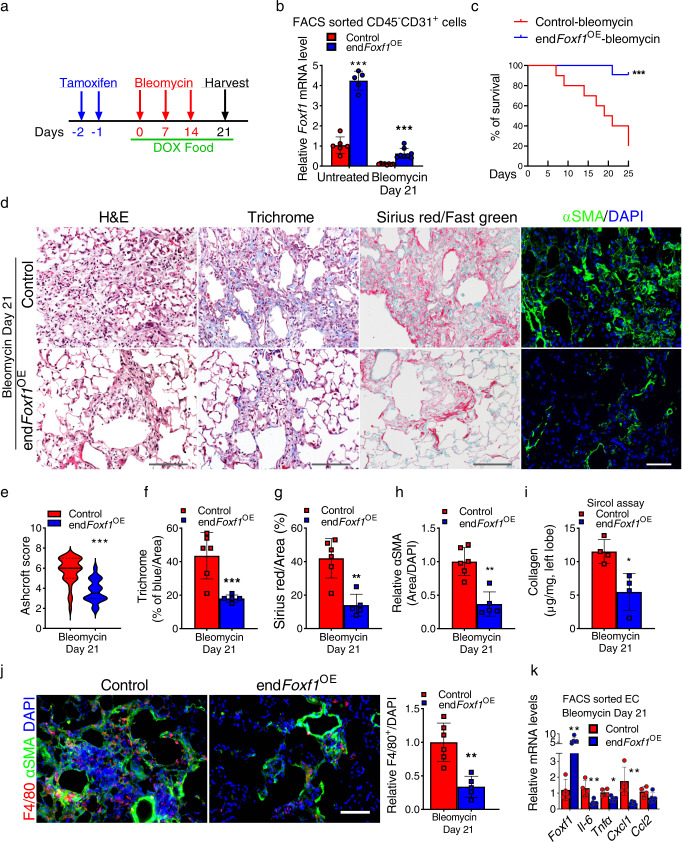
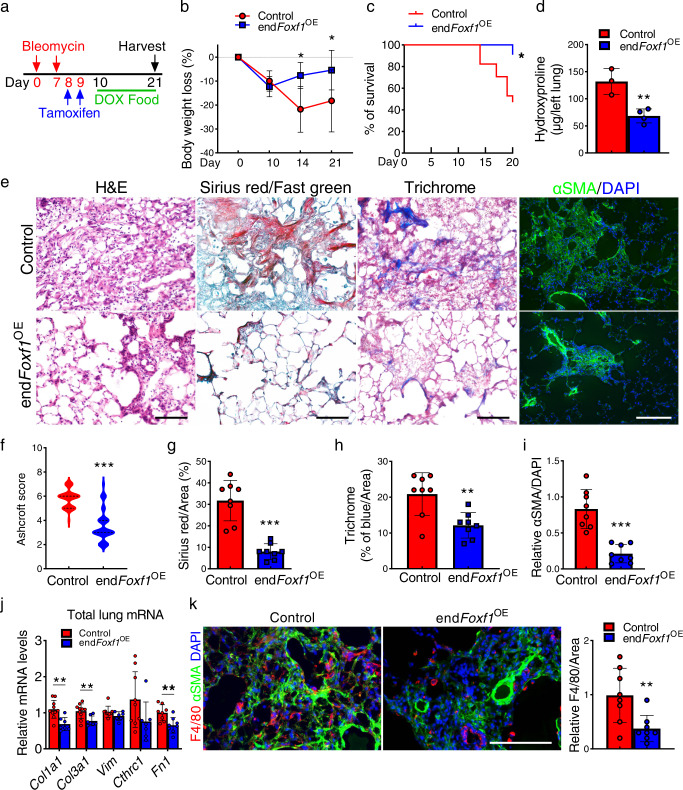
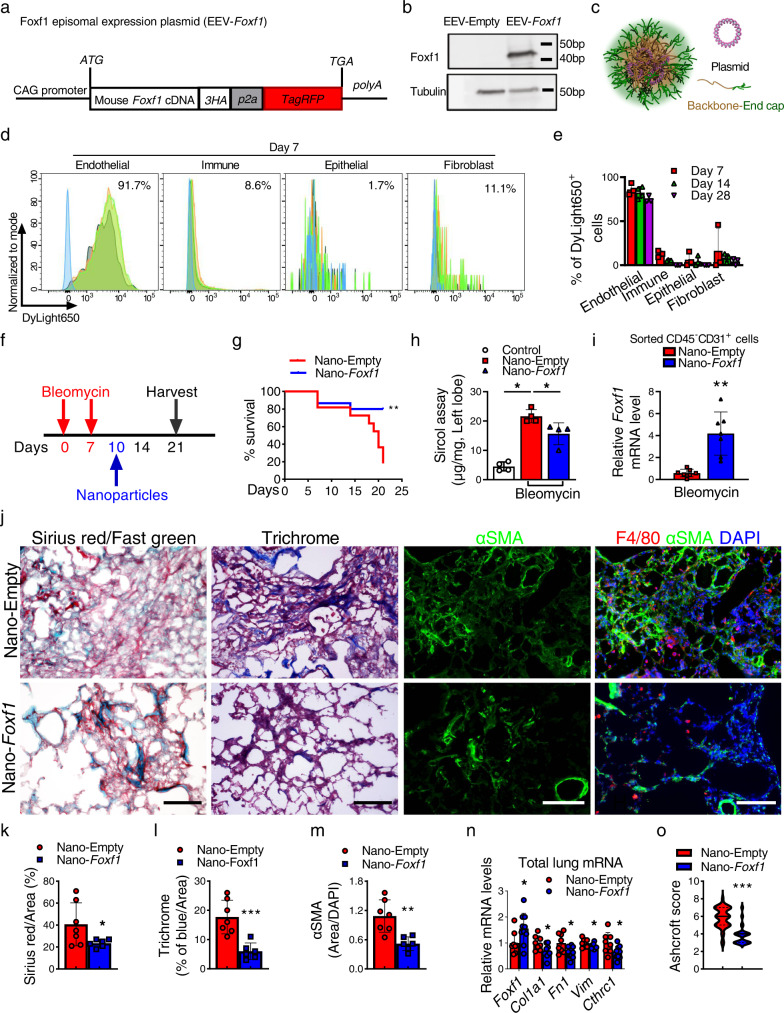
Pulmonary fibrosis results from dysregulated lung repair and involves multiple cell types. The role of endothelial cells (EC) in lung fibrosis is poorly understood. Using single cell RNA-sequencing we identified endothelial transcription factors involved in lung fibrogenesis, including FOXF1, SMAD6, ETV6 and LEF1. Focusing on FOXF1, we found that FOXF1 is decreased in EC within human idiopathic pulmonary fibrosis (IPF) and mouse bleomycin-injured lungs. Endothelial-specific Foxf1 inhibition in mice increased collagen depositions, promoted lung inflammation, and impaired R-Ras signaling. In vitro, FOXF1-deficient EC increased proliferation, invasion and activation of human lung fibroblasts, and stimulated macrophage migration by secreting IL-6, TNFα, CCL2 and CXCL1. FOXF1 inhibited TNFα and CCL2 through direct transcriptional activation of Rras gene promoter. Transgenic overexpression or endothelial-specific nanoparticle delivery of Foxf1 cDNA decreased pulmonary fibrosis in bleomycin-injured mice. Nanoparticle delivery of FOXF1 cDNA can be considered for future therapies in IPF.


Conflict of interest statement

The authors declare no competing interests.

Figures

Fig. 1
Fig. 1. FOXF1 is decreased in ECs of human IPF lung.
a Heat map shows top differentially expressed transcription factors in EC of IPF lungs compared to EC of donor lungs. scRNA-seq was performed using 3 donor (Donor-CCHMC) and 2 IPF (IPF-CCHMC) lungs. scRNA-seq datasets were also downloaded from GSE 122960 (Donor-NW, n = 8 lungs; IPF-NW, n = 4 lungs). b Co-localization for FOXF1, CD31 and αSMA show decreased FOXF1 in human EC within IPF fibrotic foci (n = 5 lungs per group). DAPI (blue) was used to stain cell nuclei. Bar = 20 μm. c Decreased percent of FOXF1-positive ECs in IPF lungs. Percentage of FOXF1+/CD31+ double positive ECs were counted in 5 random fields and presented as mean ± SD (n = 5 lungs per group), **p = 0.0079, Mann–Whitney Two-tailed test. d Decreased FOXF1 mRNA in EC isolated from human IPF lungs compared to donors (n = 6 per group) is shown by qRT-PCR. ACTB mRNA was used for normalization, **p = 0.0022, Mann–Whitney Two-tailed test. e, f Unsupervised UMAP clustering of lung EC from scRNA-seq CCHMC datasets. g UMAP plots show FOXF1 expression in IPF and donor EC clusters after Z-score normalization. h Violin plots show decreased expression of FOXF1 mRNA in ECs from IPF lungs compared to donor lungs (CCHMC datasets). i, j Unsupervised clustering of lung EC is shown using NW scRNA-seq datasets (GSE 122960). IPF samples (n = 4) were compared with donor samples (n = 8). k Expression of FOXF1 in IPF and control EC clusters after Z-score normalization. l Violin plots show decreased expression of FOXF1 mRNA in ECs from IPF lungs (NW scRNA-seq datasets). Dot-plots show the decreased FOXF1 mRNA in venous, aCap, gCap, and arterial clusters of IPF endothelial cells using CCHMC (m) and NW (n) scRNA-seq datasets. Size of the dots represent frequency of FOXF1+ cells in each cluster. Color of the dots represent the expression levels of FOXF1 in each cluster. FOXF1 expression is log normalized. o Violin plots show decreased FOXF1 mRNA in aCap, gCap, arterial and venous endothelial cells of IPF lungs compared to donor lungs in both CCHMC and NW data sets. FOXF1 expression is log normalized. Source data are provided as a Source Data file.
Fig. 2
Fig. 2. Expression of FOXF1 is decreased in endothelial cells within fibrotic lesions of mouse lungs.
a Time-dependent accumulation of collagen in murine lungs after chronic bleomycin injury is quantified using Sircol collagen assay. Wild type mice were treated with three weekly IT injections of bleomycin to induce lung fibrosis (Day0, 3, 6, 10, 17, n = 4 mice per group; Day 13, n = 6 mice). b Time-dependent decrease of Foxf1 mRNA is shown in FACS-sorted lung endothelial cells during lung fibrogenesis using qRT-PCR (Day 0, 6,10, n = 3; Day 3, n = 4; Day13 n = 7; Day 17, n = 8, mice per group). c Co-localization studies show decreased FOXF1 in endothelial cells and decreased number of FOXF1+ endothelial cells within lung fibrotic foci at day 21 after bleomycin treatment. Mouse normal lungs (n = 5) and bleomycin-treated lungs (n = 5) were stained with antibodies against FOXF1 (red), CD31 (white) and αSMA (green). DAPI (blue) was used to visualize the nuclei. Bar = 25 µm. d Percent of FOXF1+/CD31+ double positive cells among CD31+ cells were counted in 5 random fields and presented as mean ± SD (n = 5 mice per group). ***p < 0.001. The integrated projection of lung EC from normal and bleomycin-treated fibrotic lungs (e, colored by cell type. f, yellow- normal lungs; blue- fibrotic lungs). Single cell RNA-seq was performed using pooled normal controls (n = 4) and bleomycin-treated (n = 6) mouse lungs. g UMAP plots show Foxf1 expression in endothelial cells of normal and fibrotic mouse lungs after Z-score normalization. h Violin plots show decreased expression of Foxf1 mRNA in ECs from fibrotic lungs. i Both Foxf1 mRNA expression and the frequency of Foxf1-positive cells are decreased in venous, aCap, gCap, and arterial endothelial cells from fibrotic lungs. Foxf1 is not expressed in lymphatic endothelial cells. Foxf1 expression is log normalized. Data presented as mean ± SD. *p < 0.05, **p < 0.01, ***p < 0.001. For two group comparisons, T-test (two-tailed) analyses were performed. For more than two group, statistical significance was determined by one-way ANOVA followed by Dunnett’s test. Source data are provided as a Source Data file.
Fig. 3
Fig. 3. Deletion of FOXF1 in endothelial cells accelerates pulmonary fibrosis.
a Schematic diagram of bleomycin administration to induce lung fibrosis and tamoxifen (TAM) administration to delete Foxf1 in endFoxf1+/− and control Foxf1+/− mice. b Lung collagen was quantified at 21 days after bleomycin administration by Sircol assay (n = 4 mice per group). Data presented as mean ± SD. *p < 0.05. Mann–Whitney Two-tailed test were performed. c Increased body weight loss in endFoxf1+/− mice is shown at different time points compared to control mice. n = 6 per group. d, e Decreased lung capacity and lung compliance in endFoxf1+/− (n = 5) mice at day 21 after bleomycin administration shown using FlexiVent. Control, n = 7. ***p = 0.0004 (d). **p = 0.0031 (e). fh Increased severity of lung fibrosis in endFoxf1+/− mice is shown using (f) Sirius red/Fast green at Days 14 and 21 after bleomycin treatment (untreated control n = 5 and endFoxf1+/− n = 4; bleomycin treated Day 14 control n = 6 and endFoxf1+/− n = 5; Day 21 control n = 6 and endFoxf1+/− n = 7) and (g) Trichrome staining (untreated control n = 6 and endFoxf1+/− n = 8; Day 14 control n = 3 and endFoxf1+/− n = 8; Day 21 control n = 4 and endFoxf1+/− n = 5), as well as immunostaining for αSMA (green) (untreated control, n = 6; untreated endFoxf1+/− n = 3; Day 14 control, n = 6; Day 14 endFoxf1+/−, n = 4; Day 21 control, n = 3; Day 21 endFoxf1+/−, n = 7) (h). Bar = 100 µm. Sirius Red binds to all types of collagens, whereas fast green stains non-collagenous proteins. i Endothelial deletion of Foxf1 increases mRNA levels of collagen genes in total lung RNA as shown by qRT-PCR. Total lung mRNA was extracted from control and bleomycin-treated endFoxf1+/−mice on day 21. Actb mRNA was used for normalization. Control Acta2, n = 7; Control Col1a1, n = 6; Control Col3a, n = 5; Control Ctgf, n = 6; Control Cthrc1, n = 6; Control Vim, n = 7; Control Fn1, n = 6; endFoxf1+/− Acta2, n = 5; endFoxf1+/− Col1a1, n = 4; endFoxf1+/− Col3a, n = 3; endFoxf1+/− Ctgf, n = 4; endFoxf1+/− Cthrc1, n = 4; endFoxf1+/− Vim, n = 5; endFoxf1+/− Fn1, n = 5. Data presented as mean ± SD. *p < 0.05, **p < 0.01, ***p < 0.001. T-test (two-tailed) analyses were performed. Source data are provided as a Source Data file.
Fig. 4
Fig. 4. FOXF1-deficient endothelial cells increase myofibroblast activation.
a qRT-PCR shows increased expression of fibrosis-associated genes in FACS-sorted endothelial cells of endFoxf1+/− lungs at day 21 after bleomycin administration. Actb mRNA was used for normalization. n = 3 mice per group. b Efficient inhibition of FOXF1 expression in shFOXF1-transfected HUVEC cells is shown with qRT-PCR. ACTB mRNA was used for normalization. n = 9 samples per group. c CM from FOXF1-deficient HUVECs increases fibroblast proliferation. CCD-19Lu fibroblasts were cultured in the presence of CM from control or FOXF1-deficient HUVECs. n = 3 samples per group. Day 3, **p = 00290; Day 4 ***p < 0.0001 by two-way ANOVA test. d Conditioned media (CM) from FOXF1-deficient HUVECs increases invasion of cultured CCD-19Lu fibroblasts. Human CCD-19Lu fibroblasts were seeded on the insert of transwell chamber coated with matrigel in the presence of CM from scrambled control (Scr-CM, n = 10) or FOXF1-deficient (shFOXF1-CM, n = 9) HUVECs. Graph represents average numbers of invaded cells per field. Bar = 200 μm. **p = 0.0019. e CCD-19Lu fibroblasts cultured in CM from FOXF1-deficient HUVECs had increased expression of pro-fibrotic genes compared to fibroblasts cultured in CM from control HUVECs as shown by qRT-PCR. HUVEC-Scr-CM ACTA2, n = 6; HUVEC-Scr-CM VIM, n = 6; HUVEC-Scr-CM FN1, n = 3; HUVEC-Scr-CM COL3A1, n = 4; HUVEC-shFOXF1-CM ACTA2, n = 5; HUVEC-shFOXF1-CM VIM, n = 6; HUVEC-shFOXF1-CM FN1, n = 3; HUVEC-shFOXF1-CM COL3A1, n = 5. f CM from FOXF1-deficient HUVECs had increased levels of pro-inflammatory mediators as determined by Proteome Profiler Human Cytokine Array (n = 2). g Inhibition of IL-6 and TNFα using blocking antibodies attenuated CCD-19Lu fibroblast invasion in the presence of CM from FOXF1-deficient HUVECs. Bar = 200 μm. n = 6 samples per group. Data presented as mean ± SD, *p < 0.05, **p < 0.01, ***p < 0.001. CM conditioned medium. For two group comparisons, T-test (two-tailed) analyses were performed. Source data are provided as a Source Data file.
Fig. 5
Fig. 5. Inhibition of FOXF1 in EC increases the number of macrophages in the fibrotic lungs.
a Increased number of macrophages in the lungs of endFoxf1+/− (n = 11) mice compared to control (n = 6) mice at day 21 after bleomycin administration is shown using immunostaining for F4/80 (red) and αSMA (green) (control, n = 6 mice). Nuclei are counterstained with DAPI (blue). Bar = 100 μm. Average numbers of F4/80-positive cells were quantified using 10 random microscope fields per lung and presented as mean ± SD. **p = 0.0013. b Flow cytometry analysis shows increased percentage of macrophages in the lungs of bleomycin-treated endFoxf1+/− mice compared to control mice. Macrophages were identified as CD45+ CD64+ CD11clow/+ (Untreated Control, n = 5; untreated endFoxf1+/−, n = 6; bleomycin-treated Control and endFoxf1+/−, n = 4). Data presented as mean ± SD. c Inhibition of CCL2, CXCL1, IL-6 and TNFα in CM from FOXF1-dificient HUVECs (shFOXF1-CM) using blocking antibodies attenuated microphage invasion in transwell assay. Human macrophages were incubated in the presence of CM from scrambled control (Scr-CM) or shFOXF1-transfected (shFOXF1-CM) HUVECs. Invaded cells were counted in 5 random microscope fields and presented as mean ± SD. n = 5 samples per group. *p < 0.05, **p < 0.01, ***p < 0.001 by Student’s T test (two-tailed). CM condition medium. Source data are provided as a Source Data file.
Fig. 6
Fig. 6. R-Ras is a direct transcriptional target of FOXF1.
a Violin plots show decreased R-RAS mRNA in EC of IPF (n = 4 lungs) compared to donor (n = 8 lungs), GSE 122960 datasets. R-RAS expression was log normalized. b R-RAS mRNA was decreased in FACS-sorted ECs from IPF lungs (n = 6) compared to donor lungs (n = 3) as shown by qRT-PCR. Data presented as mean ± SD, *p = 0.238, Mann–Whitney Two-tailed test. c Immunostaining for R-RAS, FOXF1 and CD31 shows co-localization of FOXF1 and R-RAS in ECs of donor lungs (n = 5). Neither R-RAS nor FOXF1 are detected in ECs within IPF fibrotic lesions (n = 5). Nuclei are counterstained with DAPI. Bar = 20 μm. d qRT-PCR shows that shRNA-mediated knockdown of FOXF1 (shFOXF1) in HUVECs decreased R-RAS mRNA compared to control (Scr). ACTB mRNA was used for normalization (n = 3), **p < 0.01 and ***p < 0.001 by Student’s T test (two-tailed). e qRT-PCR shows that siRNA-mediated knockdown of Foxf1 in mouse MFLM-91U ECs decreased Rras mRNA. Actb mRNA was used for normalization (n = 3). f ChIP-seq shows direct binding of FOXF1 protein to Rras promoter region in MFLM-91U cells. Binding of FOXF1 to Rras promoter is associated with H3K4me3 marks but not H3K27me3 marks. g Schematic drawing of the pGL2-Rras-Luc construct with the −762/+13 bp Rras promoter region containing the FOXF1-binding site (top panel). In co-transfection experiments, CMV-FOXF1 expression vector increased transcriptional activity of the −762/+13 Rras promoter region compared to CMV-empty vector (bottom panel), n = 3, ***p < 0.001. h Overexpression of R-Ras decreased Ccl2 and TNFα mRNAs in mock-transfected cells and prevented upregulation of Ccl2 and TNFα in cells transfected with Foxf1-specific siRNA. MFLM-91U cells were transfected with non-targeting siRNA (siControl) or siFoxf1, and EEV-empty vector or EEV-Rras. Actb mRNA was used for normalization (siControl+EEV-empty Foxf1, n = 6; siControl+EEV-empty Rras, n = 6; siControl+EEV-empty Ccl2, n = 3; siControl+EEV-empty Tnf, n = 6; siControl+EEV-Rras Foxf1, n = 6; siControl+EEV-Rras Rras, n = 6; siControl+EEV-Rras Ccl2, n = 6; siControl+EEV-Rras Tnf, n = 3; siFoxf1+EEV-empty Foxf1, n = 6; siFoxf1+EEV-empty Rras, n = 3; siFoxf1+EEV-empty Ccl2, n = 3; siFoxf1+EEV-empty Tnf, n = 3; siFoxf1+EEV-Rras Foxf1, n = 6; siFoxf1l+EEV-Rras Rras, n = 3; siFoxf1l+EEV-Rras Ccl2, n = 6; siFoxf1+EEV-Rras Tnf, n = 3), *p < 0.05, **p < 0.01, ***p < 0.001 by Student’s t test (two tailed). Source data are provided as a Source Data file.
Fig. 7
Fig. 7. Endothelial-specific overexpression of FOXF1 before bleomycin injury decreases pulmonary fibrosis and improves survival of mice.
a Schematic diagram shows bleomycin, tamoxifen (TAM) and doxycycline (DOX) treatments in endFoxf1OE mice. b qRT-PCR shows that Foxf1 mRNA is increased in lung ECs isolated from untreated and bleomycin-treated endFoxf1OE mice compared to control mice. Actb mRNA was used for normalization (Untreated Control, n = 6; Untreated endFoxf1OE, n = 5; Bleomycin Control and endFoxf1OE, n = 8 mice per group), ***p < 0.001. c Endothelial-specific overexpression of FOXF1 increases mouse survival after bleomycin injury (n = 10), **p = 0.001, Log-rank (Mantel–Cox) test. d Decreased fibrosis in lungs of bleomycin-treated endFoxf1OE mice is shown by H&E, Trichrome, Sirius red/fast green staining and immunostaining for αSMA (green). Mouse endFoxf1OE (n = 5) and control lungs (n = 5) were harvested at day 21 after bleomycin treatment. Bar = 100 μm. eh Assessment of fibrotic lesions in endFoxf1OE (n = 5) lungs is presented as Ashcroft score ***p < 0.0001 (e), the percent of Trichrome-positive **p = 0.0058 (f) Sirius red-positive. **p = 0.0011 (g), and αSMA-positive areas in the lungs (Control, n = 6), **p = 0.0013. Areas positive for collagen depositions were quantified in 10 random fields per lung using Nikon’s NIS-Elements AR software (h). i Lung collagen depositions were quantified by Sircol collagen assay. Left lung lobes from endFoxf1OE (n = 4) and control mice (n = 4) were used. *p = 0.0286. t test (two tailed). j Decreased number of macrophages in the lungs of bleomycin-treated endFoxf1OE mice (n = 5) is shown using immunofluorescent staining with anti-F4/80 antibodies (red) and anti-αSMA antibodies (green) at day 21 after bleomycin administration (Control, n = 6). Nuclei are counterstained with DAPI (blue). Bar = 100 μm. Average numbers of F4/80-positive cells were quantified using 10 random microscope fields per lung and presented as mean ± SD. **p = 0.0013. t test (two tailed). k Endothelial overexpression of Foxf1 decreases mRNA levels of pro-inflammatory genes in FACS sorted EC as shown by qRT-PCR. mRNA was extracted from control and bleomycin-treated endFoxf1OE mice on day 21. Actb mRNA was used for normalization. Control, n = 4; endFoxf1OE, n = 5. Data presented as mean ± SD. *p < 0.05, **p < 0.01, ***p < 0.001 by Student’s t test (two tailed). Source data are provided as a Source Data file.
Fig. 8
Fig. 8. Endothelial-specific overexpression of FOXF1 during fibrotic stage decreases lung fibrosis and increases survival of mice after bleomycin-induced injury.
a Schematic diagram shows bleomycin, tamoxifen (TAM) and doxycycline (DOX) treatment in endFoxf1OE mice. b Endothelial-specific overexpression of FOXF1 decreases bodyweight loss in bleomycin-treated endFoxf1OE mice (Control, n = 12; endFoxf1OE, n = 12 for days 0 and 21, n = 4 for day 10, n = 6 for day 14), *p < 0.05, two-way ANOVA with the Geisser–Greenhouse correction. c Endothelial-specific overexpression of FOXF1 increases mouse survival after bleomycin injury (Control, n = 11; endFoxf1OE, n = 17), *p < 0.05, Log-rank (Mantel–Cox) test. d Decreased collagen depositions in bleomycin-treated endFoxf1OE lungs is shown by Hydroxyproline assay. Left lung lobes from endFoxf1OE (n = 4) and control (n = 3) mice were used, **p = 0.0061, t test (two tailed). e Decreased fibrosis in bleomycin-treated endFoxf1OE lungs is shown by H&E, Sirius red/fast green, Trichrome, and immunostaining for αSMA. Lungs were harvested at day 21 after bleomycin treatment (n = 8 per group). Bar = 100 µm. fi Ashcroft score of endFoxf1OE lungs (***p < 0.0001) is consistent with the percent of Sirius red-positive (***p < 0.0001), Trichrome-positive (**p = 0.0031) and αSMA-positive areas (***p < 0.0001). Areas positive for collagen depositions were quantified in 10 random fields per lung using Nikon NIE CIC Analysis Elements software. n = 8 mice per group. j Endothelial overexpression of Foxf1 at day 10 after bleomycin administration decreases mRNA levels of pro-fibrotic genes in total lung RNA as shown by qRT-PCR. Total lung mRNA was extracted from control and bleomycin-treated endFoxf1OE mice on day 21. Actb mRNA was used for normalization (Control Col1a1 and Col3a1, n = 10; Control Vim, n = 9; Control Cthrc1, n = 9; Control Fn1, n = 8; endFoxf1OE Col1a1, Col3a1, Vim and Cthrc1, n = 7; endFoxf1OE Fn1, n = 8). k Decreased number of macrophages in the lungs of bleomycin-treated endFoxf1OE mice is shown using immunofluorescent staining with anti-F4/80 antibodies (red) and anti-αSMA antibodies (green) at day 21 after bleomycin administration, ***p < 0.0001. Nuclei are counterstained with DAPI (blue). n = 8 mice per group. Data presented as mean ± SD, *p < 0.05, **p < 0.01, ***p < 0.001, Student’s t test (two tailed). Source data are provided as a Source Data file.
Fig. 9
Fig. 9. Nanoparticle delivery of non-integrating Foxf1 expression vector into the lung endothelium attenuates pulmonary fibrosis.
a Diagram of the FOXF1 episomal plasmid (EEV-Foxf1). b Western blot shows increased FOXF1 protein after transfection of EEV-Foxf1 plasmid into FOXF1-negative HEK-293T cells. c Schematic of PBAE nanoparticles loaded with plasmid DNA. All elements of images were created using Autodesk 3ds Max 2020 (Autodesk, version 2020). d FACS analysis of mouse lungs show the presence of labeled nanoparticles in endothelial cells but not in other cell types at day 7 after I.V. administration (n = 3). e FACS analysis shows nanoparticles in lung ECs at different time-points after bleomycin injury (n = 5 mice per group). f Diagram shows nanoparticle I.V. delivery to mice at day 10 after bleomycin administration. g Kaplan–Meier analysis shows increased survival of bleomycin-injured mice after nanoparticle delivery of EEV-Foxf1 plasmid (Nano-Foxf1, n = 15) compared to EEV-Empty (Nano-Empty, n = 11), **p < 0.005, Log-rank (Mantel–Cox) test. h Sircol assay shows decreased collagen depositions in Nano-Foxf1-treated lungs (n = 4 mice per group), *p < 0.05, ***p < 0.001, Mann–Whitney Two-tailed test. i Foxf1 mRNA is increased in FACS-sorted lung ECs from Nano-Foxf1 treated mice (n = 7), *p < 0.05, **p < 0.005, Student’s t test (two tailed). j Decreased lung fibrosis in Nano-Foxf1-treated mice is shown with Sirius red/fast green, Masson’s trichrome, and immunostaining for αSMA. Decreased number of macrophages in Nano-Foxf1-treated lungs is shown by immunostaining for F4/80 and αSMA at day 21 after bleomycin administration (n = 6 mice per group). Bar = 100 μm. kn Quantification of fibrotic lesions in mouse lungs is shown as the percent of Sirius red-positive (k), Trichrome-positive (l) and αSMA (m) areas. Areas positive for collagen depositions were quantified in 10 random microscope fields per lung (Nano-Empty, n = 7; Nano-Foxf1, n = 6). n Nanoparticle delivery of Foxf1 at day 10 after bleomycin administration decreases mRNA levels of pro-fibrotic genes in total lung RNA as shown by qRT-PCR. (Nano-Empty control, n = 8, and Nano-Foxf1-treated, n = 10, on day 21 after bleomycin administration. Actb mRNA was used for normalization. o Decreased Ashcroft score in nano-Foxf1 treated lungs (n = 10) compared to control nano-Empty (n = 8). Data presented as mean ± SD. *p < 0.05, **p < 0.01, ***p < 0.001 by Student’s t test (two tailed). Source data are provided as a Source Data file.

References

    1. Travis WD, et al. An official American Thoracic Society/European Respiratory Society statement: Update of the international multidisciplinary classification of the idiopathic interstitial pneumonias. Am. J. Respir. Crit. Care Med. 2013;188:733–748. - PMC - PubMed
    1. Raghu G, et al. Diagnosis of idiopathic pulmonary fibrosis. An official ATS/ERS/JRS/ALAT clinical practice guideline. Am. J. Respir. Crit. Care Med. 2018;198:e44–e68. - PubMed
    1. Crossno PF, et al. Identification of early interstitial lung disease in an individual with genetic variations in ABCA3 and SFTPC. Chest. 2010;137:969–973. - PMC - PubMed
    1. Nogee LM, et al. A mutation in the surfactant protein C gene associated with familial interstitial lung disease. N. Engl. J. Med. 2001;344:573–579. - PubMed
    1. Noble PW, Barkauskas CE, Jiang D. Pulmonary fibrosis: patterns and perpetrators. J. Clin. Invest. 2012;122:2756–2762. - PMC - PubMed

Publication types

MeSH terms