. 2023 May 3;14(1):2537.
doi: 10.1038/s41467-023-38317-8.

Antibodies to variable surface antigens induce antigenic variation in the intestinal parasite Giardia lamblia

Affiliations

Antibodies to variable surface antigens induce antigenic variation in the intestinal parasite Giardia lamblia

Albano H Tenaglia et al. Nat Commun. .

Abstract

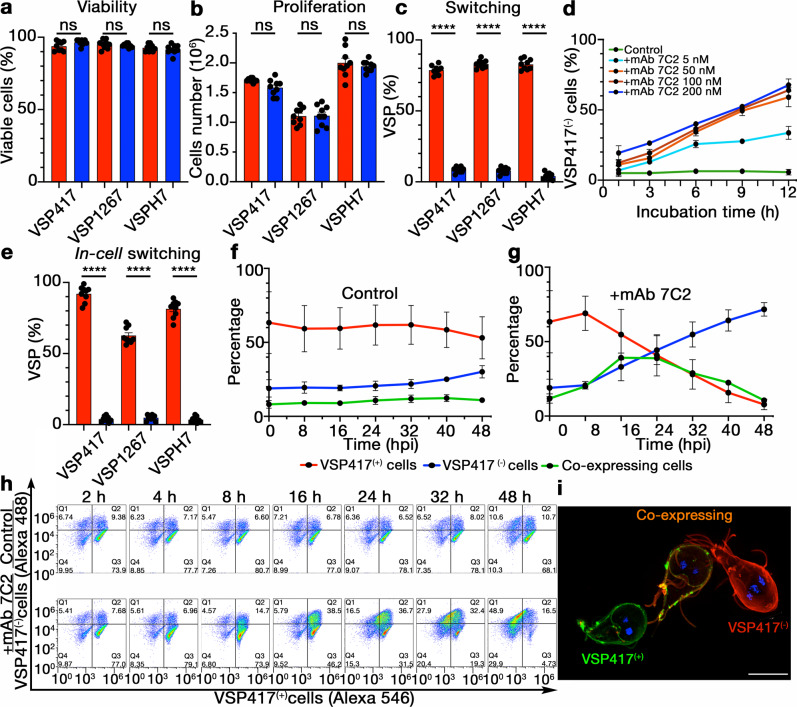
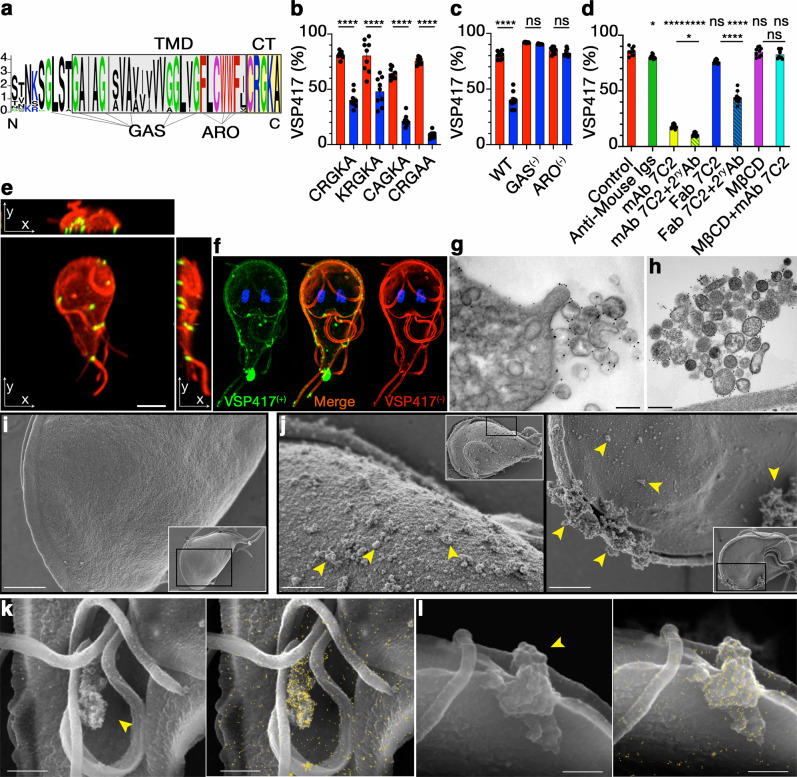
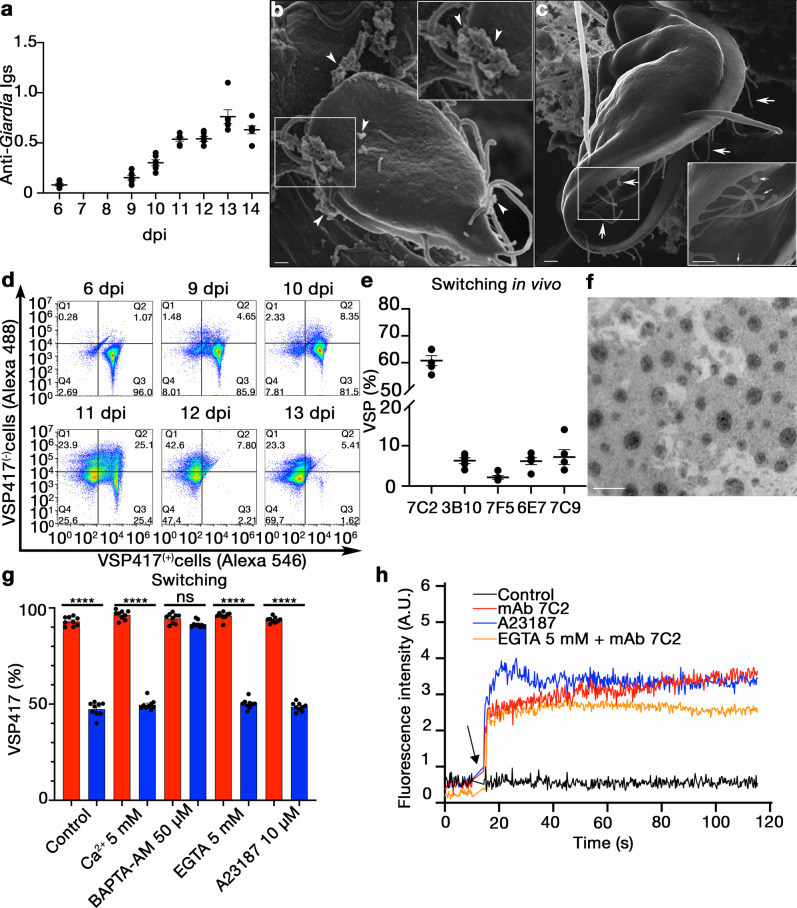
The genomes of most protozoa encode families of variant surface antigens. In some parasitic microorganisms, it has been demonstrated that mutually exclusive changes in the expression of these antigens allow parasites to evade the host's immune response. It is widely assumed that antigenic variation in protozoan parasites is accomplished by the spontaneous appearance within the population of cells expressing antigenic variants that escape antibody-mediated cytotoxicity. Here we show, both in vitro and in animal infections, that antibodies to Variant-specific Surface Proteins (VSPs) of the intestinal parasite Giardia lamblia are not cytotoxic, inducing instead VSP clustering into liquid-ordered phase membrane microdomains that trigger a massive release of microvesicles carrying the original VSP and switch in expression to different VSPs by a calcium-dependent mechanism. This novel mechanism of surface antigen clearance throughout its release into microvesicles coupled to the stochastic induction of new phenotypic variants not only changes current paradigms of antigenic switching but also provides a new framework for understanding the course of protozoan infections as a host/parasite adaptive process.


Conflict of interest statement

The authors declare no competing interests.

Figures

Fig. 1
Fig. 1. Effect of antibodies on Giardia trophozoites.
a Representative immunofluorescence images of the different VSP clones (VSP, green; Nuclei, blue). b Giardia trophozoites of clone VSP417 incubated in the presence of 100 µM of mAb 7C2. A rapid agglutination of the cells was observed, and clusters of cells remained grouped but alive at 72 h of culture with mAb 7C2. c Giardia trophozoites of clone VSP417 incubated with 50 nM of mAb 7C2. A rapid agglutination of the cells was observed, but cells were then reattached to the glass tube at 72 h of culture with mAb 7C2. d Representative image of a cluster of Giardia trophozoites expressing VSP417, incubated for 48 h in the presence of mAb 7C2 (100 µM), and stained with FDA to label live cells (green) and with PI to label the nuclei of dead cells (red). All trophozoites of the aggregate are alive after that period in the presence of the anti-VSP antibody. Scale bars 10 µm.
Fig. 2
Fig. 2. Antibodies to Giardia VSPs stimulate antigenic variation.
Different VSP clonal populations were grown in the presence of 50 nM of either anti-CWP1 mAb (red columns, controls) or their cognate anti-VSP mAb (blue columns) for 72 h; then, the percentage of live cells (a), the total number of cells (b) and the percentage of the original VSP in each population (c) were determined. d Percentages of VSP417(−) cells after discrete incubation times with mAb 7C2 at varying concentrations. e Percentage of cells expressing particular VSPs after Giardia cloning in the presence of their cognate anti-VSP mAb (blue) or the control (red). f, g Percentages of VSP417(−), VSP417(+) and co-expressing cells treated with mAb 7C2 (50 nM) for 48 h. h Representative cytograms showing the anti-clockwise distribution shift from VSP417(+) to VSP417(−) cells when cells were stimulated with mAb 7C2 (+mAb 7C2) at different hpi. Incubation with mAb 8F12 (Control) shows no redistribution. i Super-resolution structured illumination microscopy showing three trophozoites at different stages of antigenic switching after 24 h of mAb stimulation. Scale bar, 5 µm. Values represent mean ± s.e.m. of three independent experiments performed in triplicate. *p < 0.05; **p < 0.01; ***p < 0.001; ****p < 0.0001, ns not significant. Adjusted p values = a VSP417 = 0.1068, VSP1267 = 0.8990, VSPH7 = 0,7567; b VSP417 = 0.2081, VSP1267 = 0.9998, VSPH7 = 0.8007; d VSP417 = 0.1068, VSP1267 = 0.8990, VSPH7 = 0,7567. Statistical significance is based on one-way ANOVA on datasets with Sidak’s multiple comparisons tests.
Fig. 3
Fig. 3. VSP signals through clustering by antibodies.
a Sequence logo of the C-terminus of VSPs. TMD and CT are boxed in grey and yellow, respectively. G-xxx-G and small-xxx-small motifs (GAS) and aromatic residues (ARO) are indicated. VSP417 trophozoites coexpressing variants of the CT (b) and the TMD (c) of VSPH7 showing the percentage of VSP417(+) cells after 72 h in the presence of either mAb G10/4 (blue) or the control (red). Values were normalised to the percentage of cells coexpressing both VSPs. d Percentage of VSP417-expressing cells after 72 h in the presence of mAb 7C2 (50 nM), Fab (100 nM) and Fab in combination with a secondary antibody (2ry Ab), and in the presence or absence of MβCD (10 mM). e VSP417-expressing trophozoite after 1 h of treatment with mAb 7C2 (red); then fixed and incubated with mAb 7C2 (green). Maximum intensity projections on the three orthogonal axes from images taken in Z-stack show microdomains of VSP417 bound to the antibody (yellow) and free VSP417 (red). Scale bar 5 µm. f SR-SIM showing colocalisation (yellow) of the former VSP (VSP417, green) and the newly expressed VSP (VSP417(−), red) after 24 hpi with mAb 7C2. TEM with gold labelling of a VSPH7 trophozoite incubated for 30 m with mAb G10/4 (g) and of a VSP417 trophozoite incubated for 30 min with mAb 7C2 (h). Scale bars, 500 nm. SEM images of a control cell (i) and mAb 7C2-treated trophozoites for 1 h (j). Insets are the cells from which a region (black box) was amplified. Arrowhead shows groups of microvesicles. k, l SEM of VSPH7 trophozoites incubated with gold-labelled mAb G10/4 for 30 min showing images obtained by secondary (left) and backscattered electrons (right). Arrows indicate groups of microvesicles containing VSPH7/mAb complexes (yellow dots). Scale bar 1 µm. Values represent mean ± s.e.m. of three independent experiments performed in triplicate. *p < 0.05; **p < 0.01; ***p < 0.001; ****p < 0.0001, ns not significant. Adjusted p values= c GAS = 0.6760 (ns), ARO = 0.3506 (ns); d Anti-Mouse Igs= 0.2224 (*); MBCD = > 0.9999 (ns); MBCD + mAb7C2 = 0.5042 (ns). Statistical significance is based on one-way ANOVA on datasets with Sidak’s multiple comparisons tests.
Fig. 4
Fig. 4. VSPs are released into microvesicles.
a Total antibodies against Giardia VSP417- expressing trophozoites detected by ELISA in sera from infected gerbils at different dpi. Values represent relative optical density. b, c Extreme Resolution HI-SEM of VSP417 trophozoites recovered from the small intestine at 12 dpi. Extensive membrane projections emerging from the cell flange and the ventral disc are shown (arrows). A vesicle budding from a flagellum (arrowhead) and membrane projections at the end of a flagellum (asterisks) are observed. Scale bar 1 µm. d Representative cytograms showing the distribution shift from VSP417(+) to VSP417(−) populations during animal infections with a VSP417 clone. e Percentage of intestinal trophozoites recognised by different anti-VSP mAbs at 11 dpi. f Negative staining of purified microvesicles obtained trophozoites of clone VSP417 incubated with mAb 7C2 for 4 h. Scale bar, 200 nm. g Effects of different concentrations of extracellular calcium, EGTA, BAPTA-AM and the Ca2+ ionophore A23187 on antigenic switching of VSP417-expressing trophozoites grown in the presence of a control mAb (red) or of mAb 7C2 (blue) for 72 h. h The effects of anti-VSP mAb 7C2, a control antibody and the calcium ionophore A23187 on the intracellular levels of Ca2+ in VSP417-expressing cells are shown. Each line corresponds to the mean value of three independent experiments. Arrow indicates the time at which the stimulus was added. Values in other panels represent mean ± s.e.m. of three independent experiments performed in triplicate. *p < 0.05; **p < 0.01; ***p < 0.001; ****p < 0.0001, ns not significant. Adjusted p value= g BAPTA-AM 50 µM = 0.8151 (ns). Statistical significance is based on one-way ANOVA on datasets with Tukey’s multiple comparisons tests.

References

    1. Deitsch KW, Lukehart SA, Stringer JR. Common strategies for antigenic variation by bacterial, fungal and protozoan pathogens. Nat. Rev. Microbiol. 2009;7:493–503. doi: 10.1038/nrmicro2145. - DOI - PMC - PubMed
    1. Ross DTR. A case of sleeping sickness studied by precise enumerative methods: Regular periodical increase of the parasites disclosed. Proc. R. Soc. Lond. B. 1910;82:411–415. doi: 10.1098/rspb.1910.0035. - DOI - PMC - PubMed
    1. Turner CMR. A perspective on clonal phenotypic (antigenic) variation in protozoan parasites. Parasitology. 2002;125:S17–S23. doi: 10.1017/S0031182002002470. - DOI - PubMed
    1. Adam RD. Biology of Giardia lamblia. Clin. Microbiol Rev. 2001;14:447–475. doi: 10.1128/CMR.14.3.447-475.2001. - DOI - PMC - PubMed
    1. Nash TE, Aggarwal A. Cytotoxicity of monoclonal antibodies to a subset of Giardia isolates. J. Immunol. 1986;136:2628–2632. doi: 10.4049/jimmunol.136.7.2628. - DOI - PubMed

Publication types