. 2023 May;617(7961):623-628.
doi: 10.1038/s41586-023-06008-5. Epub 2023 May 3.

The electron-proton bottleneck of photosynthetic oxygen evolution

Affiliations

The electron-proton bottleneck of photosynthetic oxygen evolution

Paul Greife et al. Nature. 2023 May.

Abstract

Photosynthesis fuels life on Earth by storing solar energy in chemical form. Today's oxygen-rich atmosphere has resulted from the splitting of water at the protein-bound manganese cluster of photosystem II during photosynthesis. Formation of molecular oxygen starts from a state with four accumulated electron holes, the S4 state-which was postulated half a century ago1 and remains largely uncharacterized. Here we resolve this key stage of photosynthetic O2 formation and its crucial mechanistic role. We tracked 230,000 excitation cycles of dark-adapted photosystems with microsecond infrared spectroscopy. Combining these results with computational chemistry reveals that a crucial proton vacancy is initally created through gated sidechain deprotonation. Subsequently, a reactive oxygen radical is formed in a single-electron, multi-proton transfer event. This is the slowest step in photosynthetic O2 formation, with a moderate energetic barrier and marked entropic slowdown. We identify the S4 state as the oxygen-radical state; its formation is followed by fast O-O bonding and O2 release. In conjunction with previous breakthroughs in experimental and computational investigations, a compelling atomistic picture of photosynthetic O2 formation emerges. Our results provide insights into a biological process that is likely to have occurred unchanged for the past three billion years, which we expect to support the knowledge-based design of artificial water-splitting systems.


Conflict of interest statement

The authors declare no competing interests.

Figures

Fig. 1
Fig. 1. Reaction cycle of photosynthetic oxygen evolution.
a, Model of the S-state cycle with sequential electron and proton removal from the oxygen-evolving site,,. Starting in the dark-stable S1 state, each laser flash initiates oxidation of the primary chlorophyll donor (P680+ formation) followed by electron transfer from a tyrosine sidechain (TyrZ oxidation) and—in three of the four S-state transitions—manganese oxidation, until four electron holes (oxidizing equivalents) are accumulated by the Mn4Ca-oxo cluster in its S4 state. b, Example of tracing S-state transitions using IR absorption changes after excitation with visible-wavelength laser flashes (at zero on the time axis). The absorption changes (ΔA) are provided in optical density (OD) units. The IR transients at 1,384 cm−1 reflect symmetric stretching vibrations of carboxylate protein sidechains that sense changes in the oxidation state of manganese in the microsecond and millisecond time domain (coloured lines are simulations with time constants provided in Supplementary Table 2). Note that the scale on the x axis is linear below t = 0 and logarithmic above t = 0. c, The Mn4Ca cluster (Mn, violet; Ca, pink) in the S3 state with six bridging oxygens, the redox-active tyrosine (TyrZ), and further selected protein sidechains as well as water molecules (red spheres), based on crystal structures. Assignment to polypeptide chains, numbering of the atoms of Mn4Ca-oxo and water molecules and hydrogen-bond distances are indicated in Supplementary Fig. 1. The two oxygens atoms that form the O–O bond in the oxygen-evolving S3 → S0 transition are indicated by red arrows. Source data
Fig. 2
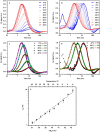
Fig. 2. Oxygen-evolution transition traced by FTIR.
a, IR time traces at selected wavenumbers, demonstrating the delayed onset of O–O bond formation (1,381 cm−1) and reversible changes assignable to transient sidechain deprotonation (1,571 cm−1 and 1,707 cm−1). The corresponding wavenumbers in the spectra in bd are marked with coloured asterisks. bd, DAS corresponding to the proton release phase (tH+ = 340 µs, blue line) and the oxygen-evolution phase (tO2 = 2.5 ms, green) as well as the steady-state difference spectrum of the S3 → S0 + O2 transition (dashed black line). Red areas b,d mark inverted 340 µs DAS and 2.5 ms DAS, indicating reversible behaviour; purple shaded areas in c highlight the similarity of the 2.5 ms DAS and the steady-state spectrum, in line with the assignment to non-transient changes in Mn oxidation state. Scale bars, 50 µOD. Source data
Fig. 3
Fig. 3. Proton and electron transfer steps of the oxygen-evolution transition.
a, Schematic summary of experimental findings on reaction intermediates, time constants (reciprocal rate constants), enthalpic and entropic contribution of the activation energy (see Extended Data Fig. 5), and S-state assignment. The entropic contribution is the product of the entropy of activation (Sact) and the absolute temperature that corresponds to 20 °C (T0 = 293.15 K). Key features are highlighted with orange circles, the two oxygen atoms from ‘substrate water’ are shown in red, and charge-transfer events are indicated with arrows (red, electron transfer; blue, proton transfer). Out of the four Mn ions of the Mn4Ca cluster, only the three Mn ions (Mn1, Mn3 and Mn4) that have accumulated oxidizing equivalents (holes) in preceding S-state transitions and are ‘discharged’ concomitantly with O2 formation are shown. The fourth hole transiently residing on the oxidized TyrZ (denoted here as YZ+) is filled by electron transfer from a substrate-water oxygen in the S3S4 transition. b,c, The rate-constant processes depicted in a, S3+S3S3 (b) and S3S4 (c), are assigned to atomistic events, facilitated by computational results. The dotted blue circles highlight the creation of a proton vacancy induced by TyrZ oxidation and activating Asp61 as a proton acceptor in the S3S4 transition via movement of the Lys317 sidechain. d, Energy values associated with MEP calculations and internuclear distances (top graph, dashed lines) as well as spin populations of the Mn ions, atoms and residues species  (bottom graph, solid lines) that characterize the peroxide formation. See Extended Data Figs. 7 and 8, for structures complementing d and describing the complete oxygen-evolution transition.
Extended Data Fig. 1
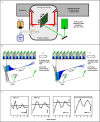
Extended Data Fig. 1. Experimental setup, timing scheme, and infrared data confirming synchronized reaction-cycle advancement.
a. Schematic representation of the experimental setup. A standard FTIR instrument was modified with an extended, air-tight sample chamber to harbor the automated sample exchange system and combined with a pulsed nanosecond laser. After removal of water vapor from ambient air (dry air generator), the dry gas stream flooded the sample changer. Within the sample changer the temperature was kept a constant 10 °C by a flow of cold nitrogen gas. Stepping motors moving the sample state in x-y direction facilitated laser-flash excitation (and data collection) at 1800 spots of dark-adapted PSII samples. b. Timing scheme of the experiment. At each sample spot, 10 sequential flashes were applied while the interferometer had been set to a specific mirror position. The IR detector recorded 8 ms before each flash, 130 ms after each flash and waited 570 ms between the flashes without recording data. Once the detector had finished recording after the tenth flash, the sample changer moved to a ‘fresh’ dark-adapted sample spot and the interferometer mirror moved to a new position within about 1 s. The 10-flash sequence was applied again at the new positions and the whole timing sequence was repeated numerous times. c. By application of 10 sequential laser flashes, the PSII can cycle up to 2.5 times through its S-state cycle. The synchronized advancement in the S-state cycle is verified by a period-of-four pattern in the infrared absorption changes (here averaged from 50–130 ms after the laser flash for 4 selected wavenumbers). Solid lines show the data points and the grey crosses represent a simulation using the deconvolved S-States with the derived miss factor and starting populations. Scale bars correspond to 25 µOD.
Extended Data Fig. 2
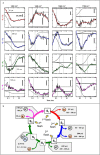
Extended Data Fig. 2. Select infrared transients demonstrating that previously identified rate constants are resolved also in the step-scan FTIR experiment.
a. Transients at select wavenumbers for the four deconvolved S-state transitions. These transients are shown to demonstrate that previously identified reaction kinetics are recoverable in this work. Smooth colored lines represent multi-exponential simulation (least-square fit) of the IR transients. Grey dashed lines mark the identified time constants while grey transients show the respective simulated contributions to the total transient. In each panel, the respective pre-flash level is indicated by a black line. The complete set of simulation parameters can be found in Supplementary Table 2. b. S-state cycle with previously determined time constants values (see Supplementary Table 3) and those found in this work (in parenthesis).
Extended Data Fig. 3
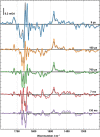
Extended Data Fig. 3. Infrared spectra at various times after application of the laser that initiates the oxygen-evolution transition.
The grey line shows the spectral changes induced by the 3rd laser flash applied to dark-adapted PSII. The colored lines are corrected (deconvolved) for imperfect advancement in the S-state cycle as detailed in the Supplementary Material.
Extended Data Fig. 4
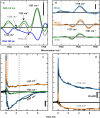
Extended Data Fig. 4. Carbonyl band spectra and IR transients between 1695 and 1750 cm−1 for the oxygen-evolution transition (S3->S4->S0).
a. Decay-associated spectra of the 340 µs component and of the 2.5 ms component, the latter before (grey line) and after (green line) correction for acceptor side contributions. The acceptor side correction results in three positive peaks for the 2.5 ms component, indicating that band shift cannot explain these three peaks at 1730 cm−1, 1722 cm−1 and 1707 cm−1. b. Spectra at selected times for the oxygen-evolution transition induced by the 3rd laser flash before (grey lines) and after (colored lines) deconvolution. The high level of similarity indicates that in this spectral region the deconvolution correction is uncritical as it hardly modifies the 3rd-flash data. c. Transients displaying reversible behaviour of the 340 µs and 2.5 ms phases reflecting carboxylate deprotonation and reprotonation. d. Transient changes assignable to acceptor side contributions. All scale bars correspond to 25 µOD. For details on correction for acceptor side contributions and S-state deconvolution, see Supplementary Information.
Extended Data Fig. 5
Extended Data Fig. 5. Time-resolved O2-polarography and determination of activation energy of the O2-formation step for cyanobacterial PSII from T. elongatus.
The time courses (transients) of O2-evolution were (i) measured by time-resolved O2-polarography for a PSII layer deposited by centrifugation on a bare platinum electrode and (ii) simulated on grounds of a physical diffusion model, including a least-square fit of the simulation parameters (see Methods section). The complete set of simulation parameters is provided in Supplementary Fig. 6. a. O2-evolution transients at temperatures ranging from −5 °C to +40 °C. Each transient was obtained by averaging all the O2-transients induced by 230 flashes of visible light. b. The same transients as shown before but normalized at the respective peak value. In c and d, selected transients are shown (black symbols) with their respective fit results (colored lines), either with original amplitudes (in c) or normalized to unity (in d). e. Arrhenius plot of τox, the time constant (reciprocal rate constant) of the oxygen evolution reaction. This plot delivers an Arrhenius activation energy, Eact, of 335+/−10 meV (7.73+/−0.23 kcal/mol) with a pre-exponential frequency factor, A, of 2.2 • 108 s−1. After determination of activation energy and pre-exponential factor following the classical approach of Arrhenius, the enthalpy of activation (Hact), entropy of activation (Sact) were determined using the Eyring equation of transition-state theory (also called Eyring-Polanyi equation) with a transmission coefficient of unity, resulting in values of 310+/−9 meV (7.15+/−0.21 kcal/mol) for Hact and of 284+/−9 meV (6.55+/−0.21 kcal/mol) for T0Sact (with T0 = 20 °C). The applicability of transitions state theory is discussed in Supplementary Information SII.8. The error bars provide the standard deviation of the mean value calculated for three independent experiments at each temperature; the confidence intervals of the energy values are derived from the probable error in the slope of the regression line (broken line).
Extended Data Fig. 6
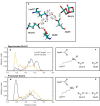
Extended Data Fig. 6. The two most stable hydrogen-bonds of protonated O6 (in both S3 and S3′ state).
Upon oxidation of TyrZ (Tyr161), the relative stability of the two reported conformers is reversed, conformer-a becoming more stable than conformer-b, thus favouring the oxyl radical formation as described elsewhere. In both cases, the deprotonated Asp61 is stably interacting with the W1 water molecule. Relevant distances are highlighted by thin lines and reported in both panels for comparison. Manganese atoms are shown in pink, calcium as cyan sphere, oxygen in red, carbon in cyan, and hydrogen in white.
Extended Data Fig. 7
Extended Data Fig. 7. Atomic and electronic rearrangements leading to peroxide formation.
The top panels show molecular sketches of the atomic and electronic motions associated with the energy barriers to overcome along the peroxide formation reaction shown in the bottom panel. The values for the indicated enthalpies of activation and stabilization are: ΔH*1, +7.0 kcal/mol; ΔH*2, +5.8 kcal/mol; ΔH1, −19 kcal/mol; ΔH2, +1 kcal/mol .
Extended Data Fig. 8
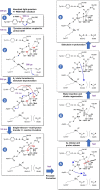
Extended Data Fig. 8. Complete picture of events in the oxygen-evolution transition.
Proton and electron transfers are highlighted by blue and red arrows, whereas relocations of heavy atoms are indicated by black arrows. Substrate oxygen atoms (O5 and O6) are depicted in red. The mechanism of the steps 1–5 was investigated in the present study, while the events occurring between the steps 5 and 7 (i.e. the release of molecular oxygen after the peroxide bond formation and the Mn4CaO5 cluster restoration) were described in ref. . The events in the transition from 7 to 8 are plausible, but currently not backed up by calculations. The eight panels illustrate the following sequence of events: Oxidation of Tyr161 in the S3 state, which is coupled to the proton transfer from Tyr161 to His190 (1), induces a conformational change involving the side chain of Lys317, resulting in the approach of Lys317 to Glu312 and deprotonation of Glus312 (2) within about 340 μs after the laser flash. Within the next 2.5 ms, the transfer of one electron from the O6 atom to Tyr161 coupled to a concerted Grotthus-type relocation of three protons (3), resulting in S4 formation by radicalization of O6 coupled to protonation of Asp61 (4). Thereafter, the O6 radical forms a peroxide bond with the oxygen atom O5 (5) and the subsequent deprotonation of Asp61 and release of molecular oxygen. The vacancy site formed by the oxygen evolution step is rapidly refilled with a water molecule coordinated to the Ca2+ ion, with simultaneous proton transfer to the hydroxide ion bound to Mn4, and insertion of W5 into the coordination sphere of Ca2+ (6). The restoration of the Mn4CaO5 in the S0 state is completed by the deprotonation of a water molecule coordinated to Mn4, relocation of Lys317 close to Asp61, and protonation of Glu312 (7 and 8).
Extended Data Fig. 9
Extended Data Fig. 9. Conformations sampled by D1-Asp61, D2-Glu312, and D2-Lys317.
a. Sticks representation of the Mn4Ca cluster and neighboring residues (Asp61, Glu65, Glu312 and Lys317) for the two-flash state (S3 state) of Photosystem II from the crystallographic model of Kern et al. (PDB ID: 6DHO). A Cl ion as well as two water oxygens are also shown as balls. b. Distributions of distances between Lys317 and the two residues Asp61 and Glu312 sampled along 50 ns of classical MD simulation with both Asp61 and Glu312 deprotonated (simulation for S1 geometry). c. Scheme of a representative configuration of Asp61, Glu65, Glu312 and Lys317 sampled in the S1 simulation. In this configuration Lys317 is in close contact with deprotonated Glu312. d. Distributions of distances between Lys317 and the two residues Asp61 and Glu312 sampled along 50 ns of classical MD simulation with deprotonated Asp61 and protonated Glu312 (simulation for S2). e. Scheme of a representative configuration of Asp61, Glu65, Glu312 and Lys317 sampled in the S2 simulation. Lys317 strongly interacts with Asp61, while protonated Glu312 interacts with Glu65.

Comment in

Similar articles

Cited by

References

    1. Kok B, Forbush B, McGloin M. Cooperation of charges in photosynthetic O2 evolution - I. A linear four-step mechanism. Photochem. Photobiol. 1970;11:457–475. - PubMed
    1. Junge W. Oxygenic photosynthesis: history, status and perspective. Q. Rev. Biophys. 2019;52:e1. - PubMed
    1. Fischer WW, Hemp J, Johnson JE. Manganese and the evolution of photosynthesis. Orig. Life Evol. Biosph. 2015;45:351–357. - PubMed
    1. Cox N, Pantazis DA, Lubitz W. Current understanding of the mechanism of water oxidation in photosystem II and its relation to XFEL data. Annu. Rev. Biochem. 2020;89:795–820. - PubMed
    1. Noguchi T, Suzuki H, Tsuno M, Sugiura M, Kato C. Time-resolved infrared detection of the proton and protein dynamics during photosynthetic oxygen evolution. Biochemistry. 2012;51:3205–3214. - PubMed

Publication types