. 2023 May;617(7961):629-636.
doi: 10.1038/s41586-023-06038-z. Epub 2023 May 3.

Structural evidence for intermediates during O2 formation in photosystem II

Affiliations

Structural evidence for intermediates during O2 formation in photosystem II

Asmit Bhowmick et al. Nature. 2023 May.

Erratum in

  • Author Correction: Structural evidence for intermediates during O2 formation in photosystem II.
    Bhowmick A, Hussein R, Bogacz I, Simon PS, Ibrahim M, Chatterjee R, Doyle MD, Cheah MH, Fransson T, Chernev P, Kim IS, Makita H, Dasgupta M, Kaminsky CJ, Zhang M, Gätcke J, Haupt S, Nangca II, Keable SM, Aydin AO, Tono K, Owada S, Gee LB, Fuller FD, Batyuk A, Alonso-Mori R, Holton JM, Paley DW, Moriarty NW, Mamedov F, Adams PD, Brewster AS, Dobbek H, Sauter NK, Bergmann U, Zouni A, Messinger J, Kern J, Yano J, Yachandra VK. Bhowmick A, et al. Nature. 2024 Feb;626(7999):E12. doi: 10.1038/s41586-024-07099-4. Nature. 2024. PMID: 38291188 Free PMC article. No abstract available.

Abstract

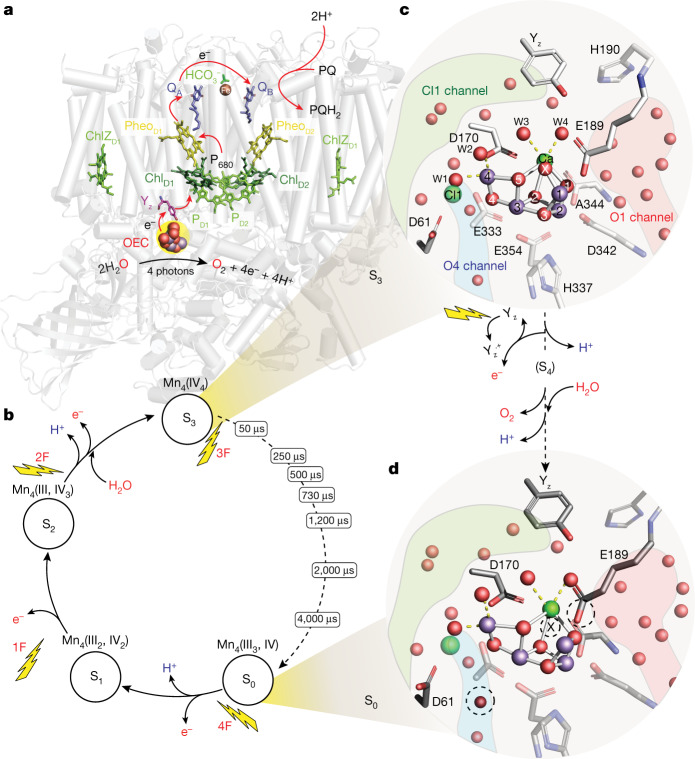
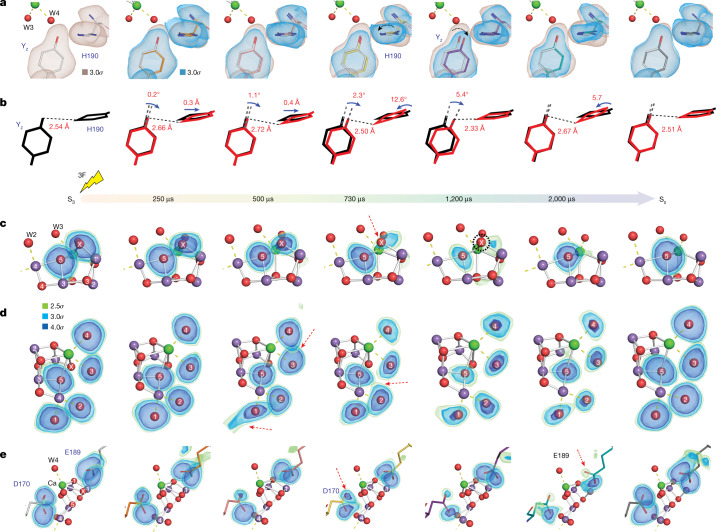
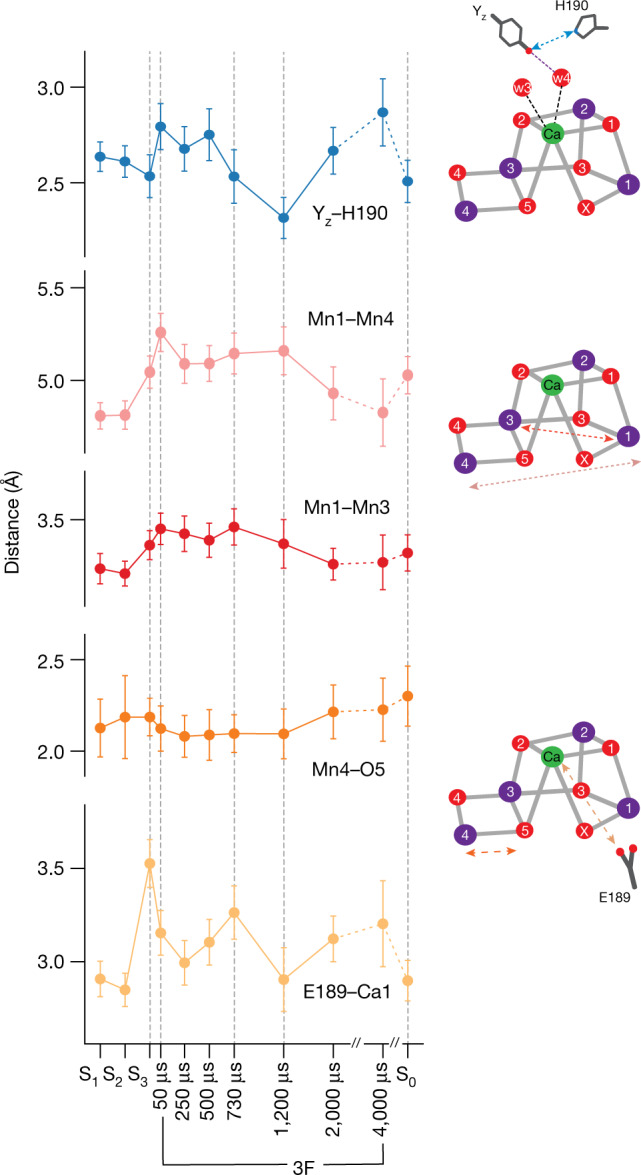
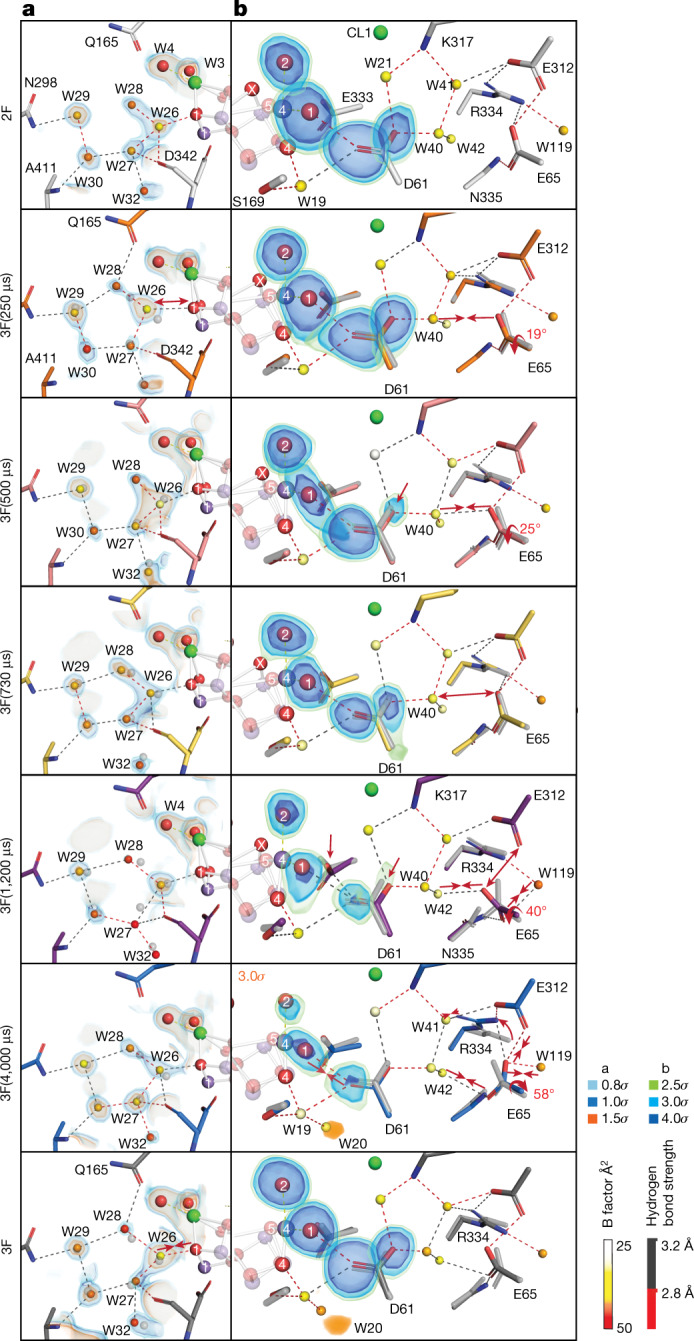
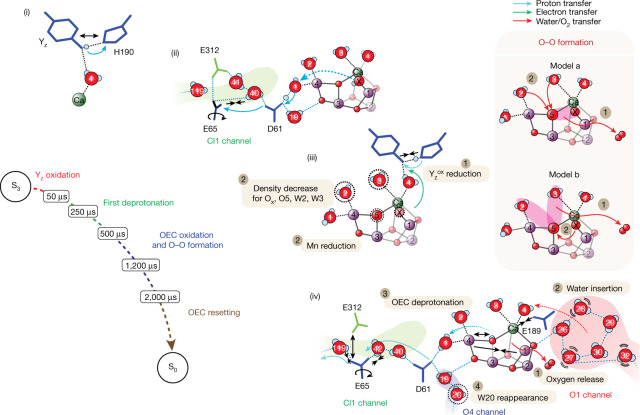
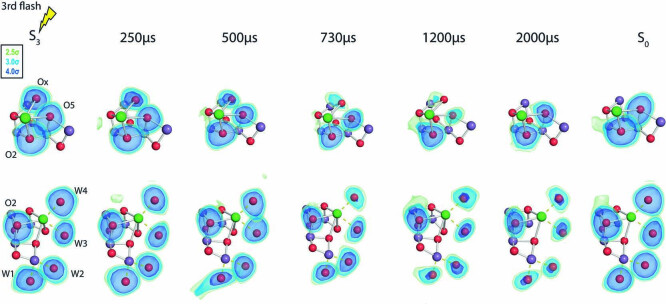
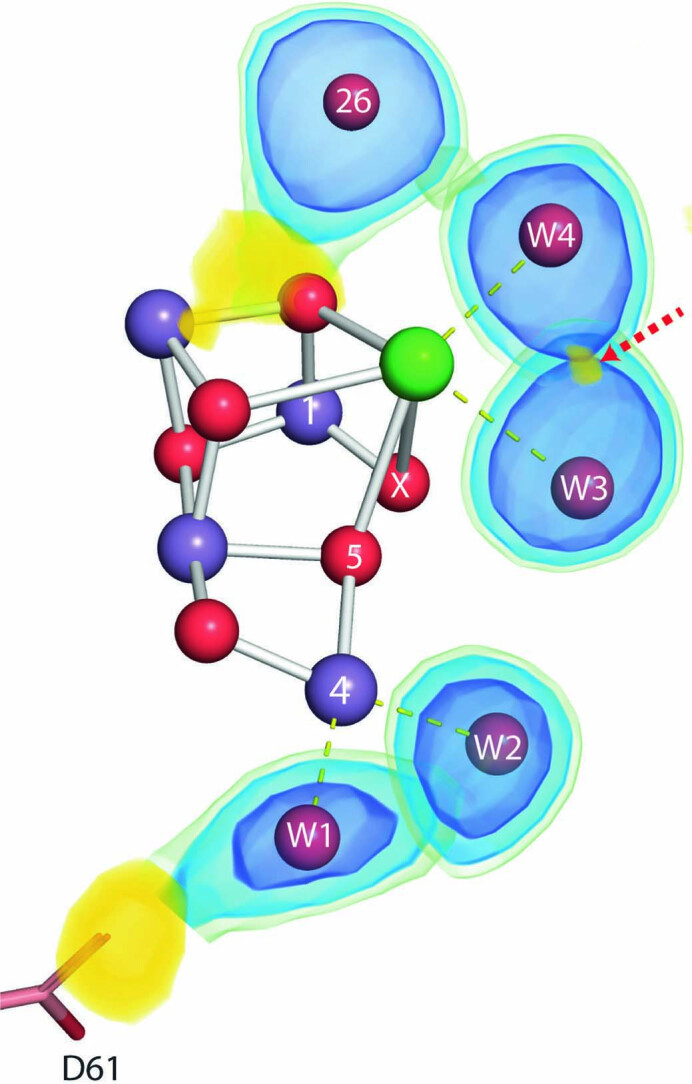
In natural photosynthesis, the light-driven splitting of water into electrons, protons and molecular oxygen forms the first step of the solar-to-chemical energy conversion process. The reaction takes place in photosystem II, where the Mn4CaO5 cluster first stores four oxidizing equivalents, the S0 to S4 intermediate states in the Kok cycle, sequentially generated by photochemical charge separations in the reaction center and then catalyzes the O-O bond formation chemistry1-3. Here, we report room temperature snapshots by serial femtosecond X-ray crystallography to provide structural insights into the final reaction step of Kok's photosynthetic water oxidation cycle, the S3→[S4]→S0 transition where O2 is formed and Kok's water oxidation clock is reset. Our data reveal a complex sequence of events, which occur over micro- to milliseconds, comprising changes at the Mn4CaO5 cluster, its ligands and water pathways as well as controlled proton release through the hydrogen-bonding network of the Cl1 channel. Importantly, the extra O atom Ox, which was introduced as a bridging ligand between Ca and Mn1 during the S2→S3 transition4-6, disappears or relocates in parallel with Yz reduction starting at approximately 700 μs after the third flash. The onset of O2 evolution, as indicated by the shortening of the Mn1-Mn4 distance, occurs at around 1,200 μs, signifying the presence of a reduced intermediate, possibly a bound peroxide.


Conflict of interest statement

The authors declare no competing interests.

Figures

Fig. 1
Fig. 1. An overview of PS II and the electron donor site where water oxidation takes place.
a, The structure of PS II with the membrane-embedded helices and the membrane extrinsic regions on the lumenal side of PS II shown in gray. The main electron transfer components are shown in colour, which include the reaction center chlorophylls (P680), pheophytins, acceptor quinones QA and QB, redox-active tyrosine Yz and the catalytic Mn4CaO5 cluster. The Yz and Mn4CaO5 cluster are the cofactors of the electron donor site. b, Kok cycle of the water oxidation reaction taking place at the donor site that is sequentially driven by charge separations in the reaction center P680 induced by the absorption of photons (nanosecond light flashes, 1F–4F) in the antenna system of PS II. Room temperature X-ray crystallography data were collected at the time points indicated during the S3→S0 transition. c,d, The structure of the OEC in the S3 (c) and S0 (d) states and the sequence of events occurring between them. Mn, purple; Ca2+, green; O, red. W1, -2, -3 and -4 are water ligands of Mn4 and Ca. The relevant channels for water and proton transfer (O1, O4 and Cl1) are indicated as red, blue and green shaded areas, respectively. The dotted circles mark structural differences between the S3 and S0 states.
Fig. 2
Fig. 2. mFobs − DFcalc electron density omit map of key components of the redox active donor site of PS II at five time points along the S3→S0 transition as well as the S3 and S0 states.
a, Residues D1-Y161 (Yz) and D1-H190. The omit map from the S3 state reference is shown in light brown for comparison with the time point data (blue). b, A simplified representation of the structural changes observed at the Yz region. c, Omit density of atoms O5 and Ox of the OEC. d, Omit density of atoms O5 and the terminal water ligands W1, W2, W3 and W4 of the OEC. e, Omit density of carboxylate oxygen atoms of D1-E189 and D1-D170. All omit maps shown in a and ce were generated by omitting the atom or residue of interest individually, and only the primary component (that is, the state that is advancing to S0) was used. Notable features are highlighted with red arrows and black dashed circle. All omit maps shown are contoured at 2.5σ, 3σ and 4σ using the colour scheme annotated in d for easier visualization. See also Supplementary Information Video 1.
Fig. 3
Fig. 3. Distance changes between selected atoms/residues in the OEC during the S3→S0 transition.
All distances are taken from the refined component of each time point (that is, the state that is advancing to the S0 state). Error bars are calculated from the end/rapid approach described in Methods and are an upper limit. Data here are shown as mean values ± standard deviation. The error bars for each time point were obtained from n = 100 independent END/RAPID refinements. More details about the END/RAPID procedure can be found in Methods. Dashed arrows in the schematics of the OEC on the right indicate the location of the individual distances. Mn is shown as purple spheres, and O is shown as red spheres.
Fig. 4
Fig. 4. Structural changes in select regions of the water and proton channels of PS II during the S3→S0 transition.
a, The terminus of the O1 channel near the OEC that includes the group of five waters (W26–W30) in this region. Overlaid is the 2mFobs − DFcalc electron density map contoured at 0.8σ, 1.0σ and 1.5σ. b, The O4 and Cl1 channels (branch A) that include the D1-D61 and D1-E65/D2-E312 region that is suggested to function as a proton gate. Overlaid are mFobs − DFcalc omit maps for W1, W2 and D61 shown at 2.5σ, 3.0σ and 4.0σ. Also shown is the Fobs(time point) − Fobs(2F) difference density map within a 1.5-Å radius of W19/W20/W48 in the O4 channel at 3σ (orange map). The observed rotation angle at the side chain of E65 at particular time points is calculated with respect to the corresponding side chain position at the 2F state. Major changes are highlighted with an arrow or dashed circle. All waters are coloured by their B factors according to the diverging colour scheme shown in the figure. Important hydrogen-bond interactions are shown with a binary colour scheme to indicate strength (distance < 2.8 Å is red and 2.8–3.2 Å is gray).
Fig. 5
Fig. 5. Schematic of the S3→S0 transition and proposed mechanism for O–O formation.
The sequence of events (i–iv) leading to the first deprotonation event, the molecular oxygen release, the water insertion and the second deprotonation event. The OEC atoms are shown in purple (Mn), green (Ca) and red (O). The O1 channel is shown in red, the O4 channel is in blue and the Cl1 channel in green. The ligands of the OEC and the residues forming the water–proton channels are coloured based on the subunit they belong to (D1, blue; D2, green). Possible pathways for proton (cyan arrow), water (red dashed arrow), oxygen (red solid arrow) and electron (green arrow) transfer are depicted. Notable features are highlighted with black arrows. The right tan box shows the suggested models (model a and model b) for O–O bond formation. Oxygen highlighted with magenta indicates the candidate atoms for O–O formation.
Extended Data Fig. 1
Extended Data Fig. 1. mFobs − DFcalc electron density omit map of relevant atoms in the OEC for time points along the S3→S0 reaction.
For comparison of the peak height level, the omit map of the oxygen atom, O2, is also shown. Omit maps for each atom were generated by individually omitting the atom only in the primary conformer in each dataset. The maps are shown at contour levels of 2.5, 3 and 4σ. (a) Omit maps of OX, O5 and O2 (b) Omit maps of W1, W2, W3, W4 and O2. A clear reduction in omit map peak height of OX, O5, W1, W2, W3, W4 is observed with respect to the reference O2 omit map between 730–2000 µs.
Extended Data Fig. 2
Extended Data Fig. 2. mFobs − DFcalc electron density map near the OEC region in the 3F(500 µs) time point.
The map is shown at a contour level of 2.5σ (in yellow). Electron density is observed at this level in-between W3 and W4 (see red arrow), possibly indicating a transient water motion that was also corroborated by the overlap of the omit map densities. For comparison, the individual omit maps of W3 and W4 are also overlaid at 2.5, 3 and 4σ (color scheme same as in Fig. 2 in main text). Stronger electron density is also observed around W1/D61 possibly related to motion involving a proton transfer as discussed in the main text related to Fig. 2. Electron density around the O1 is possibly related to changes observed in the W26-W30 (referred to as the ‘water wheel’ region) in this time point (discussed in main text related to Fig. 4).
Extended Data Fig. 3
Extended Data Fig. 3. Comparing B-factors of key waters in the water wheel region of the O1 channel in the S3→S0 transition (W27, W28, W32) against a reference water (W29) for time points shown in Fig. 4 in the main text.
The B-factor distribution of all the channel waters are overlaid for each time point for comparison. The y-axis values of the marker points for the 4 waters are just placeholders. There is a stark shift in the relative B-factor values of W27, W28 and W32 in the 3F(1200 µs) time point which coincides with the disappearance of OX.

Comment in

References

    1. Kok, B., Forbush, B. & McGloin, M. Cooperation of charges in photosynthetic O2 evolution. 1. A linear four-step mechanism. Photochem. Photobiol.11, 457–475 (1970). - DOI - PubMed
    1. Yano, J. & Yachandra, V. K. Mn4Ca cluster in photosynthesis: where and how water is oxidized to dioxygen. Chem. Rev.114, 4175–4205 (2014). - DOI - PMC - PubMed
    1. Cox, N., Pantazis, D. A., Neese, F. & Lubitz, W. Biological water oxidation. Acc. Chem. Res.46, 1588–1596 (2013). - DOI - PubMed
    1. Kern, J. et al. Structures of the intermediates of Kok’s photosynthetic water oxidation clock. Nature563, 421–425 (2018). - DOI - PMC - PubMed
    1. Suga, M. et al. An oxyl/oxo mechanism for oxygen-oxygen coupling in PSII revealed by an x-ray free-electron laser. Science366, 334–338 (2019). - DOI - PubMed

Publication types