. 2023 May;617(7961):599-607.
doi: 10.1038/s41586-023-06036-1. Epub 2023 May 3.

Glioblastoma remodelling of human neural circuits decreases survival

Affiliations

Glioblastoma remodelling of human neural circuits decreases survival

Saritha Krishna et al. Nature. 2023 May.

Abstract

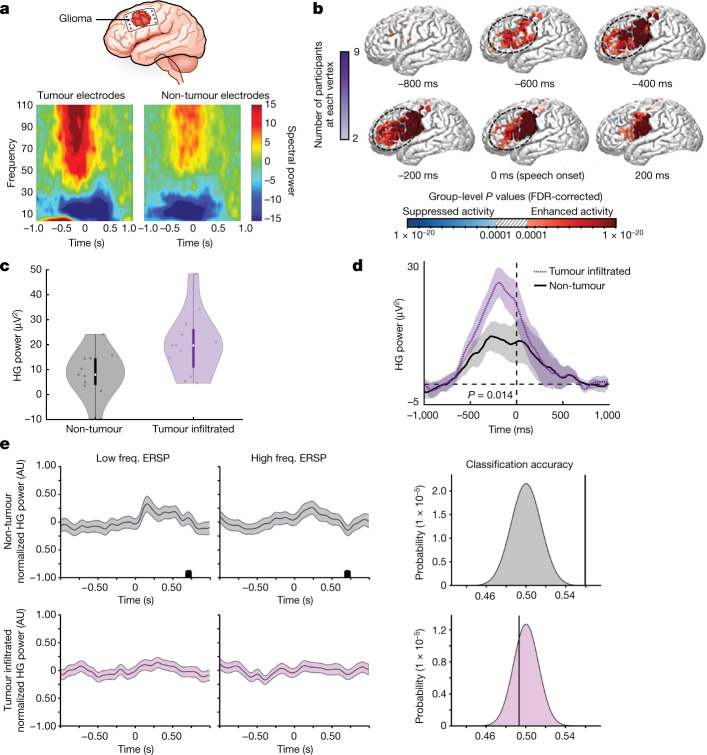
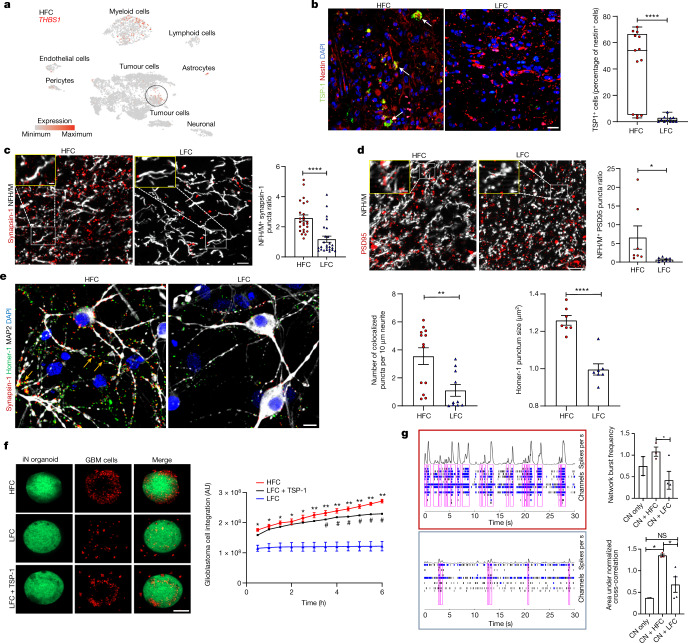
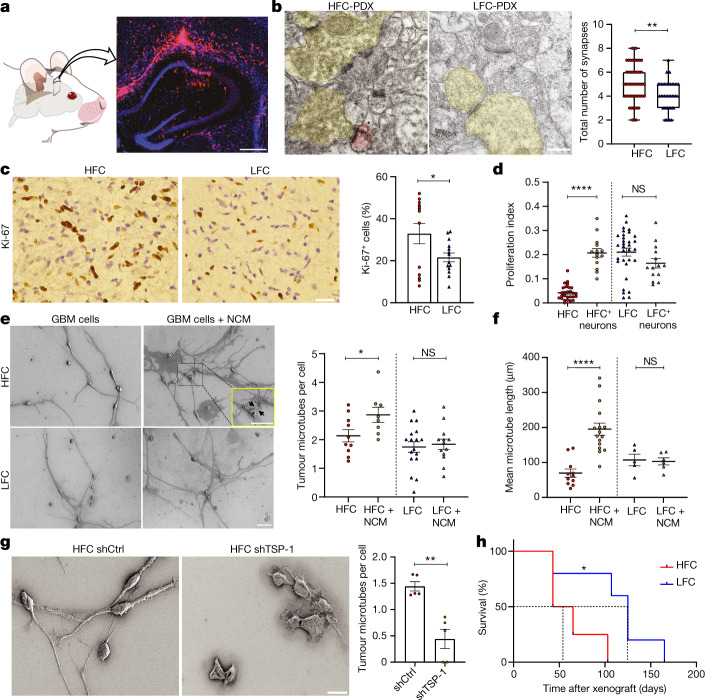
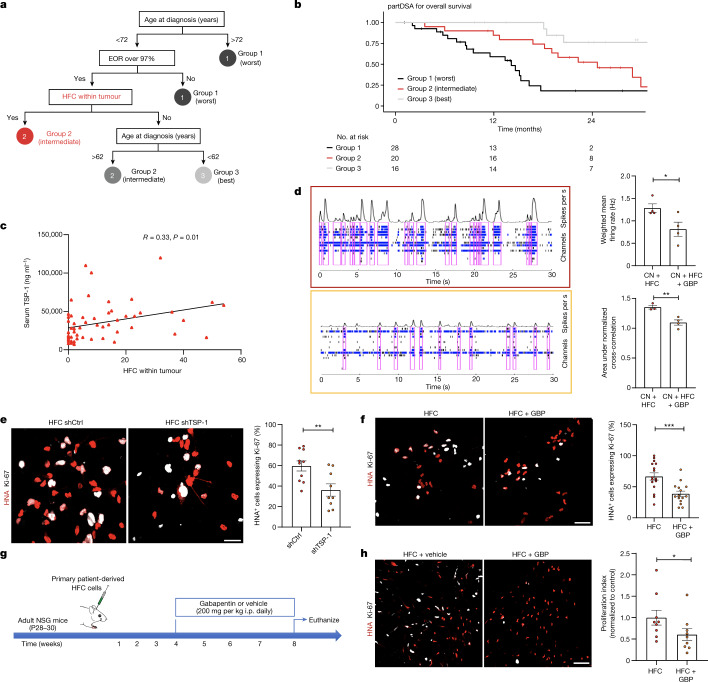
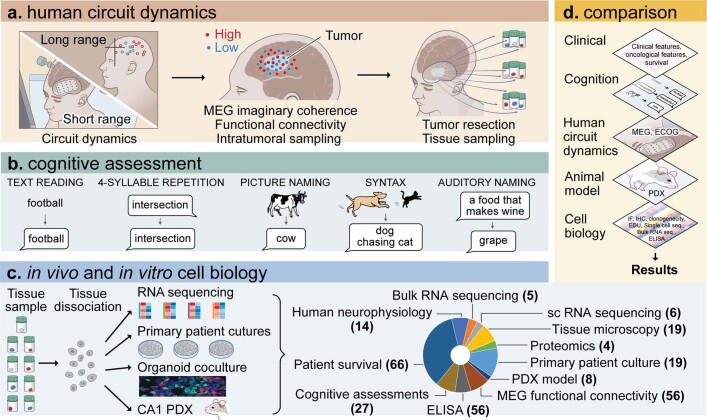
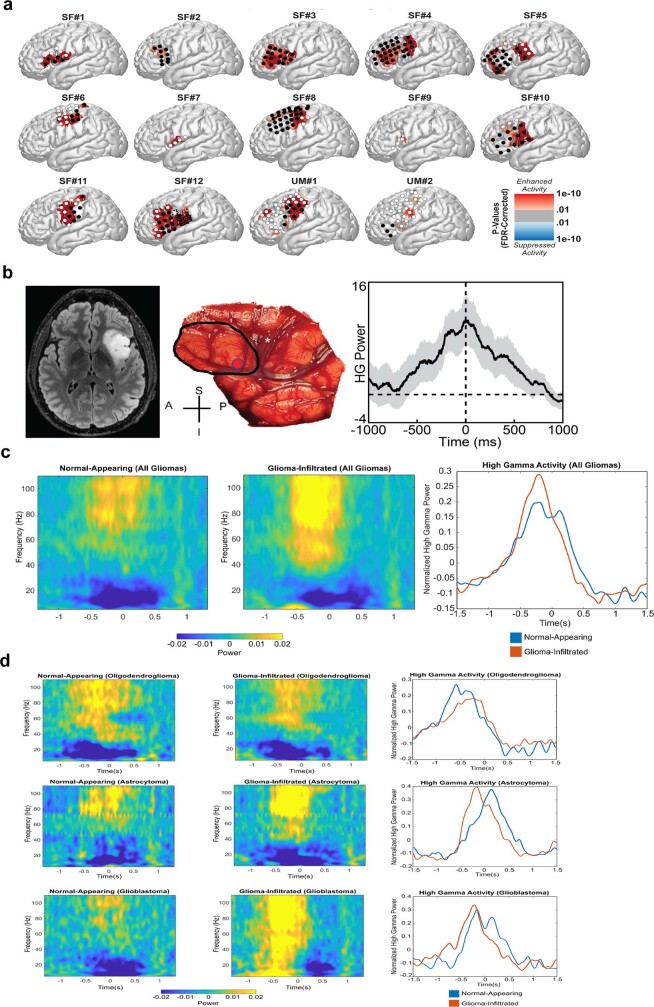
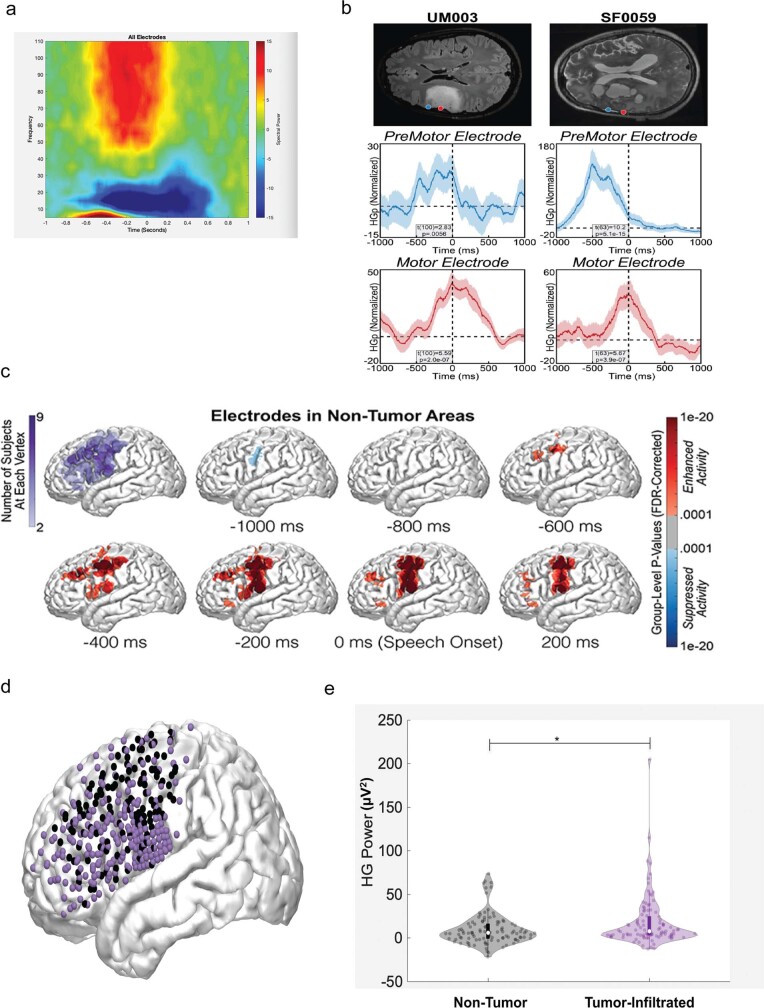
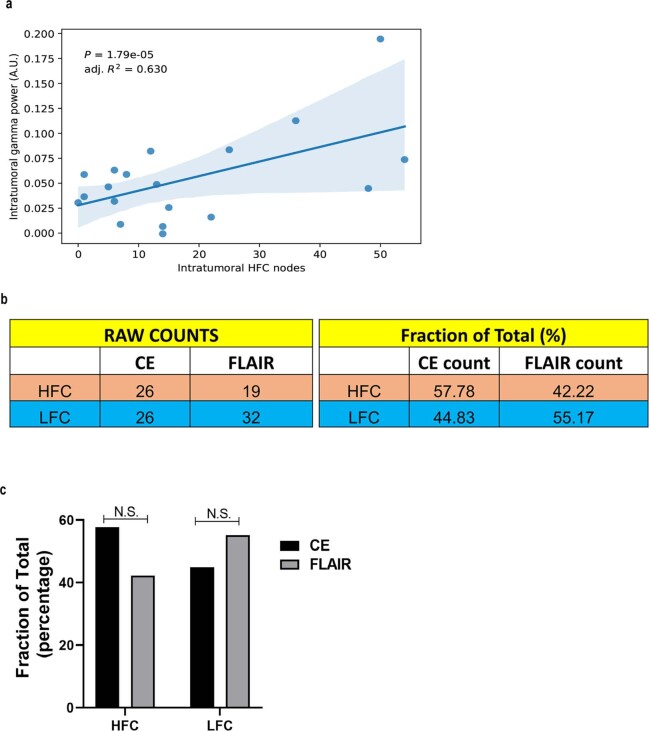
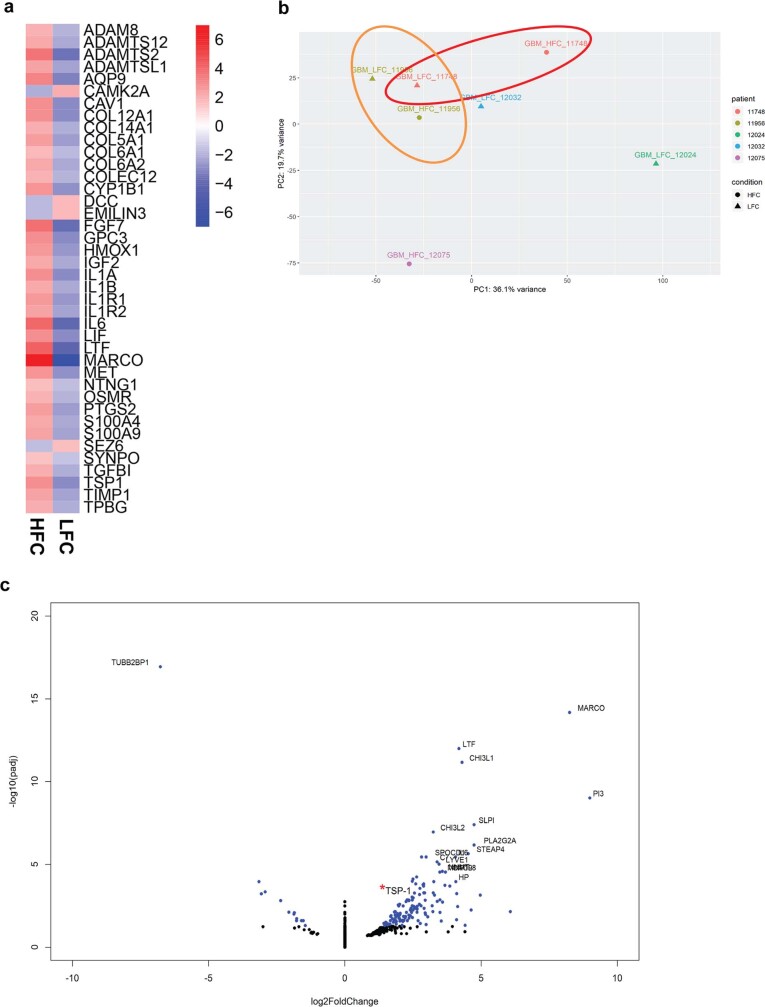
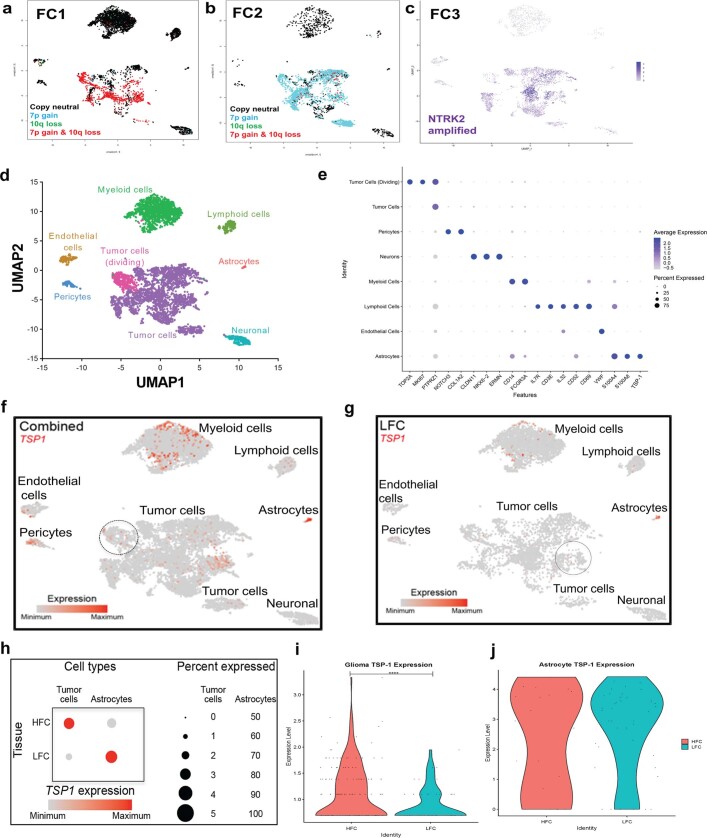
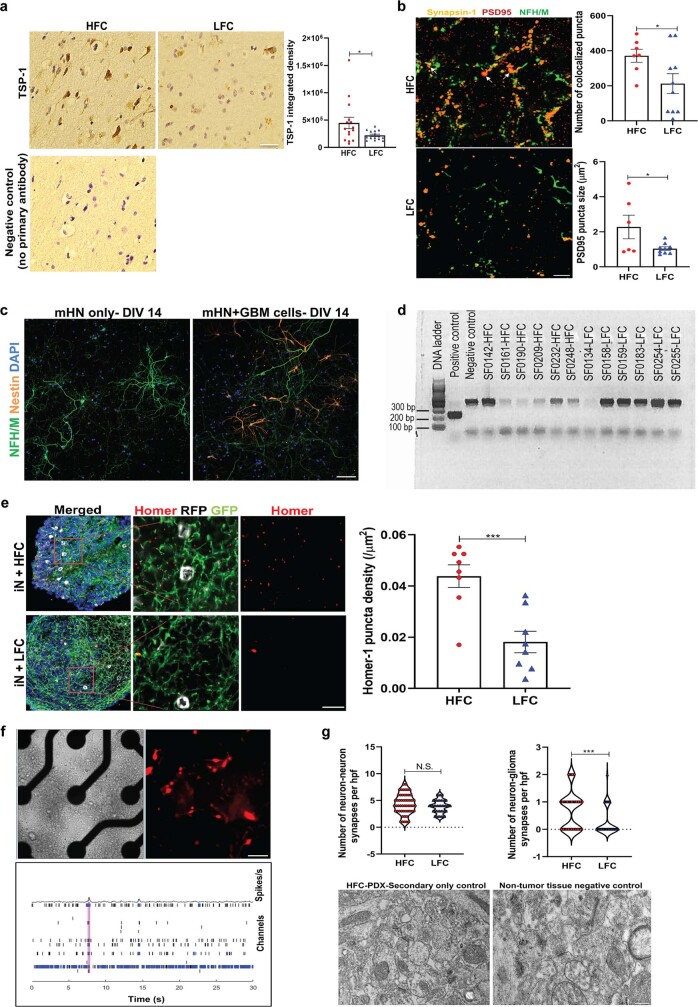
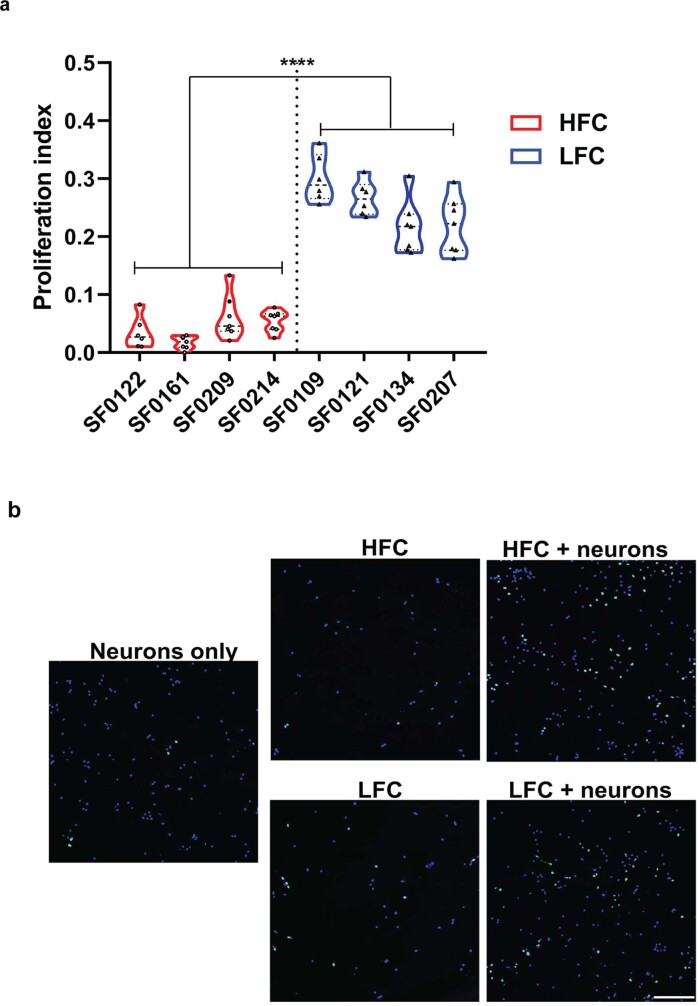
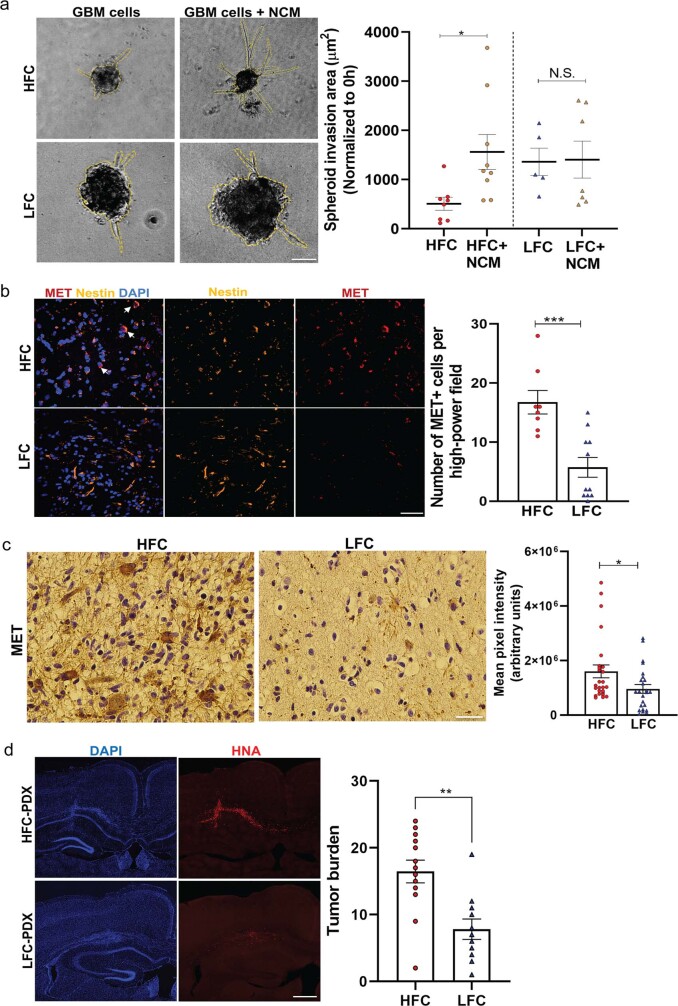
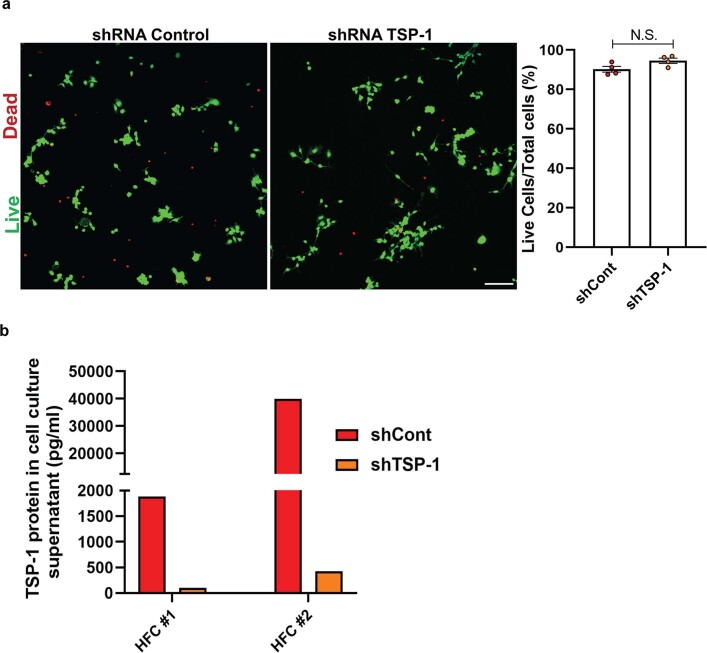
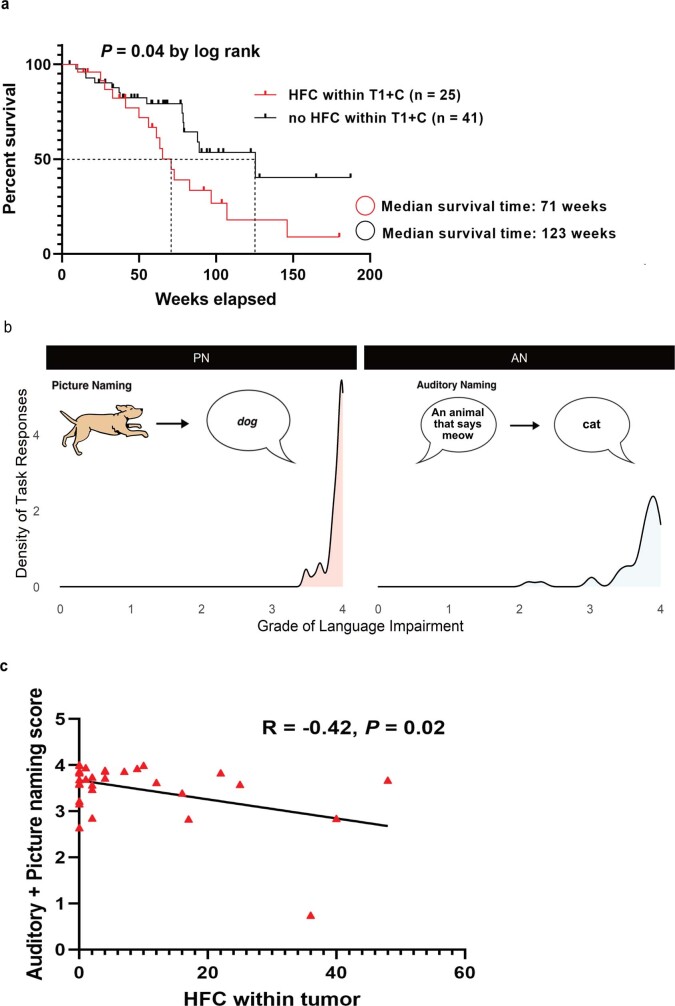
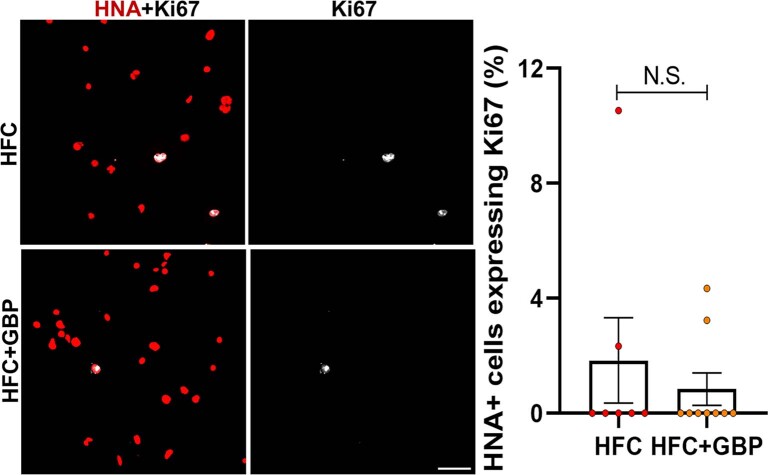
Gliomas synaptically integrate into neural circuits1,2. Previous research has demonstrated bidirectional interactions between neurons and glioma cells, with neuronal activity driving glioma growth1-4 and gliomas increasing neuronal excitability2,5-8. Here we sought to determine how glioma-induced neuronal changes influence neural circuits underlying cognition and whether these interactions influence patient survival. Using intracranial brain recordings during lexical retrieval language tasks in awake humans together with site-specific tumour tissue biopsies and cell biology experiments, we find that gliomas remodel functional neural circuitry such that task-relevant neural responses activate tumour-infiltrated cortex well beyond the cortical regions that are normally recruited in the healthy brain. Site-directed biopsies from regions within the tumour that exhibit high functional connectivity between the tumour and the rest of the brain are enriched for a glioblastoma subpopulation that exhibits a distinct synaptogenic and neuronotrophic phenotype. Tumour cells from functionally connected regions secrete the synaptogenic factor thrombospondin-1, which contributes to the differential neuron-glioma interactions observed in functionally connected tumour regions compared with tumour regions with less functional connectivity. Pharmacological inhibition of thrombospondin-1 using the FDA-approved drug gabapentin decreases glioblastoma proliferation. The degree of functional connectivity between glioblastoma and the normal brain negatively affects both patient survival and performance in language tasks. These data demonstrate that high-grade gliomas functionally remodel neural circuits in the human brain, which both promotes tumour progression and impairs cognition.


Conflict of interest statement

The authors declare no competing interests.

Figures

Fig. 1
Fig. 1. High-grade gliomas remodel long-range functional neural circuits.
a, In participants with dominant hemisphere glioblastomas, we applied subdural ECoG over the posterior lateral frontal cortex during an audiovisual speech initiation task to assess circuit dynamics. Spectral data show the expected pattern of HGp increasing above 50 Hz in addition to clear separation of frequencies across tumour and non-tumour electrodes. b, The posterior lateral frontal cortex (outlined area) time series of HGp within tumour-infiltrated cortex between −600 ms and speech onset (0 ms). c, High-gamma (HG) recordings from averaged electrodes within each patient, while averaging the effect across the sampled region of cortex for an individual showing greater HG power within electrodes overlying tumour-infiltrated cortex (n = 14 patients, F1,21 = 25.562, P = 0.00005). Data are median (centre dot), first to third quartiles (bars) and the minimum and maximum points (whiskers). d, Electrodes were compared between non-tumour and tumour-infiltrated regions; the false-discovery rate (FDR)-corrected HGp demonstrates task-relevant hyperexcitability (P = 0.016). Data are mean ± s.e.m. e, Event-related spectral perturbations (ERSPs) during a naming task for low-frequency words (low freq., left column) and high-frequency words (high freq., middle column) in normal-appearing non-tumour regions (top row) and glioma-infiltrated (bottom row) cortex. Signals from high-frequency word trials were able to be decoded above chance in normal-appearing cortex (mean accuracy = 0.56, P = 0.000089) but not in glioma-infiltrated cortex (mean classifier accuracy = 0.49, P = 0.72) using a regularized logistic regression classifier with leave-one-participant-out cross-validation (right column). Data are mean ± 95% confidence interval. AU, arbitrary units. For bd, statistical analysis was performed using two-sided linear mixed-effects models (bd), and corrections for multiple comparisons were performed using FDR adjustment (b and d). For e, P values were determined using two-tailed Student’s t-tests with Bonferroni multiple-comparison correction for the number of timepoints (left, ERSP) and one-sided Z-tests (right, classification accuracy). Source data
Fig. 2
Fig. 2. Tumour-infiltrated circuits exhibit areas of synaptic remodelling characterized by glioma cells expressing synaptogenic factors.
a, Single-cell RNA-seq feature plot analysis of THBS1 in HFC (n = 6,666 cells, 3 participants) tissues; within HFC samples, THBS1 is primarily in glioblastoma cells (circled). b, TSP-1 immunofluorescence analysis of nestin-positive tumour cells in HFC and LFC tissues. n = 13 (HFC) and n = 11 (LFC) sections, 3 per group. P = 0.000073. Scale bar, 50 µm. The box plot shows the median (centre line), interquartile range (box limits) and minimum and maximum values (whiskers). c, The synapsin-1 puncta count in HFC and LFC glioblastoma tissue samples. n = 25 regions, 4 per group. P = 0.000014. Red, synapsin-1 (presynaptic puncta); white, neurofilament heavy and medium (neurons). Scale bar, 10 µm. Inset: magnified view of synapsin-1 puncta on neurons. Scale bar, 3 µm. d, PSD95 puncta count. n = 7 (HFC) and n = 9 (LFC) sections, 3 per group. P = 0.04. Red, PSD95 (postsynaptic puncta); white, neurofilament heavy and medium chains (NFH/M) (neurons). Scale bar, 10 µm. Inset: magnified view of PSD95 puncta on neurons. Scale bar, 3 µm. e, Representative confocal images showing synaptic punctum colocalization (yellow arrows). Red, synapsin-1; green, homer-1 (postsynaptic puncta); white, MAP2 (neurons); blue, 4′,6-diamidino-2-phenylindole dihydrochloride (DAPI). Scale bar, 10 µm. Quantification of the number of colocalized pre- and postsynaptic puncta (n = 13 (HFC) and n = 10 (LFC) regions, 2 per group; P = 0.005) and homer-1 puncta size in neuron–glioma co-culture (P = 0.000024). f, TSP-1 rescue of induced neuron (iN) organoids in co-culture with HFC and LFC cells for 6 h. Scale bar, 300 µm. Quantification of glioblastoma (GBM) cell integration measured on the basis of the fluorescence intensity of RFP-positive glioblastoma cells in the organoids. Significant differences between HFC and LFC groups (asterisks) and LFC and LFC + TSP-1 (hash) are indicated. n = 2 (HFC and LFC groups) and n = 1 (LFC + TSP-1 group). Scale bar, 300 µm. g, Representative MEA raster plots showing individual spikes (tick mark), bursts (cluster of spikes in blue) and synchronized network bursts (pink) after 48 h co-culture of cortical neurons (CN) with HFC and LFC cells (outlined in red and blue, respectively). Quantification of network burst frequency (Hz) (n = 2 (CN only), n = 3 (CN + HFC) and n = 4 (CN + LFC); P = 0.05) and network synchrony (area under normalized cross-correlation; n = 2 (CN only), n = 3 (CN + HFC) and n = 4 (CN + LFC); P = 0.0129 (CN versus CN + HFC); P = 0.0308 (CN + HFC versus CN + LFC)). Data are mean ± s.e.m. (bg). P values were determined using two-tailed Student’s t-tests (bf) and one-way analysis of variance (ANOVA) with Tukey’s post hoc test (g). *P < 0.05, **P < 0.01, ****P < 0.0001; NS, not significant. Source data
Fig. 3
Fig. 3. High-grade gliomas exhibit bidirectional interactions with HFC brain regions.
a, Representative micrograph showing RFP-labelled glioblastoma xenografted into the mouse hippocampus. Scale bar, 500 µm. b, Immuno-electron microscopy analysis of HFC or LFC cell xenografts. The asterisk denotes immuno-gold particle labelling of RFP. Postsynaptic density in RFP+ tumour cells (pseudocoloured red), synaptic cleft and clustered synaptic vesicles in apposing presynaptic neuron (pseudocoloured yellow) identify both neuron–glioma synapses in HFC-PDX (left) and neuron–neuron synapses in LFC-PDX (right). Quantification of the total number (neuron–neuron combined with neuron-glioma) of synapses per field of view in HFC/LFC xenografts. n = 4 mice per group. P = 0.0019. Scale bar, 1,000 nm. Data are median (centre line), with first and third quartiles (box limits) and the minimum and maximum points (whiskers). c, Representative immunohistochemistry images in glioblastoma tissues demonstrate increased Ki-67 protein expression in HFC samples. n = 13 (HFC) and n = 14 (LFC) regions, 4 per group. P = 0.04. Scale bar, 50 µm. d, Glioblastoma cells from HFC tissues show a marked increase in the proliferative index when co-cultured with mouse hippocampal neurons. n = 27 (HFC), n = 14 (HFC + neurons), n = 32 (LFC) and n = 14 regions (LFC + neurons), 3 per group. e, SEM images of HFC and LFC cells cultured in the presence or absence of neuronal conditioned medium (NCM) shows tumour microtubes (TMTs) that connect neighbouring cells through cytoplasmic extensions. Quantification of TMTs per cell. n = 10 (HFC), n = 8 (HFC + NCM), n = 17 (LFC) and n = 13 (LFC + NCM) regions, 2 per group. P = 0.0455. Scale bars, 20 µm (full fields) and 10 µm (magnified view). f, Quantification of the mean microtube length per spheroid. n = 11 (HFC), n = 16 (HFC + NCM), n = 5 (LFC) and n = 6 (LFC + NCM) spheroids, 1 per group. P = 0.000011. g, Representative SEM images showing TMTs and quantification of TMTs per cell from HFC shCtrl and HFC shTSP-1 conditions. n = 5 regions, 2 per group. P = 0.0012. Scale bar, 20 µm. h, Kaplan–Meier survival curves of mice bearing HFC or LFC xenografts. n = 4 (HFC) and n = 5 (LFC). P = 0.03. Data are mean ± s.e.m. (bh). P values were determined using two-tailed Student’s t-tests (bg) and two-tailed log-rank analysis (h).*P < 0.05, **P < 0.01, ****P < 0.0001; NS, not significant. Source data
Fig. 4
Fig. 4. Intratumoural connectivity in patients with high-grade glioma is correlated with survival and TSP-1.
a,b, Schematic (a) and partDSA model (b) of overall survival in patients, incorporating the effects of glioblastoma intrinsic functional connectivity, therapeutic and clinical factors by recursive partitioning results into three risk groups. Risk group 1 (black) patients have the shortest survival, including a combination of (1) patients older than 72 and (2) patients younger than 72 with an extent of tumour resection (EOR) of less than 97%. Risk group 3 (grey) patients have the best survival, including patients who are younger than 62 with an extent of tumour resection of greater than 97% and no intratumoural connectivity. Intermediate risk group 2 (red) comprises a combination of patients with greater than 97% extent of resection and (1) an age of younger than 72 with tumour intrinsic connectivity or (2) patients between 62 and 72 years without connectivity. c, Linear regression statistics illustrate that serum TSP-1 is correlated with the extent of intratumoural functional connectivity. n = 56. P = 0.01. d, Representative MEA raster plots showing neuronal spikes (black tick marks), bursts (cluster of spikes in blue) and synchronized network bursts (pink) of neuron–HFC co-cultures (outlined in red) and 24–48 h exposure of neuron–HFC co-culture to (50 µM) GBP (outlined in orange). Quantification of the weighted mean firing rate (Hz) and network synchrony (area under normalized cross-correlation) from HFC and HFC + GBP glioma–neuron co-culture (weighted mean firing rate: n = 4 well, 2 per group; P = 0.04; area under normalized cross-correlation: n = 3 (HFC) and n = 4 (HFC + GBP); P = 0.007). e, Representative confocal images from neuron–HFC glioma co-culture showing a decrease in HFC cell proliferation after THBS1 knockdown using shRNA (n = 10 (HFC shCtrl) and n = 9 (HFC shTSP-1); P = 0.0068). Red, HNA (human nuclei); white, Ki-67. Scale bar, 30 µm. f, Representative confocal images from neuron–HFC glioma co-culture showing a decrease in HFC cell proliferation after gabapentin (32 µM) treatment for TSP-1 inhibition. n = 16 (HFC) and n = 15 (HFC + GBP), 2 per group. P = 0.0007. Red, HNA (human nuclei); white, Ki-67. Scale bar, 30 µm. g, Schematic for gabapentin treatment of HFC xenografted mice. i.p., intraperitoneal. h, Representative confocal images, and quantification demonstrating a decrease in the proliferation index (Ki-67+HNA+/HNA+) after gabapentin treatment in mice bearing HFC xenografts. n = 9 mice per group. P = 0.046. Red, HNA (human nuclei); white, Ki-67. Scale bar, 70 µm. Data are mean ± s.e.m. (df and h). P values were determined using two-sided linear regression analysis (c), and two-tailed (df) and one-tailed (h) Student’s t-tests. *P < 0.05, **P < 0.01, ***P < 0.001; NS, not significant. Source data
Extended Data Fig. 1
Extended Data Fig. 1. Experimental workflow.
a, Schematic of study workflow. In human participants with dominant hemisphere gliomas, we applied subcortical high density electrocorticography during audiovisual speech initiation to assess tumour intrinsic neuronal circuit dynamics. Focusing on glioblastoma, we then assessed long-range functional connectivity using magnetoencephalography (MEG) imaginary coherence. b, Extra-operative language assessments were performed for correlation with biological assays. c, Long-range measure of tumour intrinsic functional connectivity identified regions of high and low connectivity for site specific biopsies which were used for in vivo and in vitro cell biology experiments. d, Multiple layered approach including clinical variables, cognition assessments, human and animal model network dynamics, and cell biology experiments serves as a platform for glioma influence on neural circuit dynamics.
Extended Data Fig. 2
Extended Data Fig. 2. Electrode location and spectral data across cortically infiltrating diffuse glioma.
a, Electrodes overlying normal appearing and glioma-infiltrated regions a cohort of 14 adult patients with cortically projecting glioma in the lateral prefrontal cortex. Electrodes over non-tumour regions are shown in white and those over tumour-infiltrative regions in black. b, Positive control conditions included speech initiation responses within non-infiltrated cortex of the left lateral prefrontal cortex (LPFC) for non-cortically projecting glioblastoma. (Left) Axial FLAIR MRI demonstrates tumour location within insular cortex. Hemisphere of language dominance on the left was performed according to study protocol. (Middle) Black outline illustrates LPFC with ECoG recordings obtained from electrode A24, denoted by the red dot. White star represents frontal lobe motor cortex. (Right) Identical to non-tumour comparisons for cortically projecting gliomas, speech responses demonstrate elevate high gamma power (HGp) prior to speech onset consistent with speech motor planning. Dark line and shaded region represent mean and 95% confidence interval, respectively. c, Selectivity of maintained tumour intrinsic task-specific cortical responses is identified across diffuse glioma subtypes (adapted from Aabedi et al. 2021). Spectral data show clear separation of frequencies across tumour (glioma-infiltrated) and non-tumour (normal-appearing) electrodes. Group level analysis of participants (n = 12) demonstrates speech initiation responses across WHO 2–4 diffuse glioma. d, Glioma subtype-specific speech initiation spectral responses for electrodes above normal-appearing and glioma-infiltrated cortex showing conserved phenotype with task-specific hyperexcitability observed only in participants with glioblastoma. Subtypes: grade 2 and 3 oligodendroglioma (n = 4), grade 2 and 3 astrocytoma (n = 4), and glioblastoma (n = 4). P value determined by two-tailed Student’s t-test and corrections for multiple comparisons were made using the FDR method (a). Source data
Extended Data Fig. 3
Extended Data Fig. 3. Speech initiation neural activity in lateral prefrontal cortex (LPFC).
a, Spectral data of time vs frequency from 100–150 Hz for all tumour and non-tumour electrodes show the expected pattern of HgP increasing above 50 Hz. b, High gamma power (HGp) recording from single electrodes overlying tumour-infiltrated regions of brain. Dark line and shaded region represent mean and 95% confidence interval, respectively. c, Reconstructed time series of HGp from non-tumour electrodes demonstrating expected spatial and temporal pattern of neural activity within lateral prefrontal cortex. d, e, Electrodes matched to anatomical areas across tumour and non-tumour demonstrate hyperexcitability with glioma-infiltrated cortex. Plots are centred on median, with dark bars indicating the first and third quartiles, and whiskers the minimum and maximum points (n = 101 per group, P = 0.0163). P value determined by two-sided linear mixed-effects model with corrections for multiple comparisons made using the FDR method (b) and two-tailed Student’s t-test (e). *P < 0.05. Source data
Extended Data Fig. 4
Extended Data Fig. 4. Gamma power and tumour-intrinsic connectivity imaging correlations.
a, Linear regression statistics illustrating that gamma power (a measure of neuronal activity) correlates with number of intratumoural high functional connectivity voxels in glioblastoma (n = 18 patients; P = 0.00002). Shaded area represents the 95% confidence interval predicted by the linear regression model. b, Sampling of functionally connected intratumoural regions using MEG was performed exclusively in participants with dominant hemisphere glioblastoma at the point of initial diagnosis. Site-directed tissue biopsies from HFC and LFC regions were taken as determined by MRI. Table illustrates site-specific sampling of each annotated specimen as it relates to contrast enhancing (CE) region and FLAIR tumour. Site-specific samples were acquired without regard for whether they originated from enhancing or FLAIR regions. c, While samples were not acquired based on whether they originated from contrast enhancing or FLAIR regions, the stereotactic coordinates of each sample were acquired. While 57.78% of HFC samples originated from contrast enhancing regions, this did not reach statistical significance. P = 0.1923 two-sided chi square, P = 0.235 two-sided Fisher’s exact test. P value determined by two-sided linear regression analysis (a). NS, not significant. Source data
Extended Data Fig. 5
Extended Data Fig. 5. Neurogenic gene expression in glioblastoma.
a, Bulk RNA transcriptomic profile of HFC tissues showed a neurogenic signature including elevated (7-fold) expression of thrombospondin-1 (TSP-1) (n = 3-4 per group). b, Unsupervised principal component (PCA) analysis of bulk RNA sequencing data obtained from glioblastoma primary patient HFC (n = 3) and LFC (n = 4) samples. c, Volcano plots of IDH-WT glioblastoma samples revealed 144 differentially expressed genes between HFC and LFC tumour regions. The blue dots represent all differentially expressed genes, where differential expression is defined by the parameters: adjusted p-value < 0.05 and absolute log2fold change > 1. P value calculated using two-sided Wald test and adjusted for multiple comparisons with the Benjamini-Hochberg method. Source data
Extended Data Fig. 6
Extended Data Fig. 6. TSP-1 expression in single-cell primary patient-derived glioblastoma.
ac, Tumour cell validation using copy number variant assessment on three matched pairs of HFC and LFC samples from FC1 (SF#1), FC2 (SF#2), and FC3 (SF#3) glioblastoma patients. Trisomy 7 and monosomy 10 co-occur in most cells in FC1.Trisomy 7 is an early event, while monosomy 10 is a late event in FC2. FC3 patient sample contains no copy number variation but has high level amplification of NTRK2 gene. d, Single-cell RNA transcriptomic profile UMAP confirms distinct cell populations including non-tumour astrocytes and neurons. e, Gene enrichment profile used to identify each of the UMAP cell populations. f, g, Feature plot for TSP-1 in combined (HFC + LFC) and LFC (n = 7,065 cells, 3 participants) population; within LFC samples, TSP-1 expression is primarily from non-tumour astrocytes (suggesting that within low connectivity intratumoural regions, normal astrocytes secrete TSP-1 to generate connectivity mirroring normal physiology). h, Dot plots showing TSP-1 expression (grey to red scale) and percentage (number of cells expressing the gene) of TSP-1-positive cells in tumour cells and non-tumour astrocyte populations in HFC and LFC samples (n = 3 per group). Out of the total HFC tumour cells (n = 5325, 3 patients), 157 cells are TSP-1 positive accounting for a percentage of 2.95, while only 1.59% (51 cells out of a total of 3212 LFC tumour cells [n = 3 patients]) express TSP-1. However, in the non-tumour astrocyte population, the number of TSP-1-positive cells are higher in LFC (n = 34 out of a total of 41 astrocytes, accounting for 82.9%) compared to HFC (n = 15 out of a total of 20 astrocytes, accounting for 75%) samples. i, Violin plots illustrating significantly increased TSP-1 expression within HFC region glioblastoma cells relative to LFC regions (P = 1.4*10−7). j, Compared to HFC, slight trend of increased TSP-1 expression within non-tumour astrocytes of LFC population. However, this trend did not reach statistical significance, likely due to the small number of non-tumour astrocytes captured (P = 0.45). P values determined by two-tailed Student’s t-test. Source data
Extended Data Fig. 7
Extended Data Fig. 7. TSP-1 expression, synaptic puncta colocalization in primary patient-derived glioblastoma tissues, neuron organoid-glioblastoma co-culture model and structural synapse formation in patient-derived xenograft models.
a, TSP-1 (immunohistochemistry) expression in arbitrary units (A.U.) in HFC and LFC tissues (n = 16 regions; 3 per group; P = 0.04). Scale bar, 50 µm. b, Representative confocal images of primary patient-derived HFC and LFC tissues showing regions of synaptic puncta colocalization (white arrows). Orange, synapsin-1 (presynaptic puncta); red, PSD95 (postsynaptic puncta); green, neurofilament (neurons). Scale bar, 15 µm. Quantification of the number of colocalized pre- and postsynaptic puncta (HFC: n = 7; LFC: n = 10 regions, 2 per group; P = 0.05). Quantification of postsynaptic PSD95 puncta size (HFC: n = 6; LFC: n = 9, 2 per group; P = 0.0441). Scale bar, 15 µm. c, Primary patient-derived cultures and mouse hippocampal neuron controls. Neurofilament (heavy and medium chains) and nestin antibodies used as specific markers to label mouse hippocampal neurons and glioblastoma cells, respectively in glioma-neuron co-culture. Left panel: mouse hippocampal neurons alone in culture for 14 days only express neurofilament (green) and not nestin (orange). Right panel: Nestin (orange) expression in GBM cells co-cultured with neurofilament (green) labelled mouse hippocampal neurons for 14 days. Scale bar, 100 µm. d, Cell cultures tested for mycoplasma using a commercially available kit (PCR Mycoplasma Test Kit I/C, PromoCell, Heidelberg, Germany) shows absence of a positive band at ~270 bp. Tested primary patient-derived lines shows internal control DNA at ~479 bp indicated a successfully performed PCR. e, Neuron organoids (GFP labelled) were generated from an iPSC cell line integrated with doxycycline inducible human NGN2 transgene and co-cultured with RFP labelled HFC and LFC cells (pseudo-coloured white) for two weeks. Quantification of postsynaptic Homer-1 puncta density (calculated by dividing the number of puncta measured with the area of the image field) in 2-week induced neuron (iN) organoid sections (n = 8 per group; P = 0.0009). Scale bar, 10 µm. f, Multi-electrode array of glioma-neuron co-culture and control conditions. Magnified view of multi-electrode array (MEA), showing RFP-labelled glioblastoma cells in co-culture with neurons (top row). Scale bar, 100 µm. Representative raster plot showing individual spikes/extracellular action potentials (tick mark), bursts (cluster of spikes in blue) and synchronized network bursts (pink) of mouse cortical neuron (DIV 18) only condition (bottom row). The cumulative trace above the raster plots depicts the population spike time histogram indicating the synchronized activity between the different electrodes (network burst). g, Structural synapses in primary patient-derived glioblastoma xenografts. Quantification of neuron-to-neuron (P = 0.1381) and neuron-glioma synapses (P = 0.0005) per high power field (hpf) in HFC and LFC xenografts (top row). Specificity negative controls for immuno-gold labelling (bottom row). (Left) HFC xenograft with secondary antibody only (no primary antibody) control and (right) non-glioma bearing negative control tissue demonstrating few randomly distributed immunogold particles across the tissue specimen. Scale bar, 1000 nm. Data presented as mean ± s.e.m. P values determined by two-tailed Student’s t-test. *P < 0.05; **P < 0.01; ***P < 0.001; NS, not significant. Source data
Extended Data Fig. 8
Extended Data Fig. 8. Proliferation of primary patient-derived glioblastoma cell monoculture and neuron co-culture conditions.
Primary patient glioblastoma cells from HFC regions illustrate marked increase in proliferation when co-cultured with mouse hippocampal neurons. a, Quantification of proliferation indices of HFC (n = 4) and LFC (n = 4) glioma cells alone in culture (in the absence of neurons) from individual patient lines, determined by quantifying the fraction of EdU labelled cells/DAPI labelled cells; P = 0.00005). b, Representative confocal images illustrating proliferating HFC and LFC glioma cells (EdU+, green) in the absence or presence of mouse hippocampal neurons (72h co-culture). Scale bar, 100 µm. Data presented as mean ± s.e.m. P value determined by two-tailed Student’s t-test. ****P < 0.0001. Source data
Extended Data Fig. 9
Extended Data Fig. 9. Activity-dependent invasion of TSP-1 positive HFC cells.
a, 3D spheroid invasion assay showing representative micrographs imaged 24 h after addition of invasion matrix. Analysis includes quantification of mean spheroid invasion area normalized for each sample to the initial (0 h) spheroid area (HFC: n = 11; HFC + NCM: n = 16; LFC: n = 5; LFC + NCM: n = 6 spheroids, 1 per group; P = 0.02). Scale bar, 200 µm. Data presented as mean ± s.e.m. P values determined by two-tailed Student’s t-test. b, Representative confocal images of primary patient-derived HFC and LFC tissues showing MET-positive glioma cells (white arrows). Red, MET; orange, Nestin (HFC/LFC-GBM cells); blue, DAPI. Scale bar, 30 µm. Quantification of MET-positive glioma cells per high-power field (HFC: n = 8; LFC: n = 11, 3 per group; P = 0.0005). c, Representative immunohistochemistry images of MET staining in HFC and LFC tissues demonstrate increased tissue level protein expression (HFC: n = 26; LFC: n = 24 regions, 4 per group; P = 0.0329). Scale bar, 50 µm. Data presented as mean ± s.e.m. P values determined by two-tailed Student’s t-test. d, Representative confocal images showing the diffuse infiltrative pattern of HFC cells in the hippocampus in comparison to the LFC cells. Quantification of tumour burden of HFC and LFC hippocampal xenografts using rank order analysis (HFC: n = 13; LFC: n = 11 regions; P = 0.002). Scale bar, 100 µm. Data presented as mean ± s.e.m. P value determined by two-tailed Mann-Whitney test. *P < 0.05; **P < 0.01; ***P < 0.001; NS, not significant. Source data
Extended Data Fig. 10
Extended Data Fig. 10. Cell viability and TSP-1 knockdown validation.
a, Cell viability determined by live/dead cell assay. Representative images illustrating no significant cell death 2 weeks post-transduction of HFC cells with control (shCont) or TSP-1 shRNAs. Live (green) and dead (red) cells were imaged from four random fields per well and were visualized under a fluorescence microscope. The percentage of live cells were calculated as the number of live cells (in green) divided by the total number of cells (green + red) per image field (n = 4 regions per group; P = 0.0720). Scale bar, 100 µm. b, ELISA experiments performed on cell culture supernatants demonstrating strong reduction of TSP-1 expression after knockdown of TSP-1 in two different primary patient-derived HFC cell lines compared to the control scramble condition (n = 2 per group). Data presented as mean ± s.e.m. P values determined by two-tailed Student’s t-test. N.S., not significant. Source data
Extended Data Fig. 11
Extended Data Fig. 11. Patient survival and language task performance.
a, Kaplan-Meier human survival analysis illustrates 71-week overall survival for patients with HFC voxels as determined by contrast-enhanced T1-weighted images as compared to 123-weeks for participants without HFC voxels within their glioblastoma (mean follow-up months 50.5, range 4.9–155.9 months). b, Picture and auditory naming language task performance across the study population. c, Linear regression statistics illustrating a negative correlation between the number of intratumoural high functional connectivity voxels and baseline auditory and picture naming scores (n = 31, P = 0.0181). P value determined by two-tailed linear regression analysis. Source data
Extended Data Fig. 12
Extended Data Fig. 12. Anti-proliferative effects of TSP-1 inhibition in glioblastoma is limited to activity-dependent mechanisms.
Representative confocal images from HFC glioma monoculture showing no significant change in proliferation (as measured by the number of human nuclear antigen (HNA)-positive cells co-labelled with Ki67 divided by the total number of HNA-positive tumour cells counted across all areas quantified) upon pharmacological TSP-1 inhibition using (32 µM) gabapentin (HFC: n = 7; LFC: n = 9 regions, 2 per group; P = 0.50). Red, HNA (human nuclei); white, Ki67. Scale bar, 30 µm. Data presented as mean ± s.e.m. P values determined by two-tailed Student’s t-test. NS, not significant. Source data

Comment in

Similar articles

  • Tumour-infiltrated cortex participates in large-scale cognitive circuits.
    Mandal AS, Wiener C, Assem M, Romero-Garcia R, Coelho P, McDonald A, Woodberry E, Morris RC, Price SJ, Duncan J, Santarius T, Suckling J, Hart MG, Erez Y. Mandal AS, et al. Cortex. 2024 Apr;173:1-15. doi: 10.1016/j.cortex.2024.01.004. Epub 2024 Jan 30. Cortex. 2024. PMID: 38354669 Free PMC article.
  • Characterizing and targeting glioblastoma neuron-tumor networks with retrograde tracing.
    Tetzlaff SK, Reyhan E, Layer N, Bengtson CP, Heuer A, Schroers J, Faymonville AJ, Langeroudi AP, Drewa N, Keifert E, Wagner J, Soyka SJ, Schubert MC, Sivapalan N, Pramatarov RL, Buchert V, Wageringel T, Grabis E, Wißmann N, Alhalabi OT, Botz M, Bojcevski J, Campos J, Boztepe B, Scheck JG, Conic SH, Puschhof MC, Villa G, Drexler R, Zghaibeh Y, Hausmann F, Hänzelmann S, Karreman MA, Kurz FT, Schröter M, Thier M, Suwala AK, Forsberg-Nilsson K, Acuna C, Saez-Rodriguez J, Abdollahi A, Sahm F, Breckwoldt MO, Suchorska B, Ricklefs FL, Heiland DH, Venkataramani V. Tetzlaff SK, et al. Cell. 2025 Jan 23;188(2):390-411.e36. doi: 10.1016/j.cell.2024.11.002. Epub 2024 Dec 6. Cell. 2025. PMID: 39644898
  • Remote neuronal activity drives glioma progression through SEMA4F.
    Huang-Hobbs E, Cheng YT, Ko Y, Luna-Figueroa E, Lozzi B, Taylor KR, McDonald M, He P, Chen HC, Yang Y, Maleki E, Lee ZF, Murali S, Williamson MR, Choi D, Curry R, Bayley J, Woo J, Jalali A, Monje M, Noebels JL, Harmanci AS, Rao G, Deneen B. Huang-Hobbs E, et al. Nature. 2023 Jul;619(7971):844-850. doi: 10.1038/s41586-023-06267-2. Epub 2023 Jun 28. Nature. 2023. PMID: 37380778 Free PMC article.
  • Delivery of molecularly targeted therapy to malignant glioma, a disease of the whole brain.
    Agarwal S, Sane R, Oberoi R, Ohlfest JR, Elmquist WF. Agarwal S, et al. Expert Rev Mol Med. 2011 May 13;13:e17. doi: 10.1017/S1462399411001888. Expert Rev Mol Med. 2011. PMID: 21676290 Free PMC article. Review.
  • Overcoming the blood-brain tumor barrier for effective glioblastoma treatment.
    van Tellingen O, Yetkin-Arik B, de Gooijer MC, Wesseling P, Wurdinger T, de Vries HE. van Tellingen O, et al. Drug Resist Updat. 2015 Mar;19:1-12. doi: 10.1016/j.drup.2015.02.002. Epub 2015 Mar 6. Drug Resist Updat. 2015. PMID: 25791797 Review.

Cited by

References

    1. Venkataramani V, et al. Glutamatergic synaptic input to glioma cells drives brain tumour progression. Nature. 2019;573:532–538. doi: 10.1038/s41586-019-1564-x. - DOI - PubMed
    1. Venkatesh HS, et al. Electrical and synaptic integration of glioma into neural circuits. Nature. 2019;573:539–545. doi: 10.1038/s41586-019-1563-y. - DOI - PMC - PubMed
    1. Venkatesh HS, et al. Neuronal activity promotes glioma growth through neuroligin-3 secretion. Cell. 2015;161:803–816. doi: 10.1016/j.cell.2015.04.012. - DOI - PMC - PubMed
    1. Venkatesh HS, et al. Targeting neuronal activity-regulated neuroligin-3 dependency in high-grade glioma. Nature. 2017;549:533–537. doi: 10.1038/nature24014. - DOI - PMC - PubMed
    1. Buckingham SC, et al. Glutamate release by primary brain tumors induces epileptic activity. Nat. Med. 2011;17:1269–1274. doi: 10.1038/nm.2453. - DOI - PMC - PubMed

Publication types

MeSH terms