

Modelling the pulse population-wide nucleic acid screening in mitigating and stopping COVID-19 outbreaks in China
- PMID: 37138230
- PMCID: PMC10155657
- DOI: 10.1186/s12879-023-08265-1
Modelling the pulse population-wide nucleic acid screening in mitigating and stopping COVID-19 outbreaks in China
Abstract
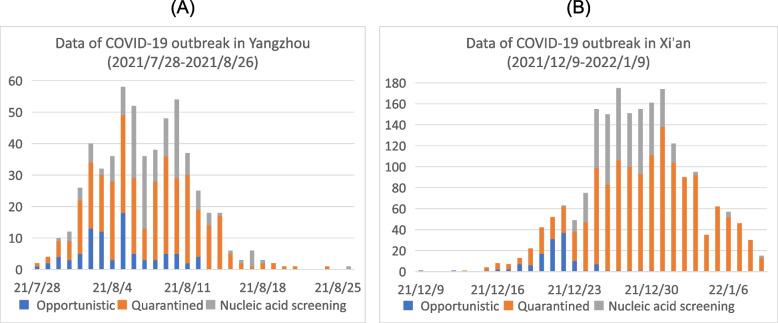
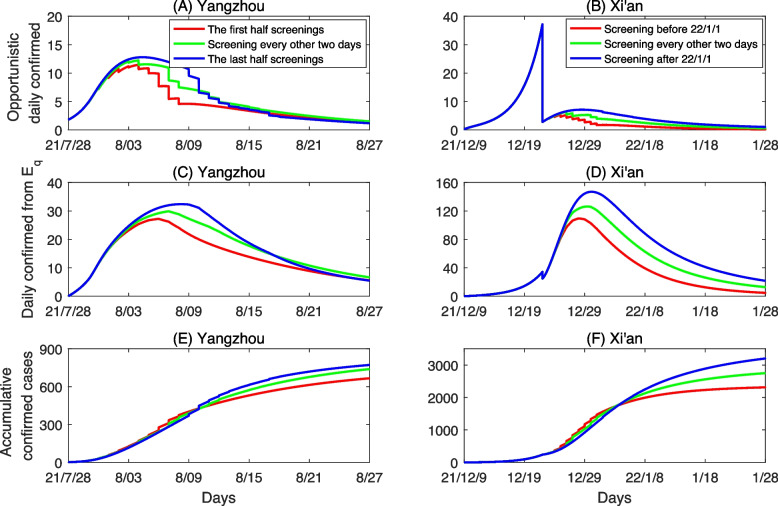
Background: During 2021-2022, mainland China experienced multiple times of local COVID-19 outbreaks in several cities, including Yangzhou, Xi'an etc., and the Chinese government persistently adopted the zero-COVID policy in combating with the local outbreaks.
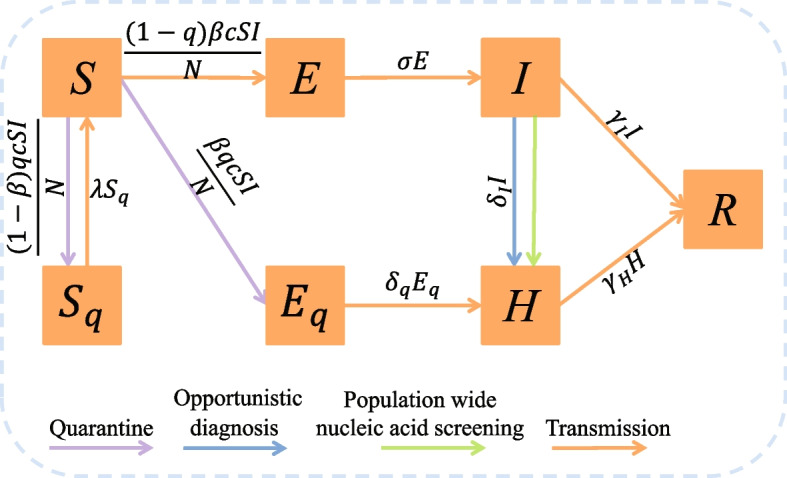
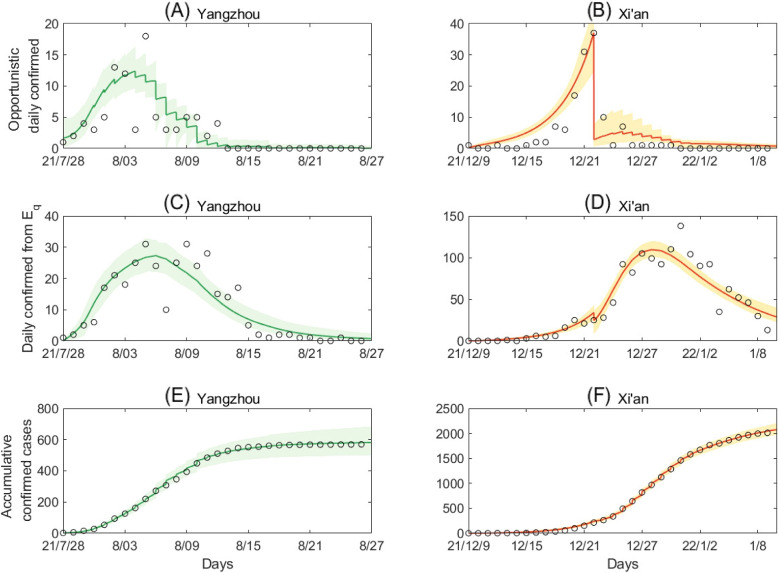
Methods: We develop a mathematical model with pulse population-wide nucleic acid screening, part of the zero-COVID policy, to reveal its role in controlling the spread of COVID-19. We calibrate the model by fitting the COVID-19 epidemic data of the local outbreaks in Yangzhou and Xi'an, China. Sensitivity analysis is conducted to investigate the impact of population-wide nucleic acid screening on controlling the outbreak of COVID-19.
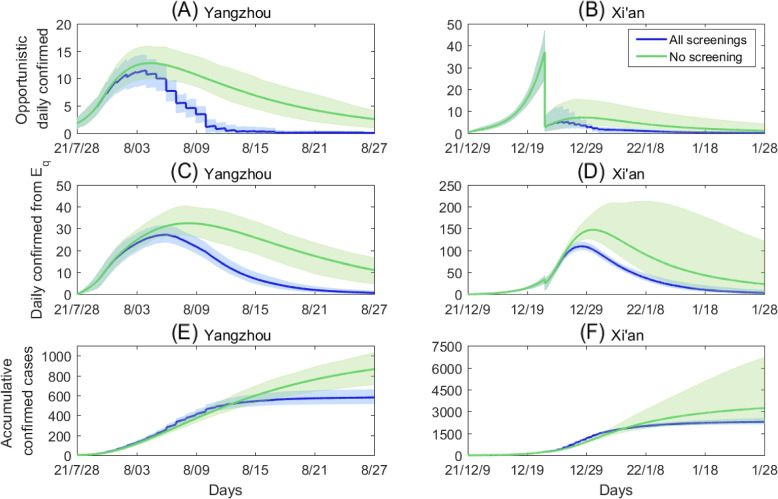
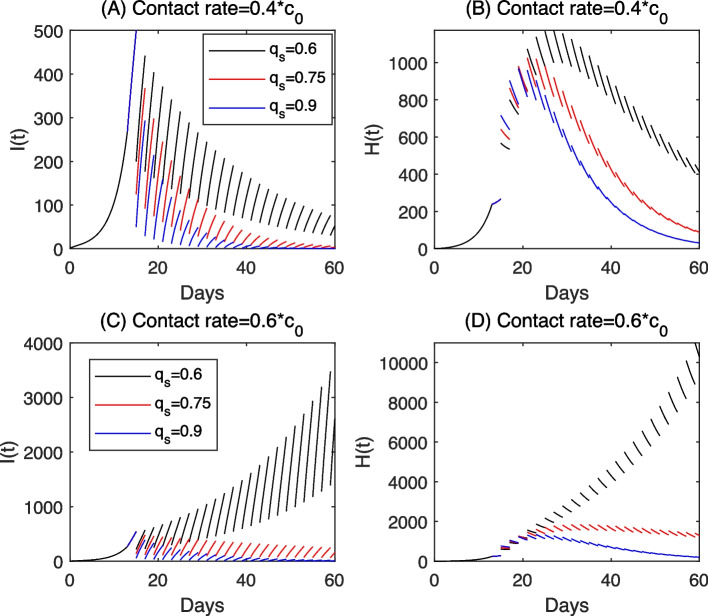
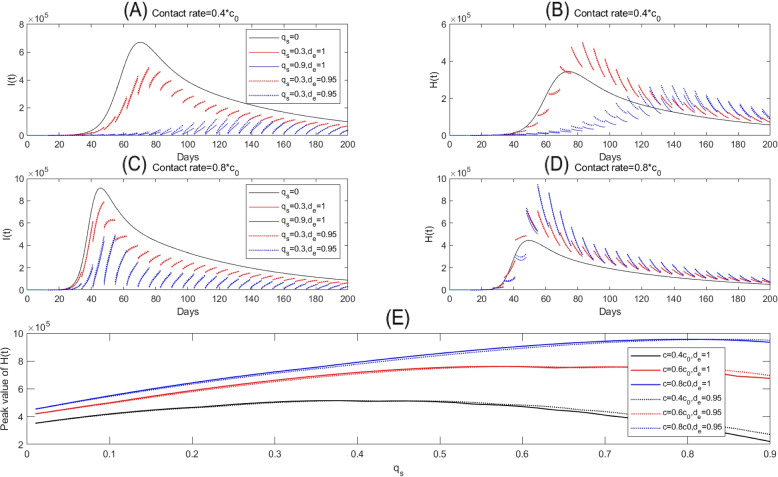
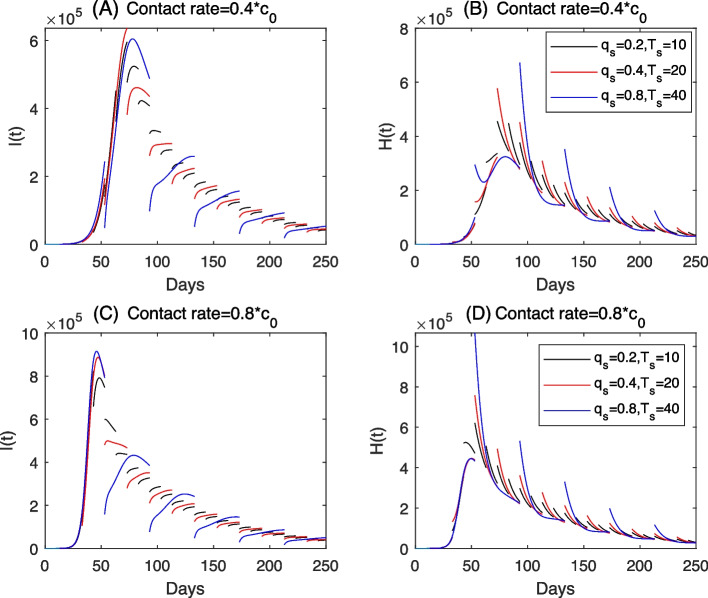
Results: Without the screening, the cumulative number of confirmed cases increases by [Formula: see text] and [Formula: see text] in Yangzhou and Xi'an, respectively. Meanwhile, the screening program helps to shorten the lockdown period for more than one month when we aim at controlling the cases into zero. Considering its role in mitigating the epidemics, we observe a paradox phenomenon of the screening rate in avoiding the runs on medical resource. That is, the screening will aggravate the runs on medical resource when the screening rate is small, while it helps to relieve the runs on medical resource if the screening rate is high enough. We also conclude that the screening has limited effects on mitigating the epidemics if the outbreak is in a high epidemic level or there has already been runs on medical resources. Alternatively, a smaller screening population per time with a higher screening frequency may be a better program to avoid the runs on medical resources.
Conclusions: The population-wide nucleic acid screening strategy plays an important role in quickly controlling and stopping the local outbreaks under the zero-COVID policy. However, it has limited impacts and even increase the potential risk of the runs on medical resource for containing the large scale outbreaks.
Keywords: COVID-19; Mathematical model; Nucleic acid screening; Runs on medical resource; Screening paradox.
© 2023. The Author(s).
Conflict of interest statement
The authors declare that they have no competing interests.
Figures
Similar articles
-
The effectiveness of various control strategies: An insight from a comparison modelling study.J Theor Biol. 2022 Sep 21;549:111205. doi: 10.1016/j.jtbi.2022.111205. Epub 2022 Jun 23. J Theor Biol. 2022. PMID: 35753357
-
Contact network analysis of COVID-19 Delta variant outbreak in urban China -based on 2,050 confirmed cases in Xi'an, China.BMC Public Health. 2022 Dec 22;22(1):2408. doi: 10.1186/s12889-022-14882-3. BMC Public Health. 2022. PMID: 36550467 Free PMC article.
-
Effects of medical resource capacities and intensities of public mitigation measures on outcomes of COVID-19 outbreaks.BMC Public Health. 2021 Mar 29;21(1):605. doi: 10.1186/s12889-021-10657-4. BMC Public Health. 2021. PMID: 33781225 Free PMC article.
-
Management of Cardiac Patients in Epidemic Outbreak.Curr Cardiol Rev. 2022;18(6):e120422203466. doi: 10.2174/1573403X18666220412140105. Curr Cardiol Rev. 2022. PMID: 35418288 Free PMC article. Review.
-
Civil society's response to emerging public health events in China.J Glob Health. 2020 Jun;10(1):010364. doi: 10.7189/jogh.10.010364. J Glob Health. 2020. PMID: 32566155 Free PMC article. Review. No abstract available.
Cited by
-
Combining the dynamic model and deep neural networks to identify the intensity of interventions during COVID-19 pandemic.PLoS Comput Biol. 2023 Oct 18;19(10):e1011535. doi: 10.1371/journal.pcbi.1011535. eCollection 2023 Oct. PLoS Comput Biol. 2023. PMID: 37851640 Free PMC article.
References
-
- World Health Organization. 2022 WHO Coronavirus Disease (COVID-19) Dashboard. 2022. https://covid19.who.int/.
MeSH terms
Grants and funding
LinkOut - more resources
Full Text Sources
Medical
