

Integrated bioinformatic analysis of mitochondrial metabolism-related genes in acute myeloid leukemia
- PMID: 37138869
- PMCID: PMC10149950
- DOI: 10.3389/fimmu.2023.1120670
Integrated bioinformatic analysis of mitochondrial metabolism-related genes in acute myeloid leukemia
Abstract
Background: Acute myeloid leukemia (AML) is a common hematologic malignancy characterized by poor prognoses and high recurrence rates. Mitochondrial metabolism has been increasingly recognized to be crucial in tumor progression and treatment resistance. The purpose of this study was to examined the role of mitochondrial metabolism in the immune regulation and prognosis of AML.
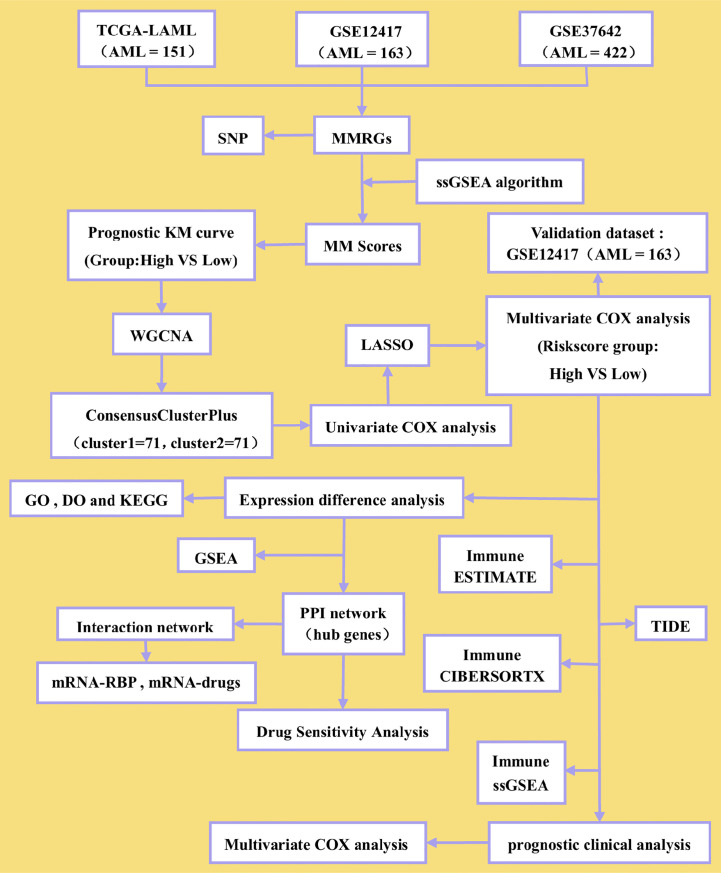
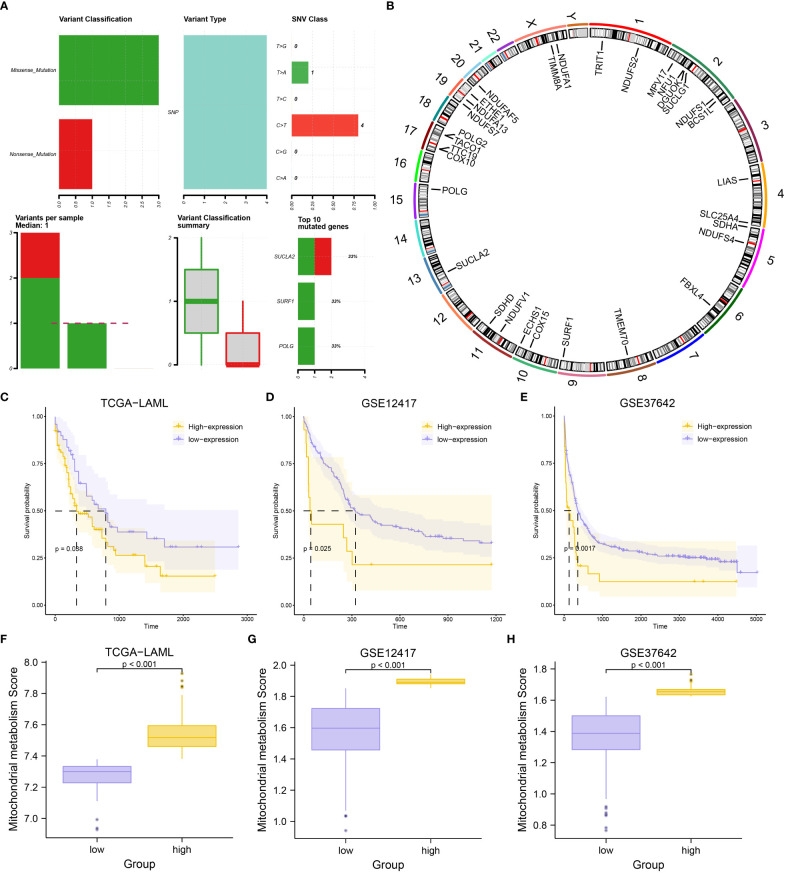
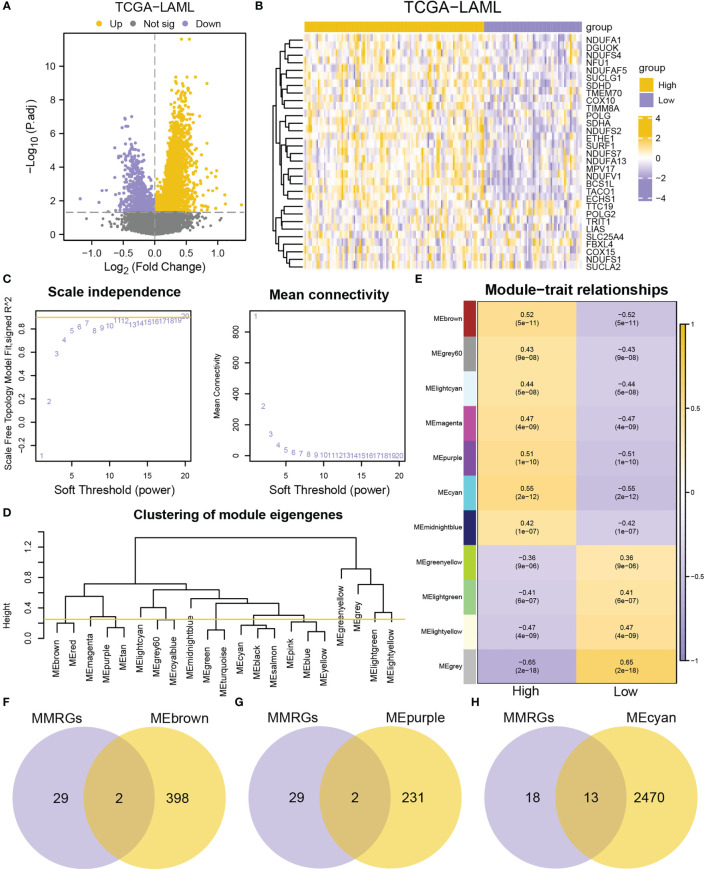
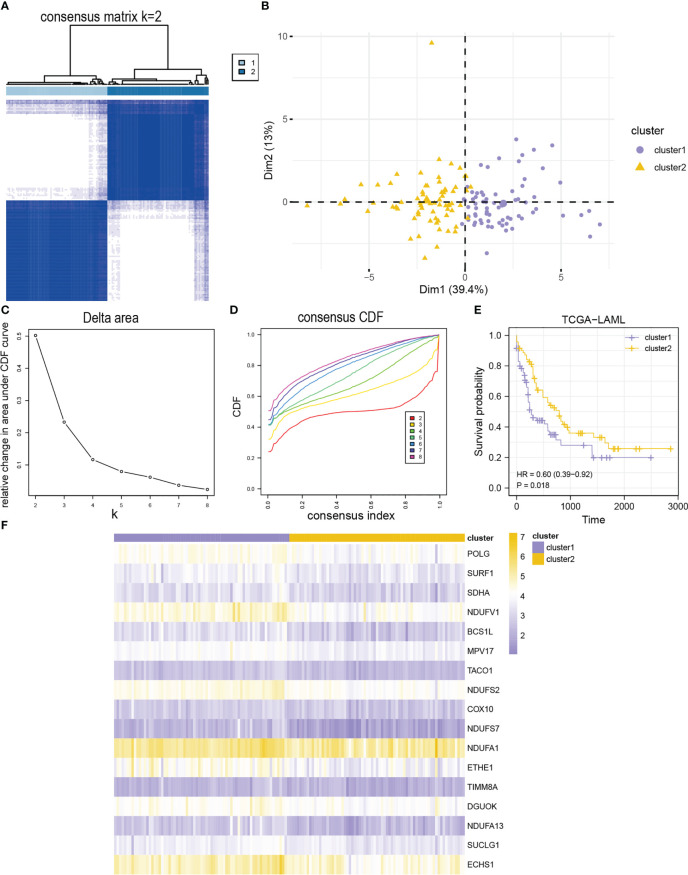
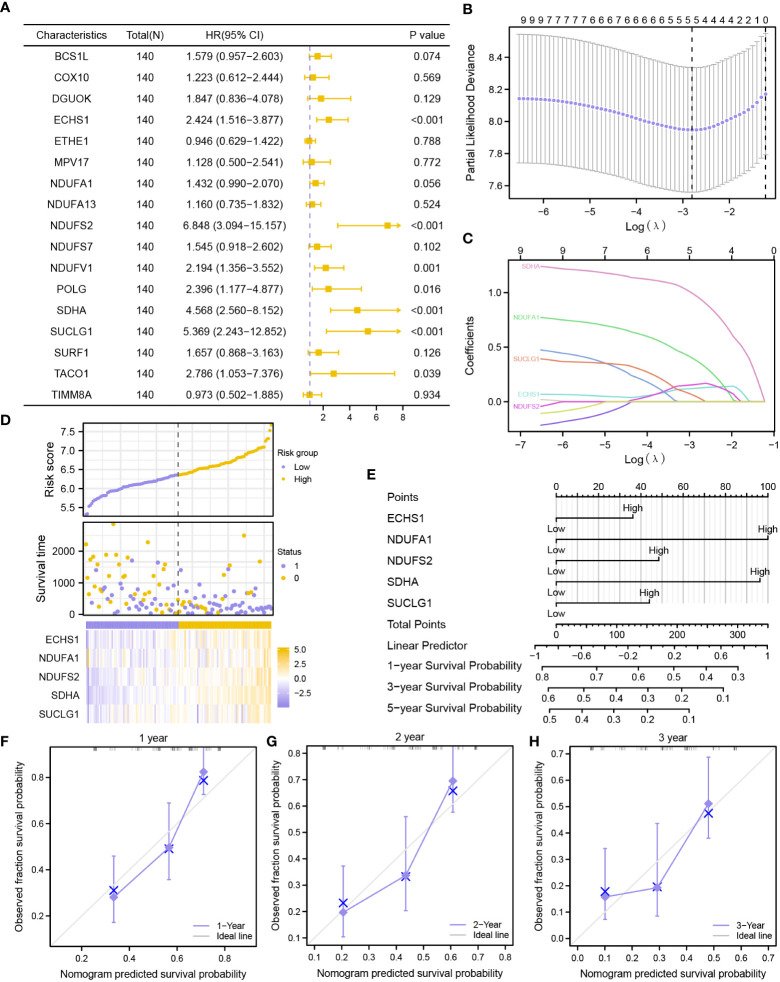
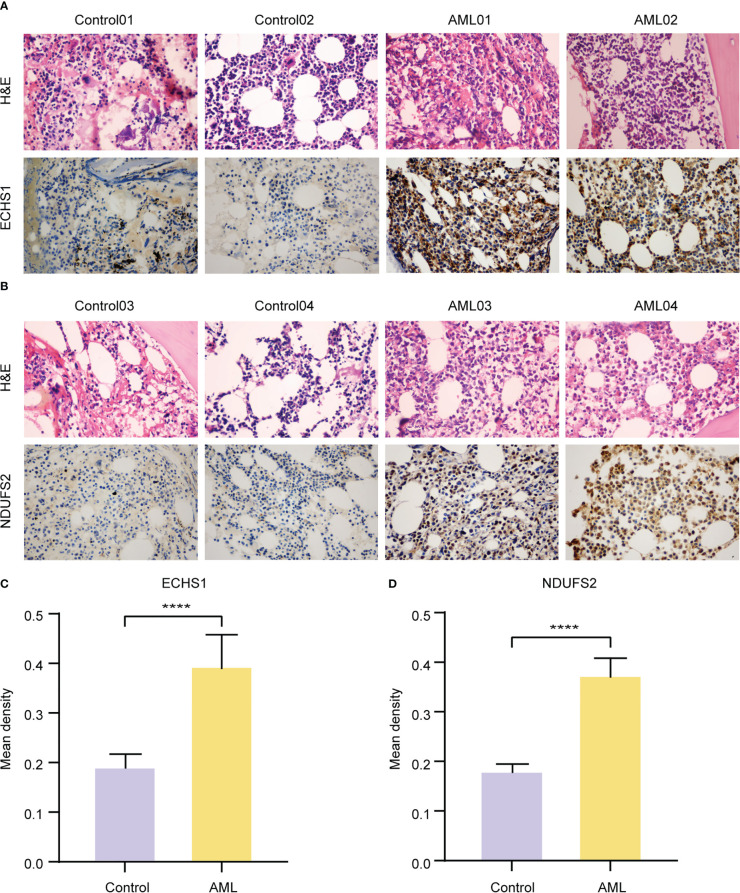
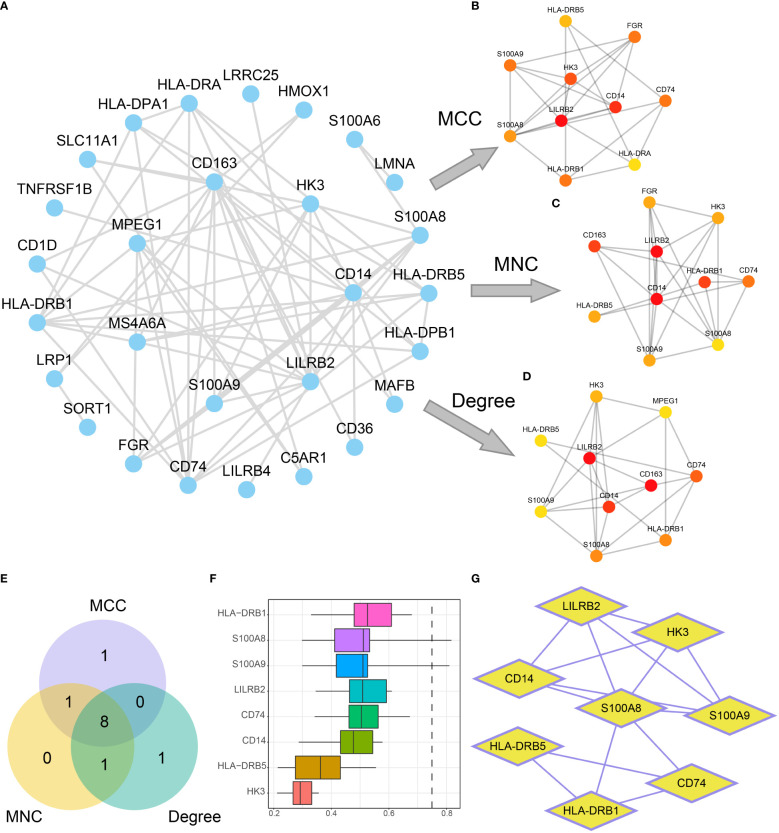
Methods: In this study, mutation status of 31 mitochondrial metabolism-related genes (MMRGs) in AML were analyzed. Based on the expression of 31 MMRGs, mitochondrial metabolism scores (MMs) were calculated by single sample gene set enrichment analysis. Differential analysis and weighted co-expression network analysis were performed to identify module MMRGs. Next, univariate Cox regression and the least absolute and selection operator regression were used to select prognosis-associated MMRGs. A prognosis model was then constructed using multivariate Cox regression to calculate risk score. We validated the expression of key MMRGs in clinical specimens using immunohistochemistry (IHC). Then differential analysis was performed to identify differentially expressed genes (DEGs) between high- and low-risk groups. Functional enrichment, interaction networks, drug sensitivity, immune microenvironment, and immunotherapy analyses were also performed to explore the characteristic of DEGs.
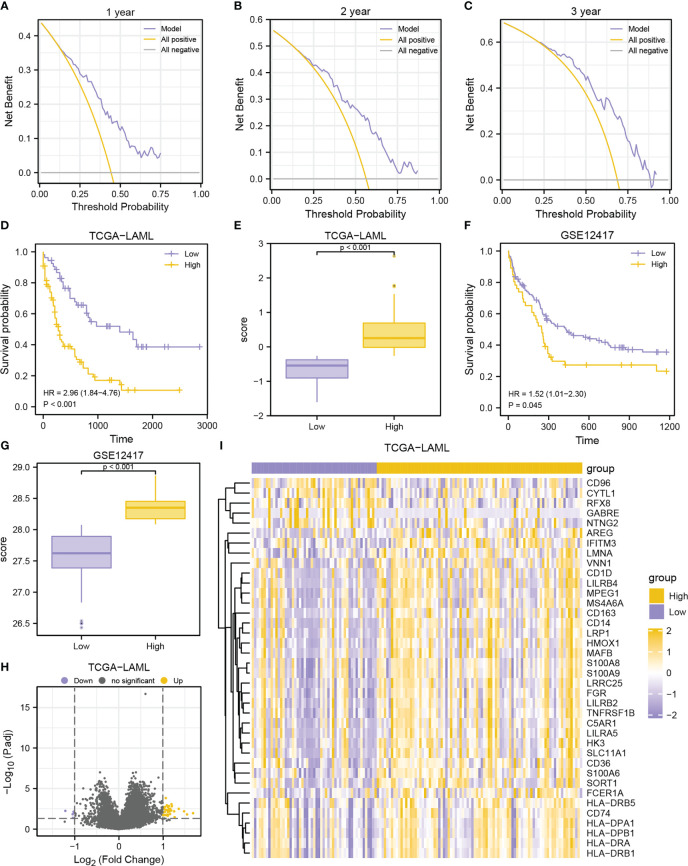
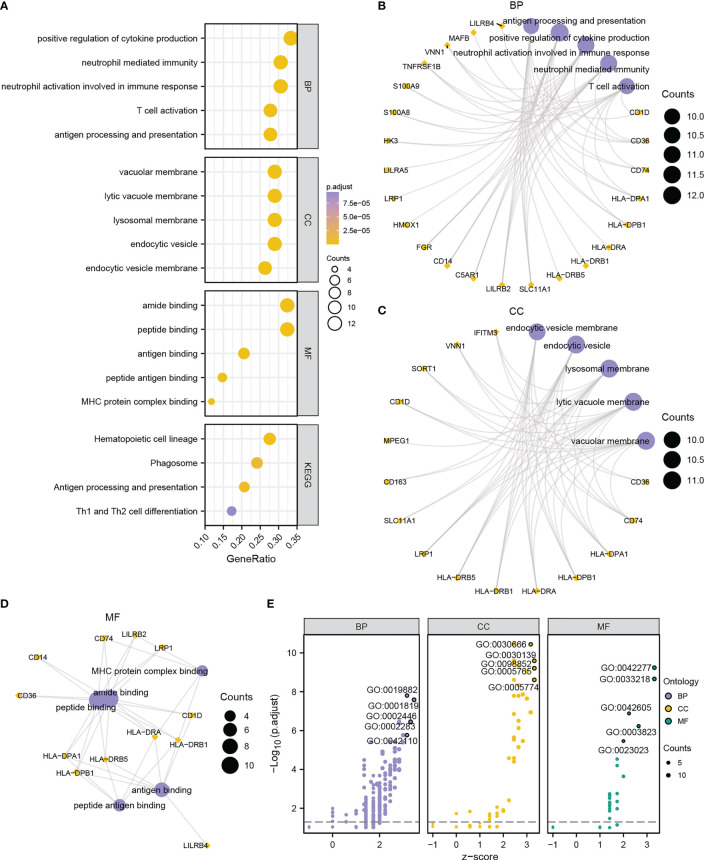
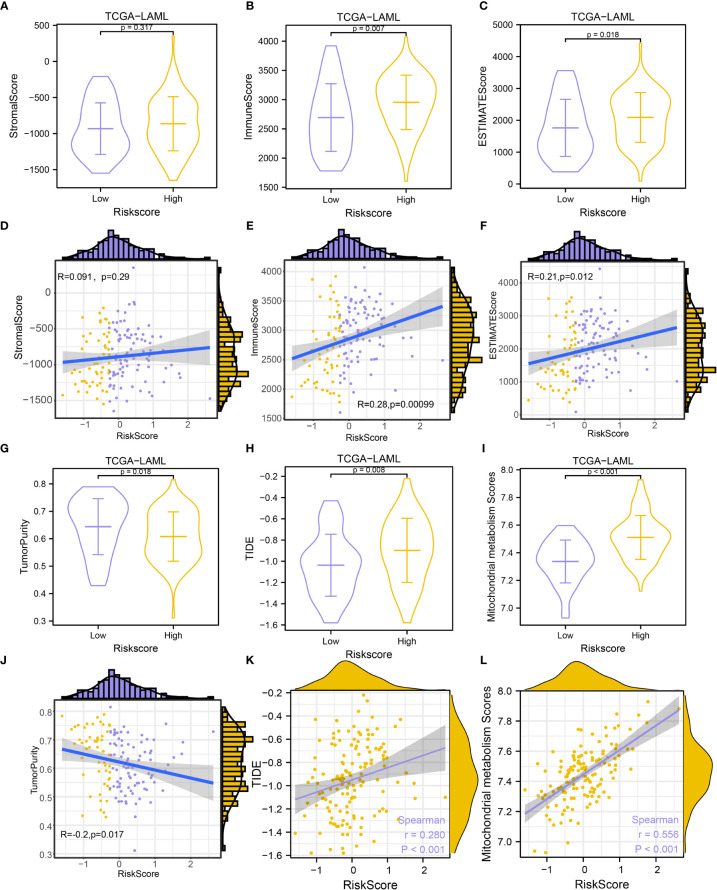
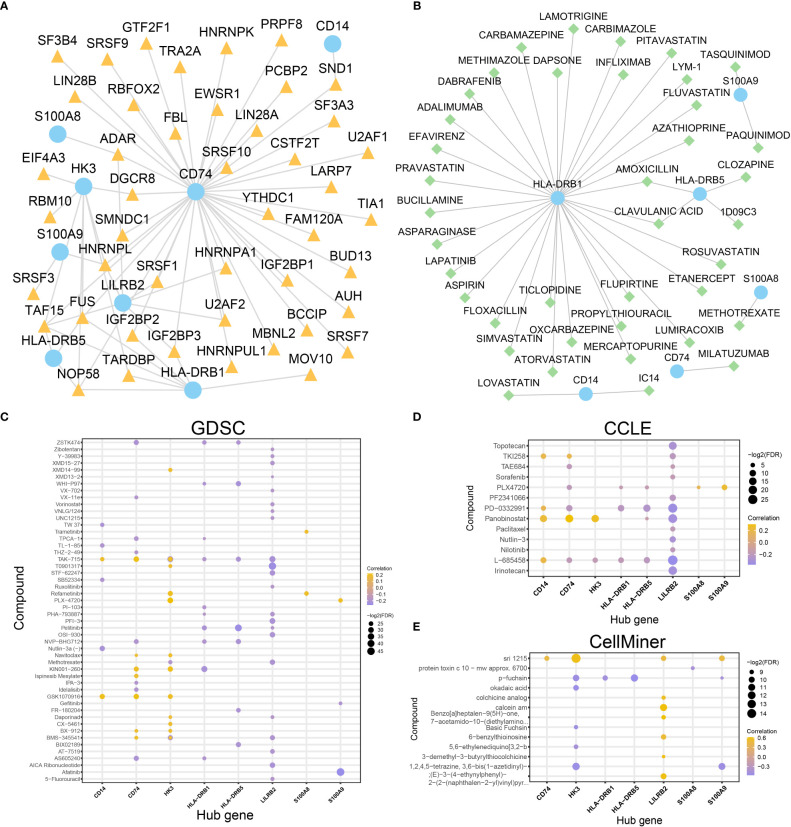
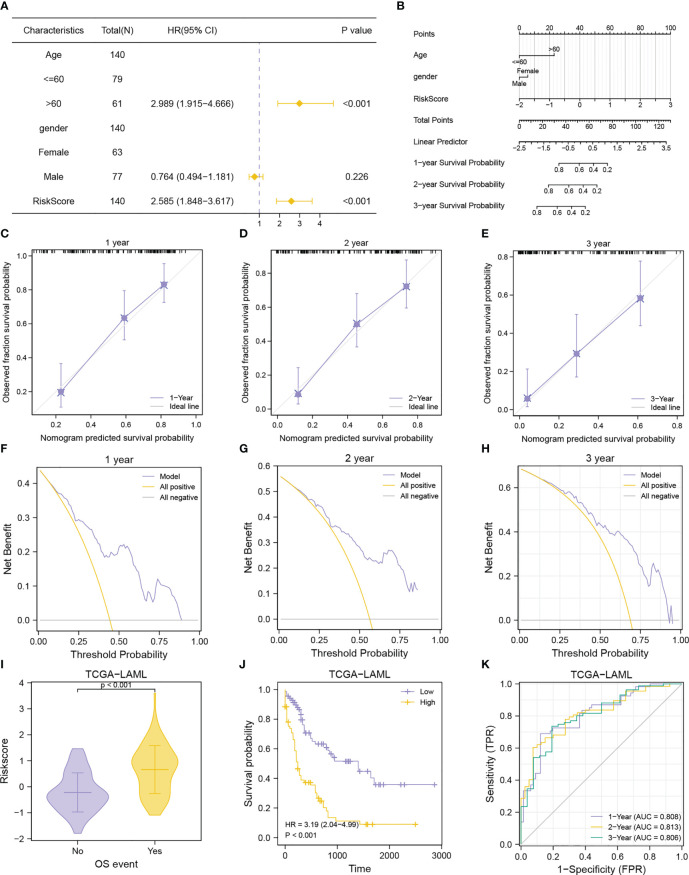
Results: Given the association of MMs with prognosis of AML patients, a prognosis model was constructed based on 5 MMRGs, which could accurately distinguish high-risk patients from low-risk patients in both training and validation datasets. IHC results showed that MMRGs were highly expressed in AML samples compared to normal samples. Additionally, the 38 DEGs were mainly related to mitochondrial metabolism, immune signaling, and multiple drug resistance pathways. In addition, high-risk patients with more immune-cell infiltration had higher Tumor Immune Dysfunction and Exclusion scores, indicating poor immunotherapy response. mRNA-drug interactions and drug sensitivity analyses were performed to explore potential druggable hub genes. Furthermore, we combined risk score with age and gender to construct a prognosis model, which could predict the prognosis of AML patients.
Conclusion: Our study provided a prognostic predictor for AML patients and revealed that mitochondrial metabolism is associated with immune regulation and drug resistant in AML, providing vital clues for immunotherapies.
Keywords: acute myeloid leukemia; drug sensitivity; mitochondrial metabolism; prognostic model; tumor microenvironment.
Copyright © 2023 Tong and Zhou.
Conflict of interest statement
The authors declare that the research was conducted in the absence of any commercial or financial relationships that could be construed as a potential conflict of interest.
Figures
Similar articles
-
A novel prognostic classification integrating lipid metabolism and immune co-related genes in acute myeloid leukemia.Front Immunol. 2023 Nov 10;14:1290968. doi: 10.3389/fimmu.2023.1290968. eCollection 2023. Front Immunol. 2023. PMID: 38022627 Free PMC article.
-
A transient receptor potential channel-related model based on machine learning for evaluating tumor microenvironment and immunotherapeutic strategies in acute myeloid leukemia.Front Immunol. 2022 Dec 16;13:1040661. doi: 10.3389/fimmu.2022.1040661. eCollection 2022. Front Immunol. 2022. PMID: 36591215 Free PMC article.
-
A prognostic model for laryngeal squamous cell carcinoma based on the mitochondrial metabolism-related genes.Transl Cancer Res. 2025 Feb 28;14(2):966-979. doi: 10.21037/tcr-24-1436. Epub 2025 Feb 18. Transl Cancer Res. 2025. PMID: 40104737 Free PMC article.
-
An anoikis-related gene signature predicts prognosis in patients with acute myeloid leukemia and immunotherapy.Am J Cancer Res. 2024 Nov 15;14(11):5116-5132. doi: 10.62347/MJTA2660. eCollection 2024. Am J Cancer Res. 2024. PMID: 39659934 Free PMC article. Review.
-
Role of interleukins in acute myeloid leukemia.Leuk Lymphoma. 2023 Jul-Aug;64(8):1400-1413. doi: 10.1080/10428194.2023.2218508. Epub 2023 Jun 1. Leuk Lymphoma. 2023. PMID: 37259867 Review.
Cited by
-
Monocytic Differentiation in Acute Myeloid Leukemia Cells: Diagnostic Criteria, Biological Heterogeneity, Mitochondrial Metabolism, Resistance to and Induction by Targeted Therapies.Int J Mol Sci. 2024 Jun 8;25(12):6356. doi: 10.3390/ijms25126356. Int J Mol Sci. 2024. PMID: 38928061 Free PMC article. Review.
-
A novel mitochondrial metabolism-related gene signature for predicting the prognosis of oesophageal squamous cell carcinoma.Aging (Albany NY). 2024 Jun 5;16(11):9649-9679. doi: 10.18632/aging.205892. Epub 2024 Jun 5. Aging (Albany NY). 2024. PMID: 38843392 Free PMC article.
-
Prognostic implications of metabolism-related genes in acute myeloid leukemia.Front Genet. 2024 Oct 3;15:1424365. doi: 10.3389/fgene.2024.1424365. eCollection 2024. Front Genet. 2024. PMID: 39421301 Free PMC article.
-
Proteomic Comparison of Acute Myeloid Leukemia Cells and Normal CD34+ Bone Marrow Cells: Studies of Leukemia Cell Differentiation and Regulation of Iron Metabolism/Ferroptosis.Proteomes. 2025 Feb 17;13(1):11. doi: 10.3390/proteomes13010011. Proteomes. 2025. PMID: 39982321 Free PMC article.
-
Ferritin in Acute Myeloid Leukemia: Not Only a Marker of Inflammation and Iron Overload, but Also a Regulator of Cellular Iron Metabolism, Signaling and Communication.Int J Mol Sci. 2025 Jun 15;26(12):5744. doi: 10.3390/ijms26125744. Int J Mol Sci. 2025. PMID: 40565207 Free PMC article. Review.
References
Publication types
MeSH terms
LinkOut - more resources
Full Text Sources
Medical