

Next generation immuno-oncology tumor profiling using a rapid, non-invasive, computational biophysics biomarker in early-stage breast cancer
- PMID: 37138891
- PMCID: PMC10149754
- DOI: 10.3389/frai.2023.1153083
Next generation immuno-oncology tumor profiling using a rapid, non-invasive, computational biophysics biomarker in early-stage breast cancer
Abstract
Background: Immuno-oncology (IO) therapies targeting the PD-1/PD-L1 axis, such as immune checkpoint inhibitor (ICI) antibodies, have emerged as promising treatments for early-stage breast cancer (ESBC). Despite immunotherapy's clinical significance, the number of benefiting patients remains small, and the therapy can prompt severe immune-related events. Current pathologic and transcriptomic predictions of IO response are limited in terms of accuracy and rely on single-site biopsies, which cannot fully account for tumor heterogeneity. In addition, transcriptomic analyses are costly and time-consuming. We therefore constructed a computational biomarker coupling biophysical simulations and artificial intelligence-based tissue segmentation of dynamic contrast-enhanced magnetic resonance imaging (DCE-MRIs), enabling IO response prediction across the entire tumor.
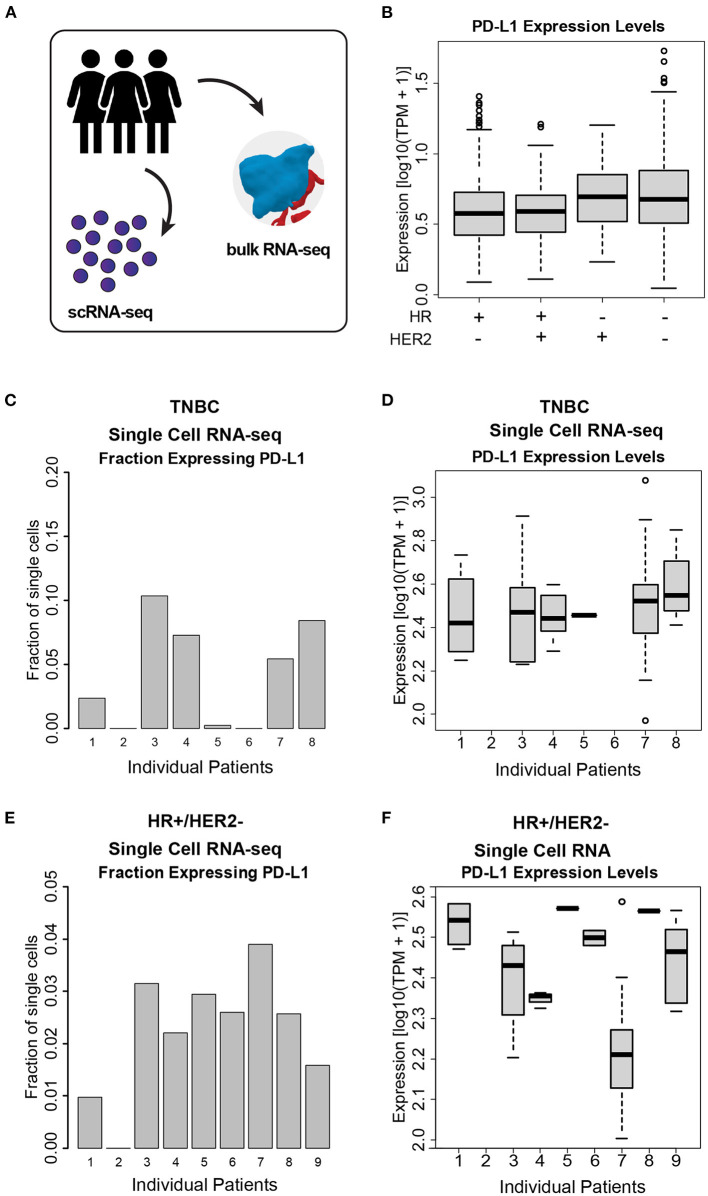
Methods: By analyzing both single-cell and whole-tissue RNA-seq data from non-IO-treated ESBC patients, we associated gene expression levels of the PD-1/PD-L1 axis with local tumor biology. PD-L1 expression was then linked to biophysical features derived from DCE-MRIs to generate spatially- and temporally-resolved atlases (virtual tumors) of tumor biology, as well as the TumorIO biomarker of IO response. We quantified TumorIO within patient virtual tumors (n = 63) using integrative modeling to train and develop a corresponding TumorIO Score.
Results: We validated the TumorIO biomarker and TumorIO Score in a small, independent cohort of IO-treated patients (n = 17) and correctly predicted pathologic complete response (pCR) in 15/17 individuals (88.2% accuracy), comprising 10/12 in triple negative breast cancer (TNBC) and 5/5 in HR+/HER2- tumors. We applied the TumorIO Score in a virtual clinical trial (n = 292) simulating ICI administration in an IO-naïve cohort that underwent standard chemotherapy. Using this approach, we predicted pCR rates of 67.1% for TNBC and 17.9% for HR+/HER2- tumors with addition of IO therapy; comparing favorably to empiric pCR rates derived from published trials utilizing ICI in both cancer subtypes.
Conclusion: The TumorIO biomarker and TumorIO Score represent a next generation approach using integrative biophysical analysis to assess cancer responsiveness to immunotherapy. This computational biomarker performs as well as PD-L1 transcript levels in identifying a patient's likelihood of pCR following anti-PD-1 IO therapy. The TumorIO biomarker allows for rapid IO profiling of tumors and may confer high clinical decision impact to further enable personalized oncologic care.
Keywords: ESBC; ICI; biophysical simulation; computational biomarker; immune checkpoint inhibitor; immuno-oncology; virtual clinical trial; virtual tumors.
Copyright © 2023 Cook, Biancalana, Liadis, Lopez Ramos, Zhang, Patel, Peterson, Pfeiffer, Cole and Antony.
Conflict of interest statement
All authors are employed by SimBioSys, Inc. and are involved in the commercial development of the Simul-omics 4D Engine, the TumorIO biomarker, and the TumorIO Score.
Figures


Similar articles
-
Translation of the 27-gene immuno-oncology test (IO score) to predict outcomes in immune checkpoint inhibitor treated metastatic urothelial cancer patients.J Transl Med. 2022 Aug 16;20(1):370. doi: 10.1186/s12967-022-03563-9. J Transl Med. 2022. PMID: 35974414 Free PMC article.
-
Association of a novel 27-gene immuno-oncology assay with efficacy of immune checkpoint inhibitors in advanced non-small cell lung cancer.BMC Cancer. 2022 Apr 14;22(1):407. doi: 10.1186/s12885-022-09470-y. BMC Cancer. 2022. PMID: 35421940 Free PMC article.
-
Construction and validation of a gene expression classifier to predict immunotherapy response in primary triple-negative breast cancer.Commun Med (Lond). 2023 Jul 10;3(1):93. doi: 10.1038/s43856-023-00311-y. Commun Med (Lond). 2023. PMID: 37430006 Free PMC article.
-
Impact of pharmacodynamic biomarkers in immuno-oncology phase 1 clinical trials.Eur J Cancer. 2022 Sep;173:167-177. doi: 10.1016/j.ejca.2022.06.045. Epub 2022 Jul 21. Eur J Cancer. 2022. PMID: 35872510 Review.
-
Recent Advances in Immune Checkpoint Inhibitors for Triple-Negative Breast Cancer.Immunotargets Ther. 2025 Apr 3;14:339-357. doi: 10.2147/ITT.S495751. eCollection 2025. Immunotargets Ther. 2025. PMID: 40196378 Free PMC article. Review.
Cited by
-
Validation of Clinical Dynamic Contrast-Enhanced Magnetic Resonance Imaging Perfusion Modeling and Neoadjuvant Chemotherapy Response Prediction in Breast Cancer Using 18FDG and 64Cu-DOTA-Trastuzumab Positron Emission Tomography Studies.JCO Clin Cancer Inform. 2025 Jan;9:e2300248. doi: 10.1200/CCI.23.00248. Epub 2025 Jan 14. JCO Clin Cancer Inform. 2025. PMID: 39808751
-
Radiology and multi-scale data integration for precision oncology.NPJ Precis Oncol. 2024 Jul 26;8(1):158. doi: 10.1038/s41698-024-00656-0. NPJ Precis Oncol. 2024. PMID: 39060351 Free PMC article. Review.
-
Revolutionizing breast cancer immunotherapy by integrating AI and nanotechnology approaches: review of current applications and future directions.Bioelectron Med. 2025 May 30;11(1):13. doi: 10.1186/s42234-025-00173-w. Bioelectron Med. 2025. PMID: 40442841 Free PMC article. Review.
-
Performance of an AI-powered visualization software platform for precision surgery in breast cancer patients.NPJ Breast Cancer. 2024 Nov 14;10(1):98. doi: 10.1038/s41523-024-00696-6. NPJ Breast Cancer. 2024. PMID: 39543194 Free PMC article.
-
Non-Invasive Biomarkers in the Era of Big Data and Machine Learning.Sensors (Basel). 2025 Feb 25;25(5):1396. doi: 10.3390/s25051396. Sensors (Basel). 2025. PMID: 40096210 Free PMC article. Review.
References
-
- Bonsang-Kitzis H., Sadacca B., Hamy-Petit A. S., Moarii M., Pinheiro A., Laurent C., et al. . (2016). Biological network-driven gene selection identifies a stromal immune module as a key determinant of triple-negative breast carcinoma prognosis. Oncoimmunology 5, 1061176. 10.1080/2162402X.2015.1061176 - DOI - PMC - PubMed
-
- Caballo M., Sanderink W. B. G., Han L., Gao Y., Athanasiou A., Mann R. M., et al. . (2022). Four-dimensional machine learning radiomics for the pretreatment assessment of breast cancer pathologic complete response to neoadjuvant chemotherapy in dynamic contrast-enhanced MRI. J. Magnet. Reson. Imag. 2022, 28273. 10.1002/jmri.28273 - DOI - PMC - PubMed
LinkOut - more resources
Full Text Sources
Research Materials
Miscellaneous