. 2023 May 1;5(2):zcad018.
doi: 10.1093/narcan/zcad018. eCollection 2023 Jun.

Therapeutic disruption of RAD52-ssDNA complexation via novel drug-like inhibitors

Affiliations

Therapeutic disruption of RAD52-ssDNA complexation via novel drug-like inhibitors

Divya S Bhat et al. NAR Cancer. .

Abstract

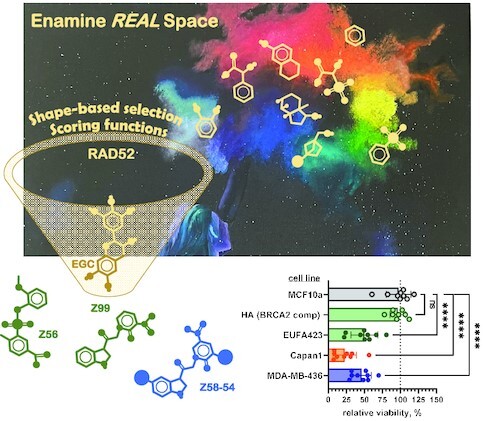
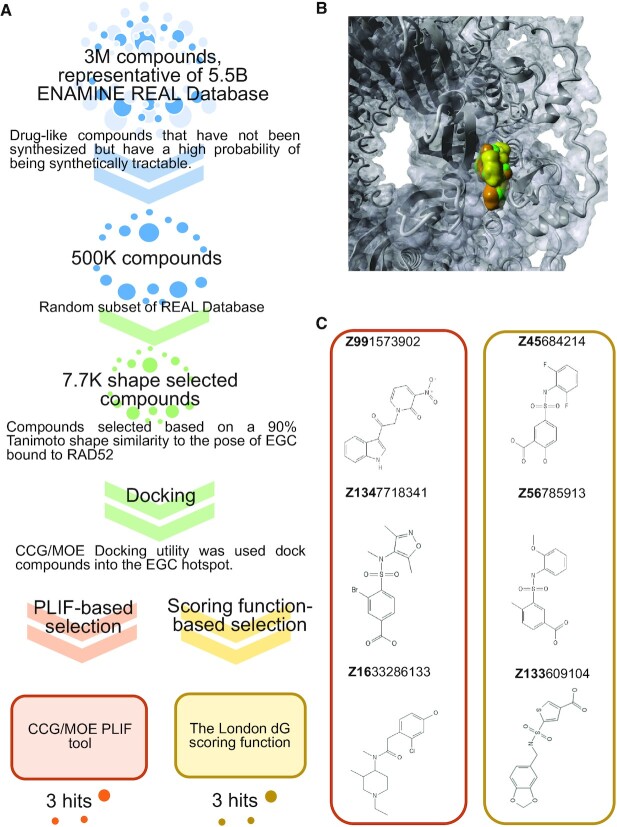
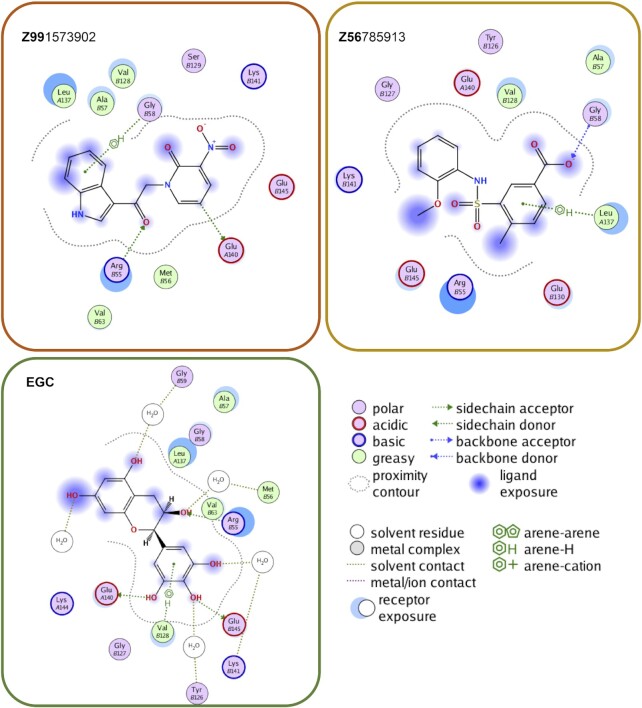
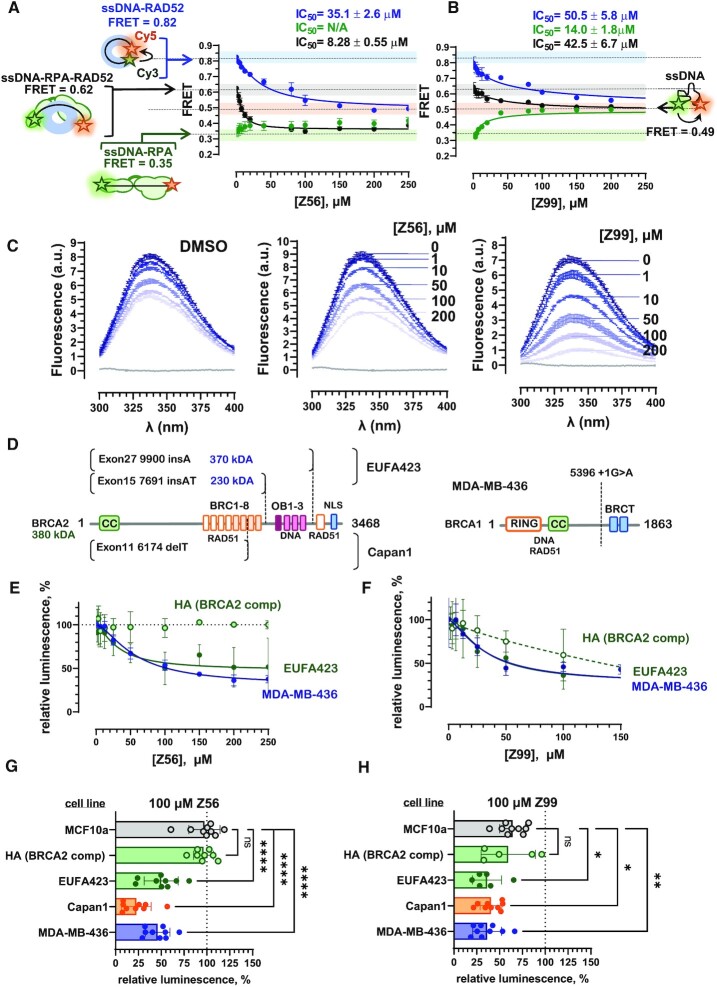
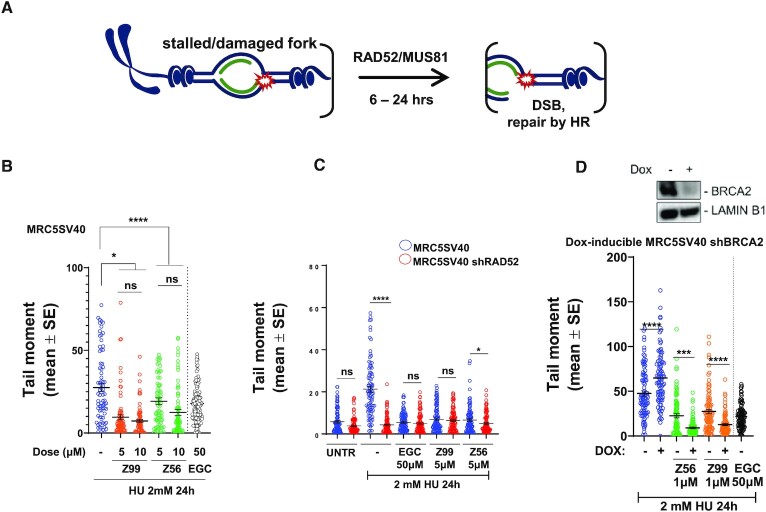
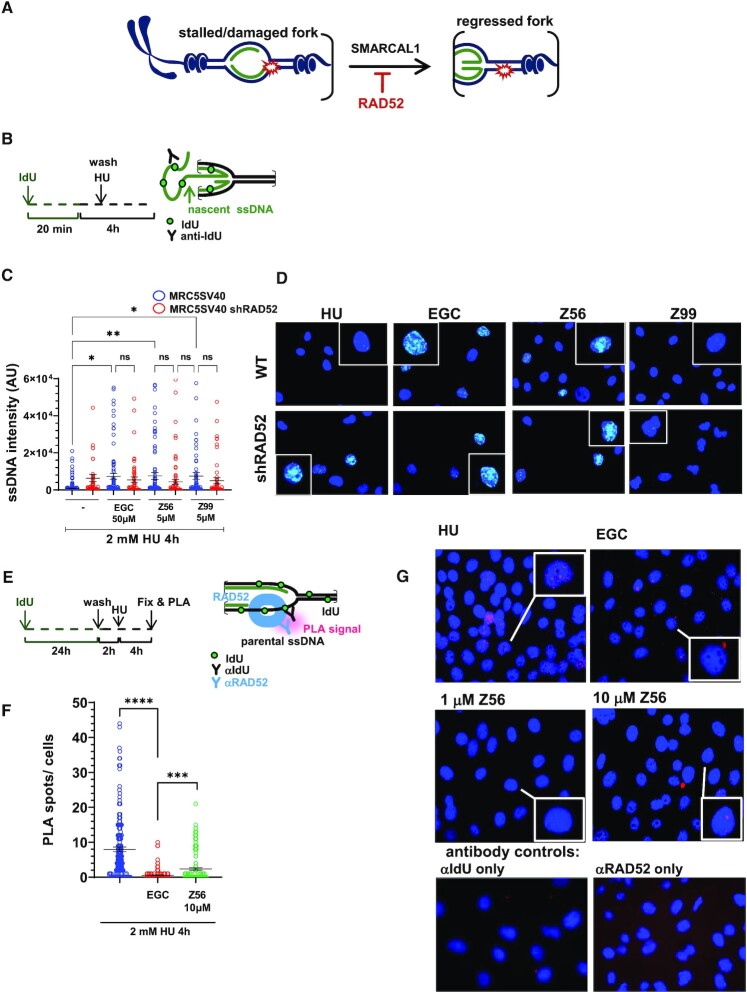
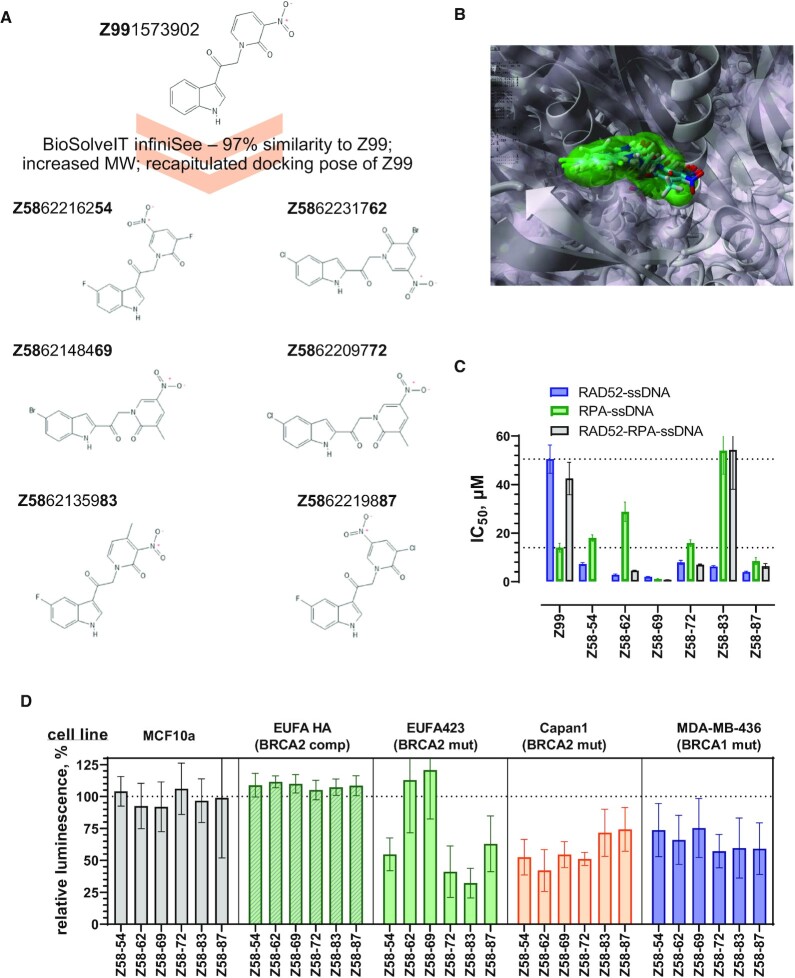
RAD52 protein is a coveted target for anticancer drug discovery. Similar to poly-ADP-ribose polymerase (PARP) inhibitors, pharmacological inhibition of RAD52 is synthetically lethal with defects in genome caretakers BRCA1 and BRCA2 (∼25% of breast and ovarian cancers). Emerging structure activity relationships for RAD52 are complex, making it challenging to transform previously identified disruptors of the RAD52-ssDNA interaction into drug-like leads using traditional medicinal chemistry approaches. Using pharmacophoric informatics on the RAD52 complexation by epigallocatechin (EGC), and the Enamine in silico REAL database, we identified six distinct chemical scaffolds that occupy the same physical space on RAD52 as EGC. All six were RAD52 inhibitors (IC50 ∼23-1200 μM) with two of the compounds (Z56 and Z99) selectively killing BRCA-mutant cells and inhibiting cellular activities of RAD52 at micromolar inhibitor concentrations. While Z56 had no effect on the ssDNA-binding protein RPA and was toxic to BRCA-mutant cells only, Z99 inhibited both proteins and displayed toxicity towards BRCA-complemented cells. Optimization of the Z99 scaffold resulted in a set of more powerful and selective inhibitors (IC50 ∼1.3-8 μM), which were only toxic to BRCA-mutant cells. RAD52 complexation by Z56, Z99 and its more specific derivatives provide a roadmap for next generation of cancer therapeutics.


Figures

Graphical Abstract
Graphical Abstract
Exploration of the Enamine in silico REAL space of billions of potential compounds yielded new drug-like inhibitors of the DNA repair protein RAD52. The compounds were further optimized to improve efficacy and specificity in targeting RAD52 in vitro and killing BRCA1 and BRCA2 deficient cancer cells.
Figure 1.
Figure 1.
Identification of RAD52 with new chemical scaffolds. (A) Workflow for scaffold hopping from EGC. Three million compound ENAMINE REAL database was narrowed to 7700 based on shape similarity to EGC and docked into the EGC pocket within the RAD52–ssDNA binding site (see text for details). Two methods were used to score the compounds: In the first approach (orange flow) CCG/MOE PLIF tool was used to create fingerprints for RAD52–ligand interactions, in order to find compounds mimicking the contacts of EGC and RAD52; in the second approach (green flow) the London dG scoring function was used to rank order compounds. Three top scoring compounds from each method were ordered. (B) Final poses for the EGC (green), Z99 (orange), and Z56 (gold) compounds bound to RAD52. (C) Top compounds selected from each computational approach, PLIF (orange box) and docking/scoring function (gold box).
Figure 2.
Figure 2.
Ligand maps for compounds Z99, Z56 and EGC. The interaction key is shown on the right. Among notable contacts, all three compounds interact with R55, one of the key residues in the DNA binding site of RAD52. In contrast to EGC, however, whose interactions are dominated by van der Waals interaction and water-mediated contacts, Z99 and Z56 are involved in more direct interactions including hydrogen bonding.
Figure 3.
Figure 3.
Specificity of the new synthetic compounds towards RAD52 versus RPA is important for selective killing of BRCA2-deficient cells. The in vitro FRET-based assays follow inhibition of the RAD52–ssDNA interaction (blue circles and lines), RPA–ssDNA interactions (green circles and lines), and the interaction between RAD52 and RPA–ssDNA complex (black circles and lines) by Z56 (A) and Z99 (B) compounds. Complexes at the starting point of inhibitor titrations are depicted schematically on the left with respective FRET values indicated. The FRET values for these complexes are color cored on the graphs matching the respective inhibition curves. The free ssDNA is shown on the right with its respective FRET value and the light orange bar across the graphs that also signifies the endpoint of the inhibition reaction for displacing RAD52, RPA or RAD52 and RPA from ssDNA. The endpoint of the reactions where RAD52 is displaced from RPA-coated ssDNA is represented by the light green bar. The data shown as an average ± standard deviation for at least three independent measurements. Where invisible, the error bars are smaller than the respective symbols. Calculated IC50 values are shown above each graph. (C) Intrinsic tyrosine fluorescence-based analysis of the RAD52 complexation with Z56 and Z99 inhibitors. Tyrosine fluorescence, excited at 280 nm is presented as fluorescence spectra (each is an average ± standard deviation for three scans). Concentrations of each inhibitor are shown by their respective spectra. The change from the darker to lighter shades of blue correspond to increasing compound concentrations. Changes in fluorescence upon addition to equivalent amounts of DMSO are shown in the left panel. (D) Diagram of the BRCA2 truncations in two defective BRCA2 alleles of the EUFA423F cell line, and Capan1 cell line (left panel), and BRCA1 truncation in MDA-MB-436 cell line (right panel). In HA, the BRCA2 deficiency is complemented by expression of the full-length protein, while MCF10a cells have unaltered BRCA1 and BRCA2 genes. (E and F) Cell viability of BRCA-proficient (HA), BRCA1-mutated MDA-MB-436, and BRCA2-mutated EUFA423F cells as a function of Z56 (E) or Z99 concentrations was evaluated using CellTiter-Glo assay. The data are plotted as average ± standard deviation for at least three independent measurements. Hundred percent live cells corresponds to DMSO only control. (G and H) Cell viability was measured for 5 cell lines after 72 h treatment with 100 μM of Z56 (G) or Z99 (H). The data are shown as individual measurements along with average ± standard deviation for 9 independent measurements. The response of each cell lines was compared to MCF10a (ns = not significant P> 0.05; *P< 0.05; **P< 0.01; ***P< 0.001; ****P < 0.0001; ordinary ANOVA).
Figure 4.
Figure 4.
Z56 and Z99 interfere with RAD52-MUS81 function at stalled DNA replication forks. (A) Cartoon representation of fork cleavage by the RAD52-MUS81 axes. The presence of the DSBs can be detected using comet assay (B–D). (B) Evaluation of DSBs using Neutral Comet Assay. Cells were treated as indicated. Graph shows the mean of tail moment as mean ± SE (ns = not significant; ***P< 0.001; ****P < 0.0001; Mann–Whitney test). When indicated, cells were treated with inhibitors for 30 min before HU exposure. (C) Analysis of DSBs in MRC5 SV40 and MRC5 shRAD52 after HU exposure in presence or absence of RAD52 inhibitors (30 min before HU treatment). Graph shows the mean of tail moment ± SE (ns = not significant; *P< 0.1; ****P < 0.0001; Mann–Whitney test). (D) After 48 h of doxycycline induction cells were treated to perform neutral comet assay. Western blot shows BRCA2 level after doxycycline induction. LAMIN B1 was used as a loading control. Graph shows the mean of tail moment ± SE (****P < 0.0001; Mann–Whitney test).
Figure 5.
Figure 5.
Z56 and Z99 interfere with RAD52-dependent protection of stalled DNA replication forks. (A) Cartoon representation of SMARCAL1-mediated fork reversal. RAD52 inhibition stimulates fork reversal and nascent ssDNA exposure. (B) Experimental scheme of nascent ssDNA detection through Iododeoxyuridine (IdU) incorporation. (C) Analysis of nascent ssDNA after 2 mM hydroxyurea (HU) treatment in presence or absence of RAD52 inhibitors in MRC5 SV40 and MRC5 shRAD52 cell lines. Graph shows the intensity of ssDNA staining for single nuclei. Values are presented as means ± SE (ns = not significant; ***P< 0.001; ****P < 0.0001; Mann–Whitney test). (D) Representative images of nascent ssDNA in MRC5 SV40 cells and in MRC5 cells depleted of RAD52. DAPI-stained nuclei are shown in blue, nascent ssDNA signal is shown in light blue. Insets show enlarged images of representative nuclei. (E) Experimental scheme of Proximity Ligation Assay (PLA) after parental ssDNA labelling with IdU. (F) Analysis of DNA–RAD52 interactions by in situ PLA assay. Graphs show the mean of PLA spots per cell ± SE. Values are presented as mean ± SE (***P< 0.001; ****P < 0.0001; Mann–Whitney test). (G) Representative PLA images. DAPI-stained nuclei are shown in blue, PLA signals are shown in pink.
Figure 6.
Figure 6.
Compounds generated by expansion of the Z99 scaffold show improved efficacy in vitro and in cells. (A) Six new compounds were designed based on the Z99 scaffold. (B) Final poses of the scaffold expanded compounds docked into the EGC pocket of RAD52. Z99 is shown using surface representation, while the six new compounds are shown in stick representation. (C) IC50 values for the disruption of the RAD52–ssDNA interaction (blue bars), of the RPA–ssDNA interaction (green), and of the RPA–ssDNA-RAD52 complex (grey). Error bars represent fitting errors. The inhibition curves for all compounds are shown in Supplementary Figure S5. (D) Cell viability was measured using CellTiter-Glo assay for five cell lines after 72 h treatment with 10 μM of indicated compounds. Hundred percent live cells corresponds to DMSO only control. The data are shown as average ± standard deviation for nine independent wells. The detailed statistical analysis for each compound is shown in Supplementary Figure S7.

References

    1. Mortensen U.H., Lisby M., Rothstein R. Rad52. Curr. Biol. 2009; 19:R676–R677. - PubMed
    1. Muris D.F., Bezzubova O., Buerstedde J.M., Vreeken K., Balajee A.S., Osgood C.J., Troelstra C., Hoeijmakers J.H., Ostermann K., Schmidt H. et al. . Cloning of human and mouse genes homologous to RAD52, a yeast gene involved in DNA repair and recombination. Mutat Res. 1994; 315:295–305. - PubMed
    1. Bhat D.S., Spies M.A., Spies M. A moving target for drug discovery: structure activity relationship and many genome (de)stabilizing functions of the RAD52 protein. DNA Repair. 2022; 120:103421. - PMC - PubMed
    1. Cramer-Morales K., Nieborowska-Skorska M., Scheibner K., Padget M., Irvine D.A., Sliwinski T., Haas K., Lee J., Geng H., Roy D. et al. . Personalized synthetic lethality induced by targeting RAD52 in leukemias identified by gene mutation and expression profile. Blood. 2013; 122:1293–1304. - PMC - PubMed
    1. Lok B.H., Carley A.C., Tchang B., Powell S.N. RAD52 inactivation is synthetically lethal with deficiencies in BRCA1 and PALB2 in addition to BRCA2 through RAD51-mediated homologous recombination. Oncogene. 2013; 32:3552–3558. - PMC - PubMed